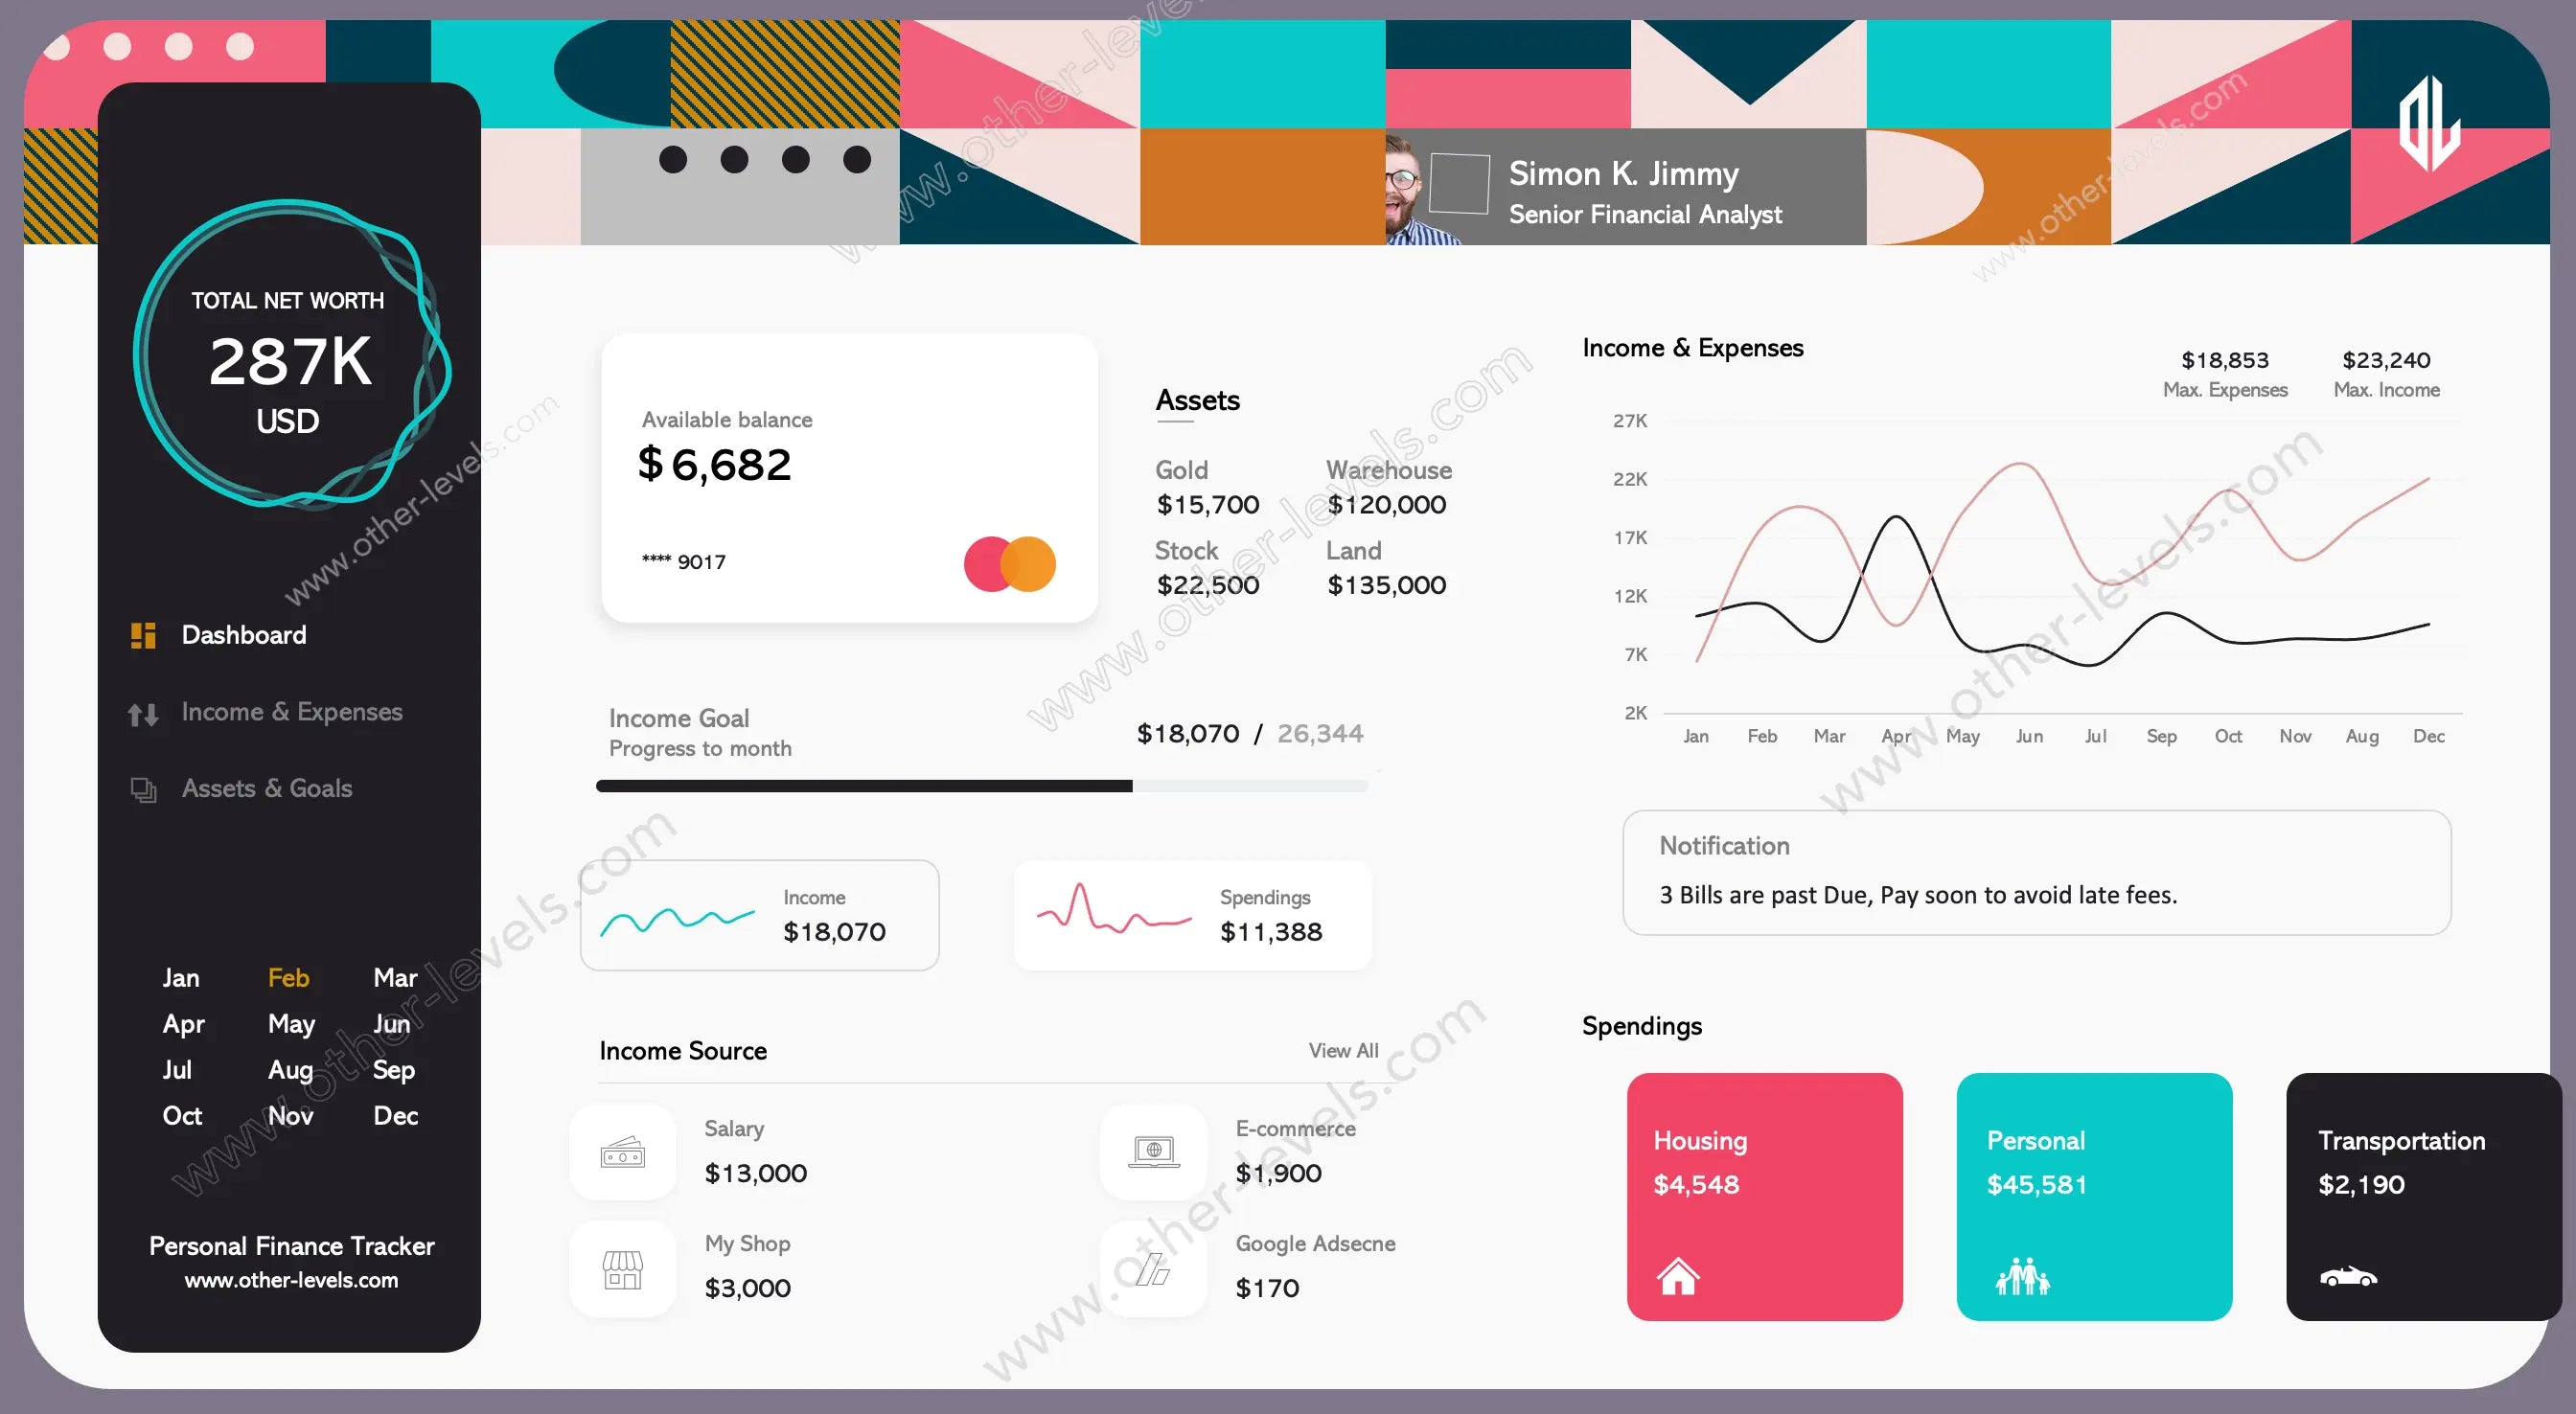
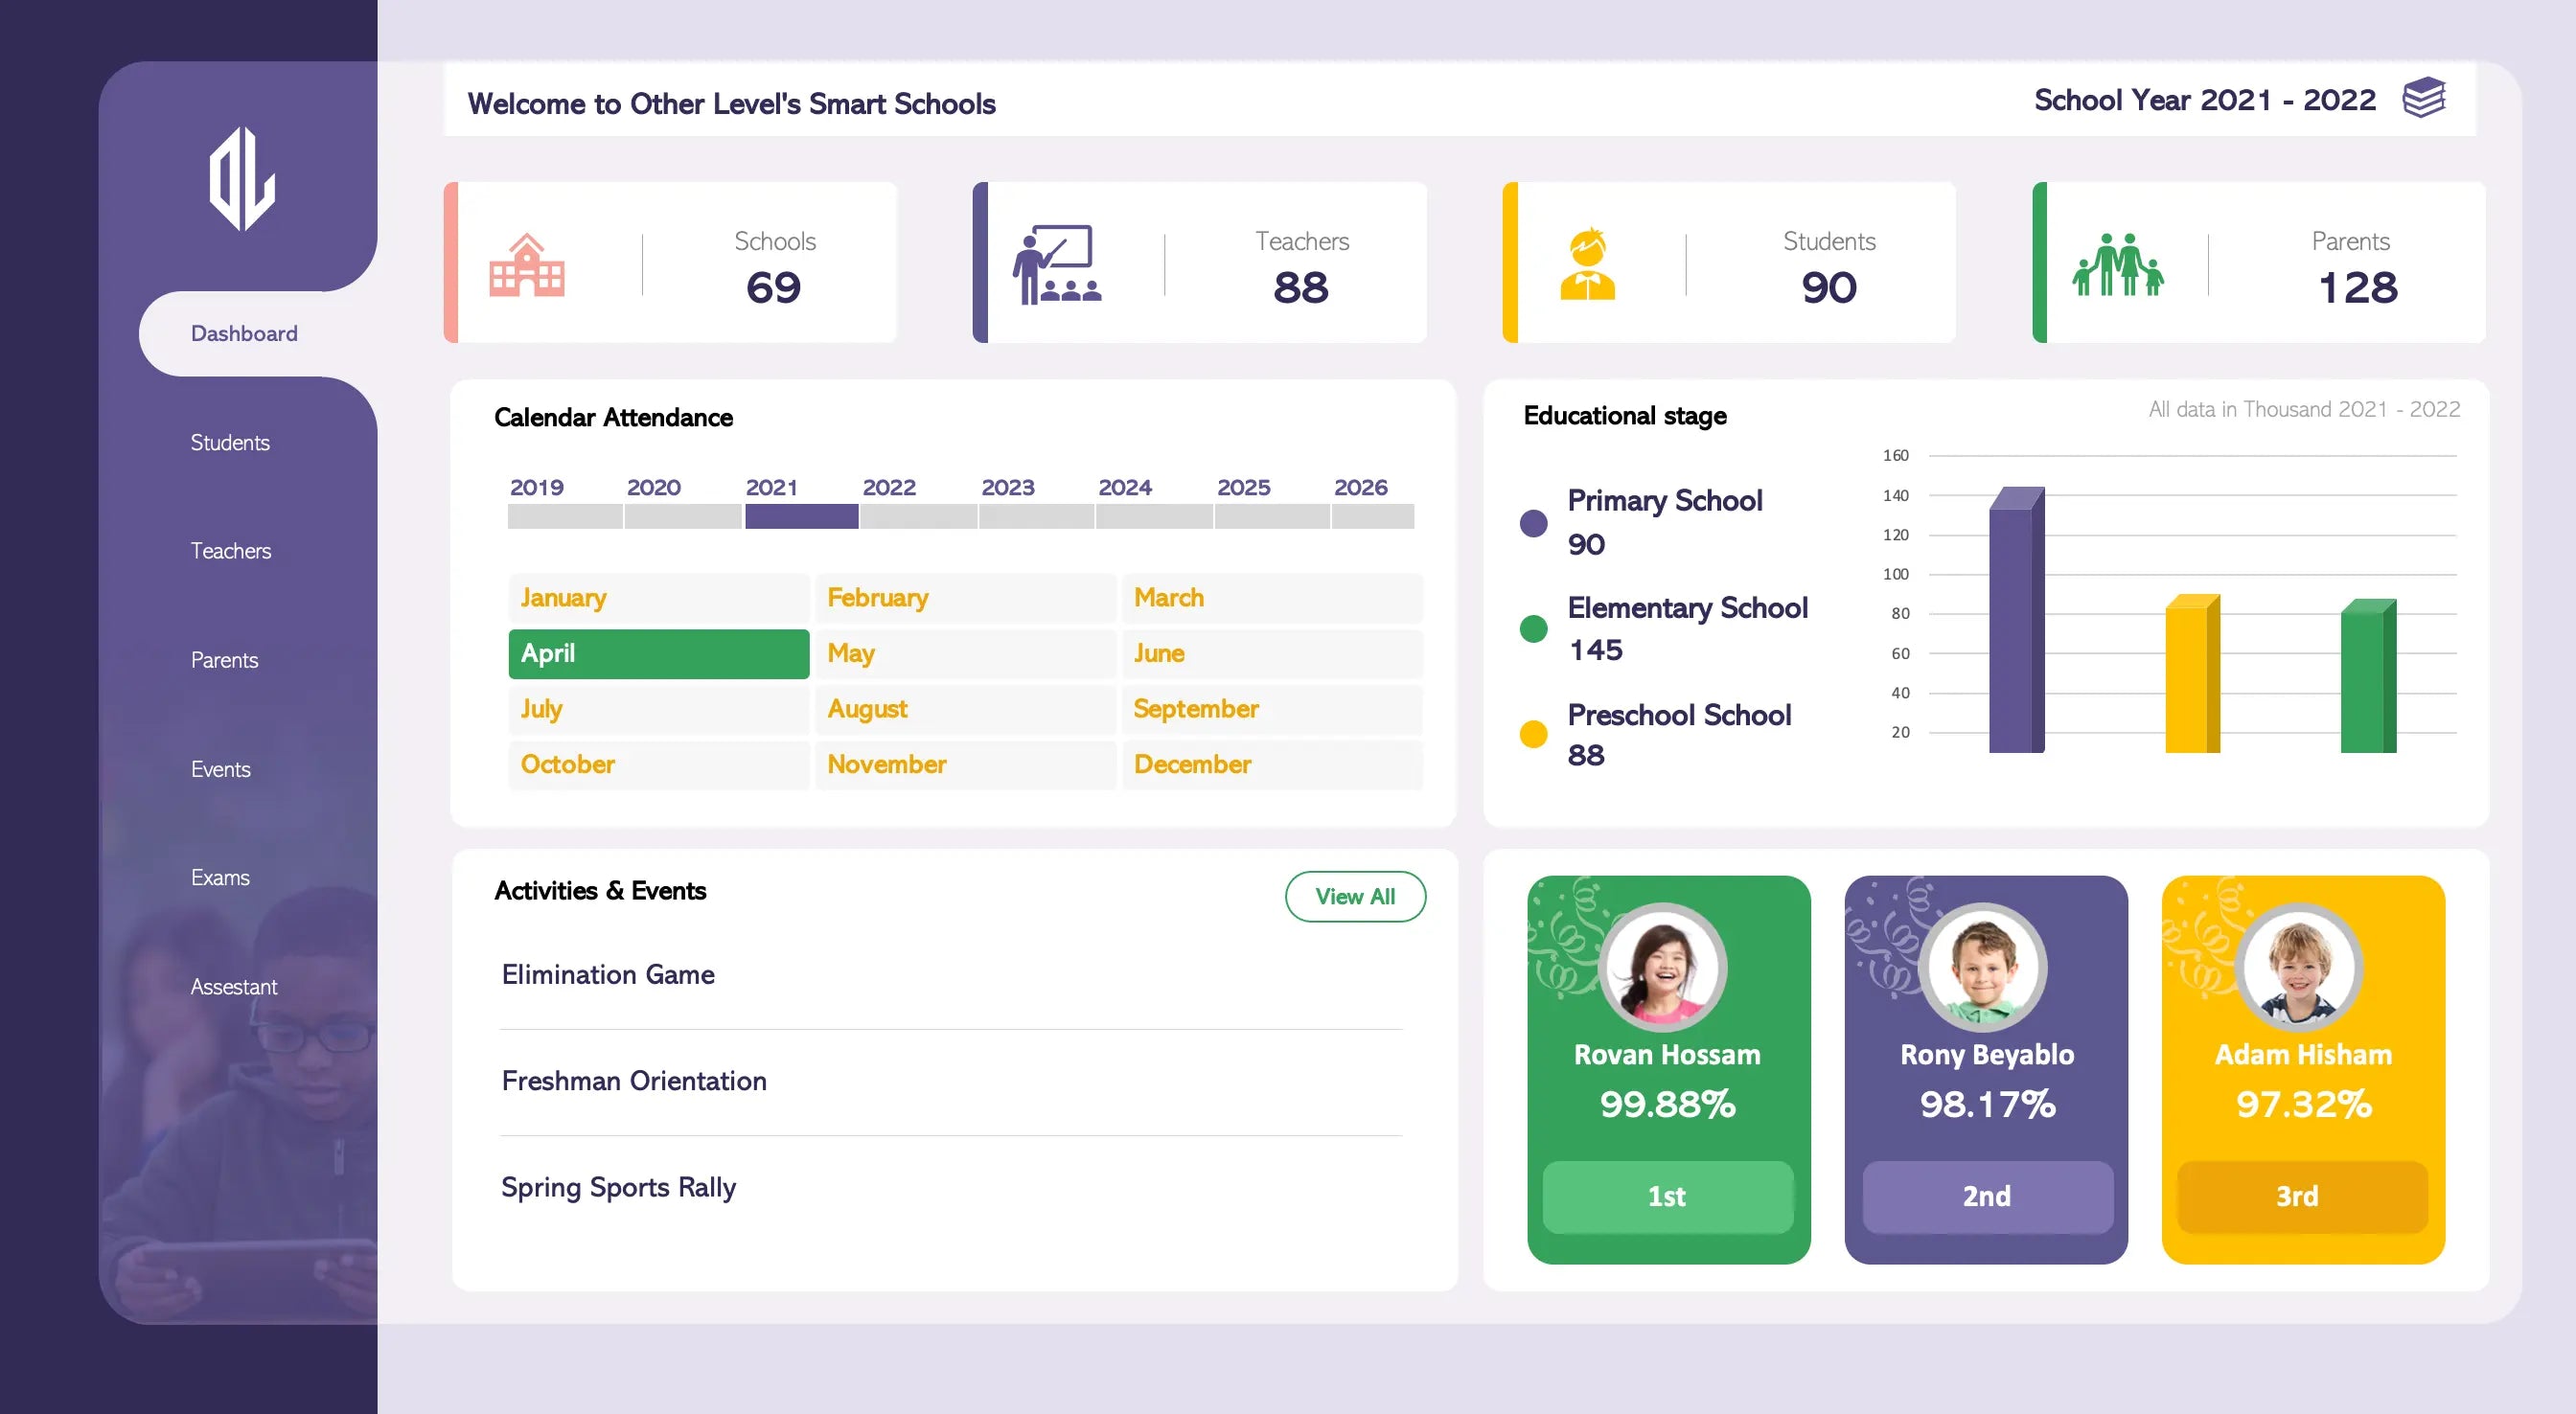
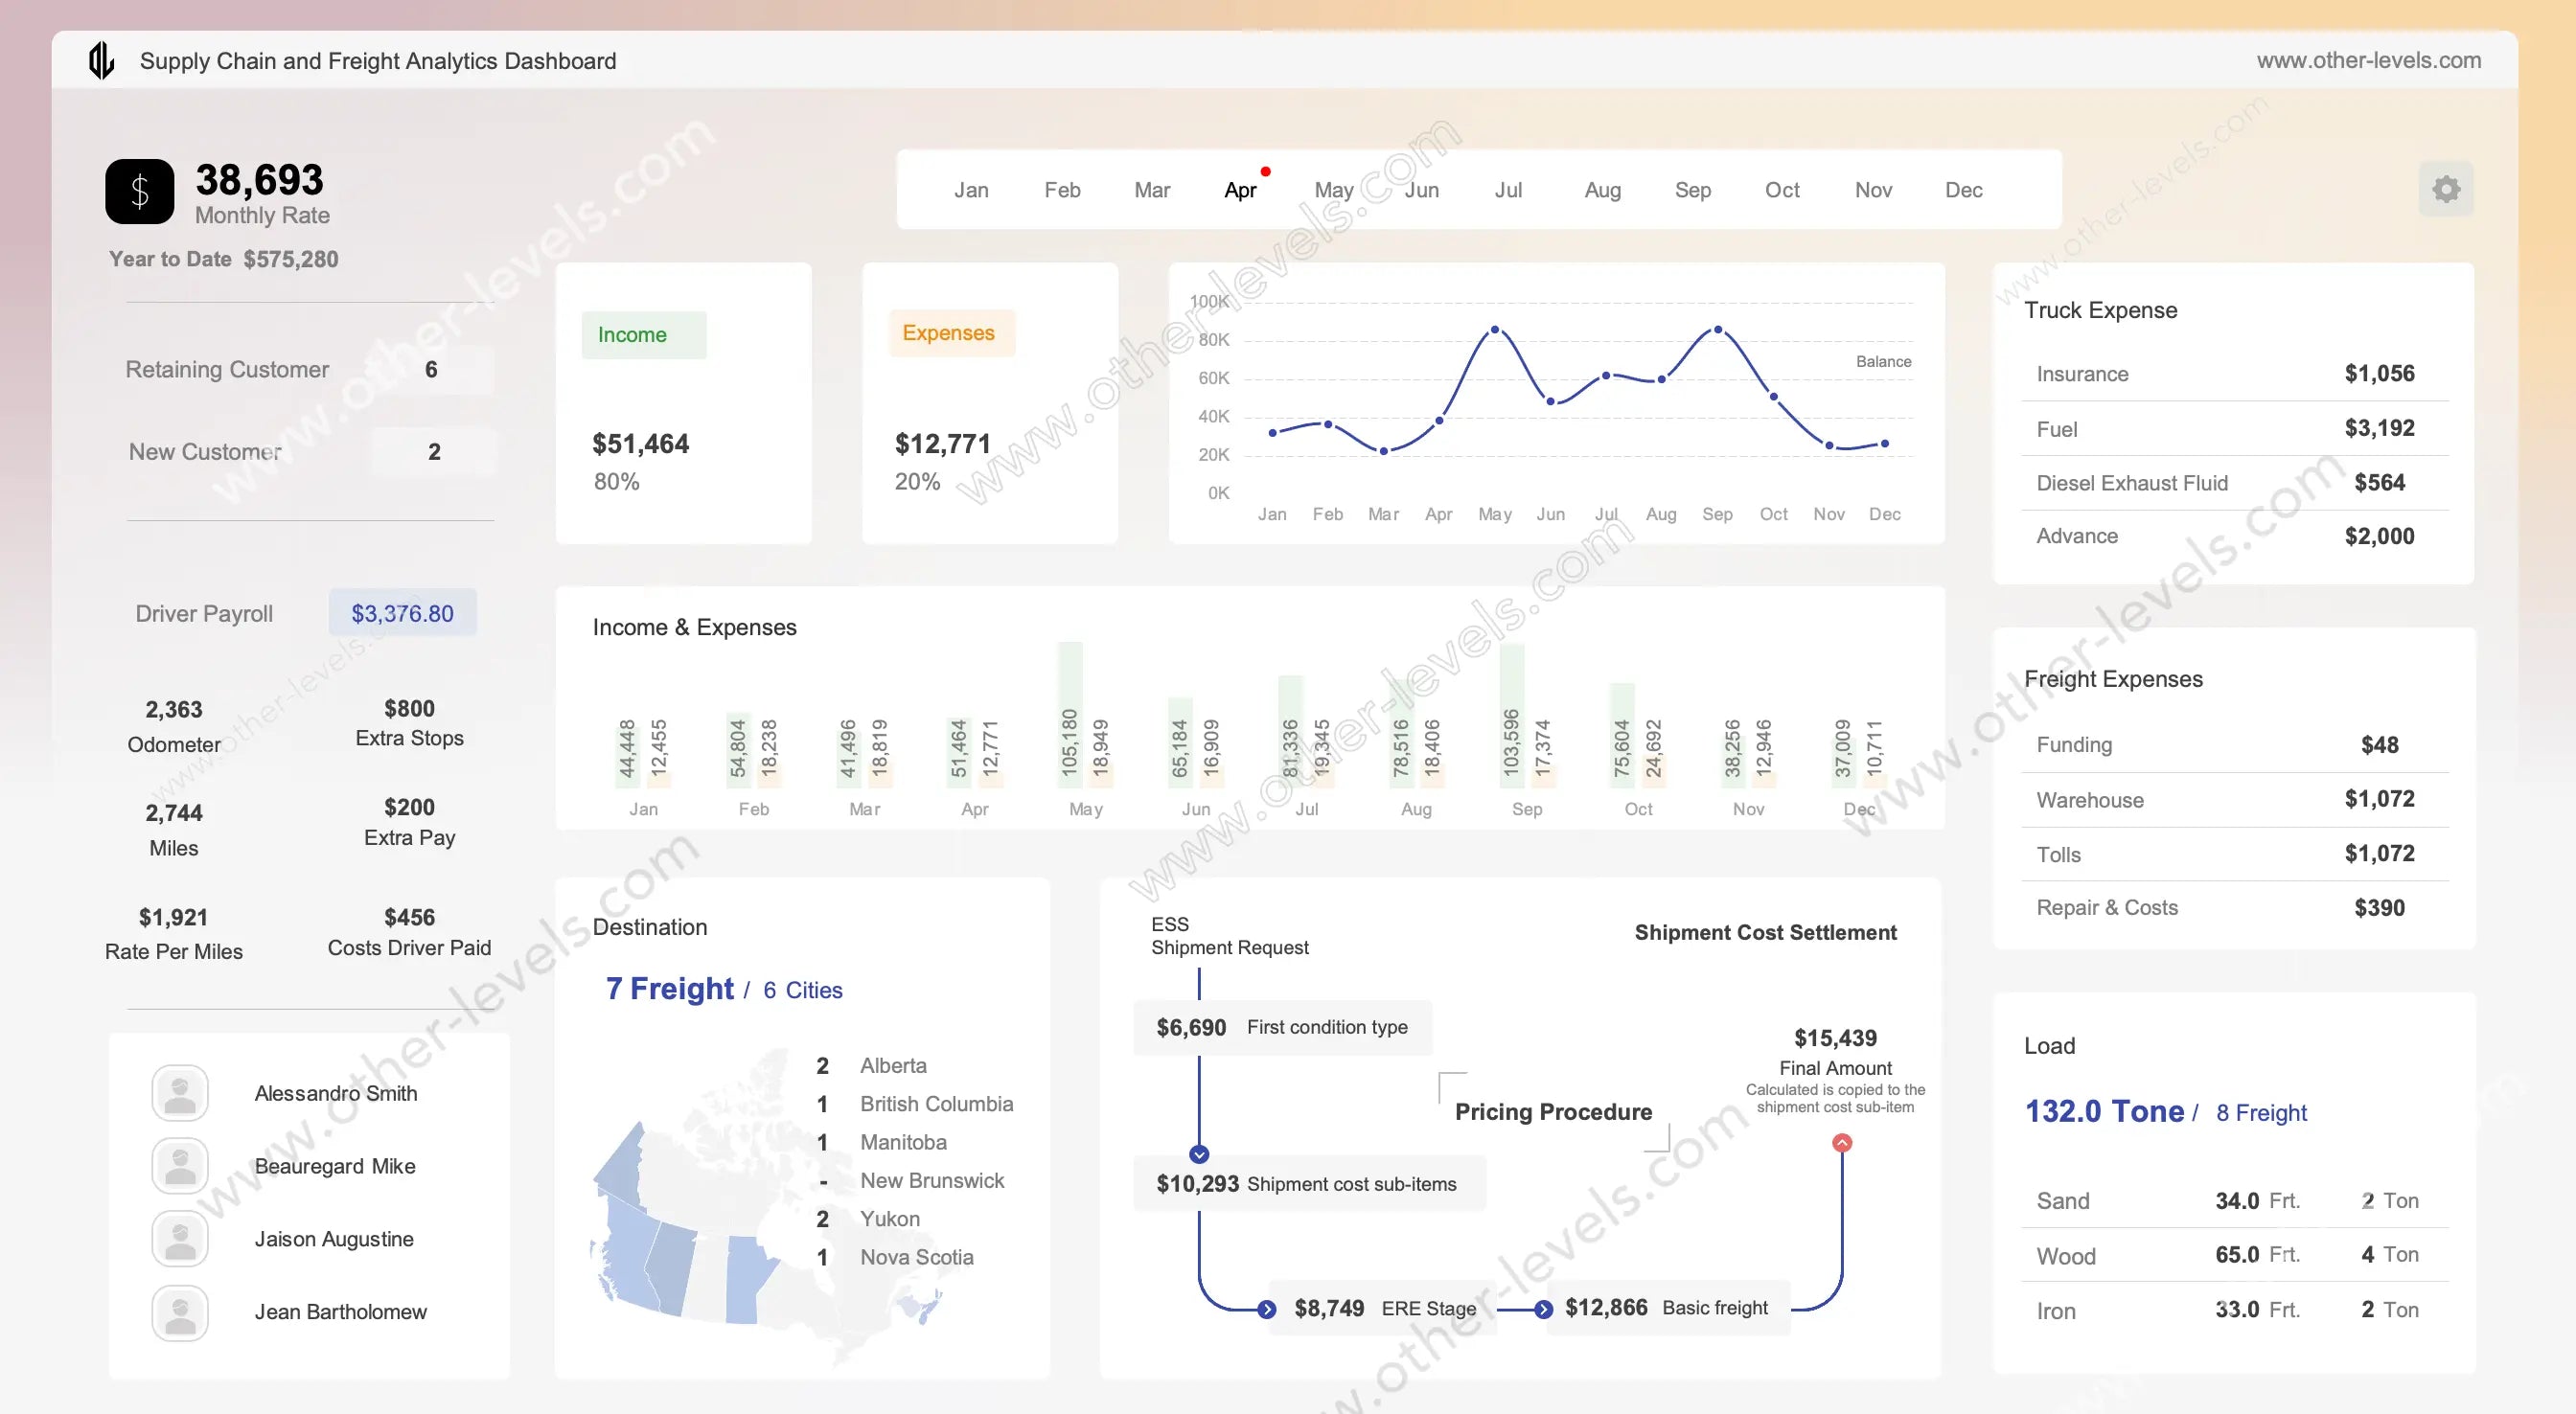
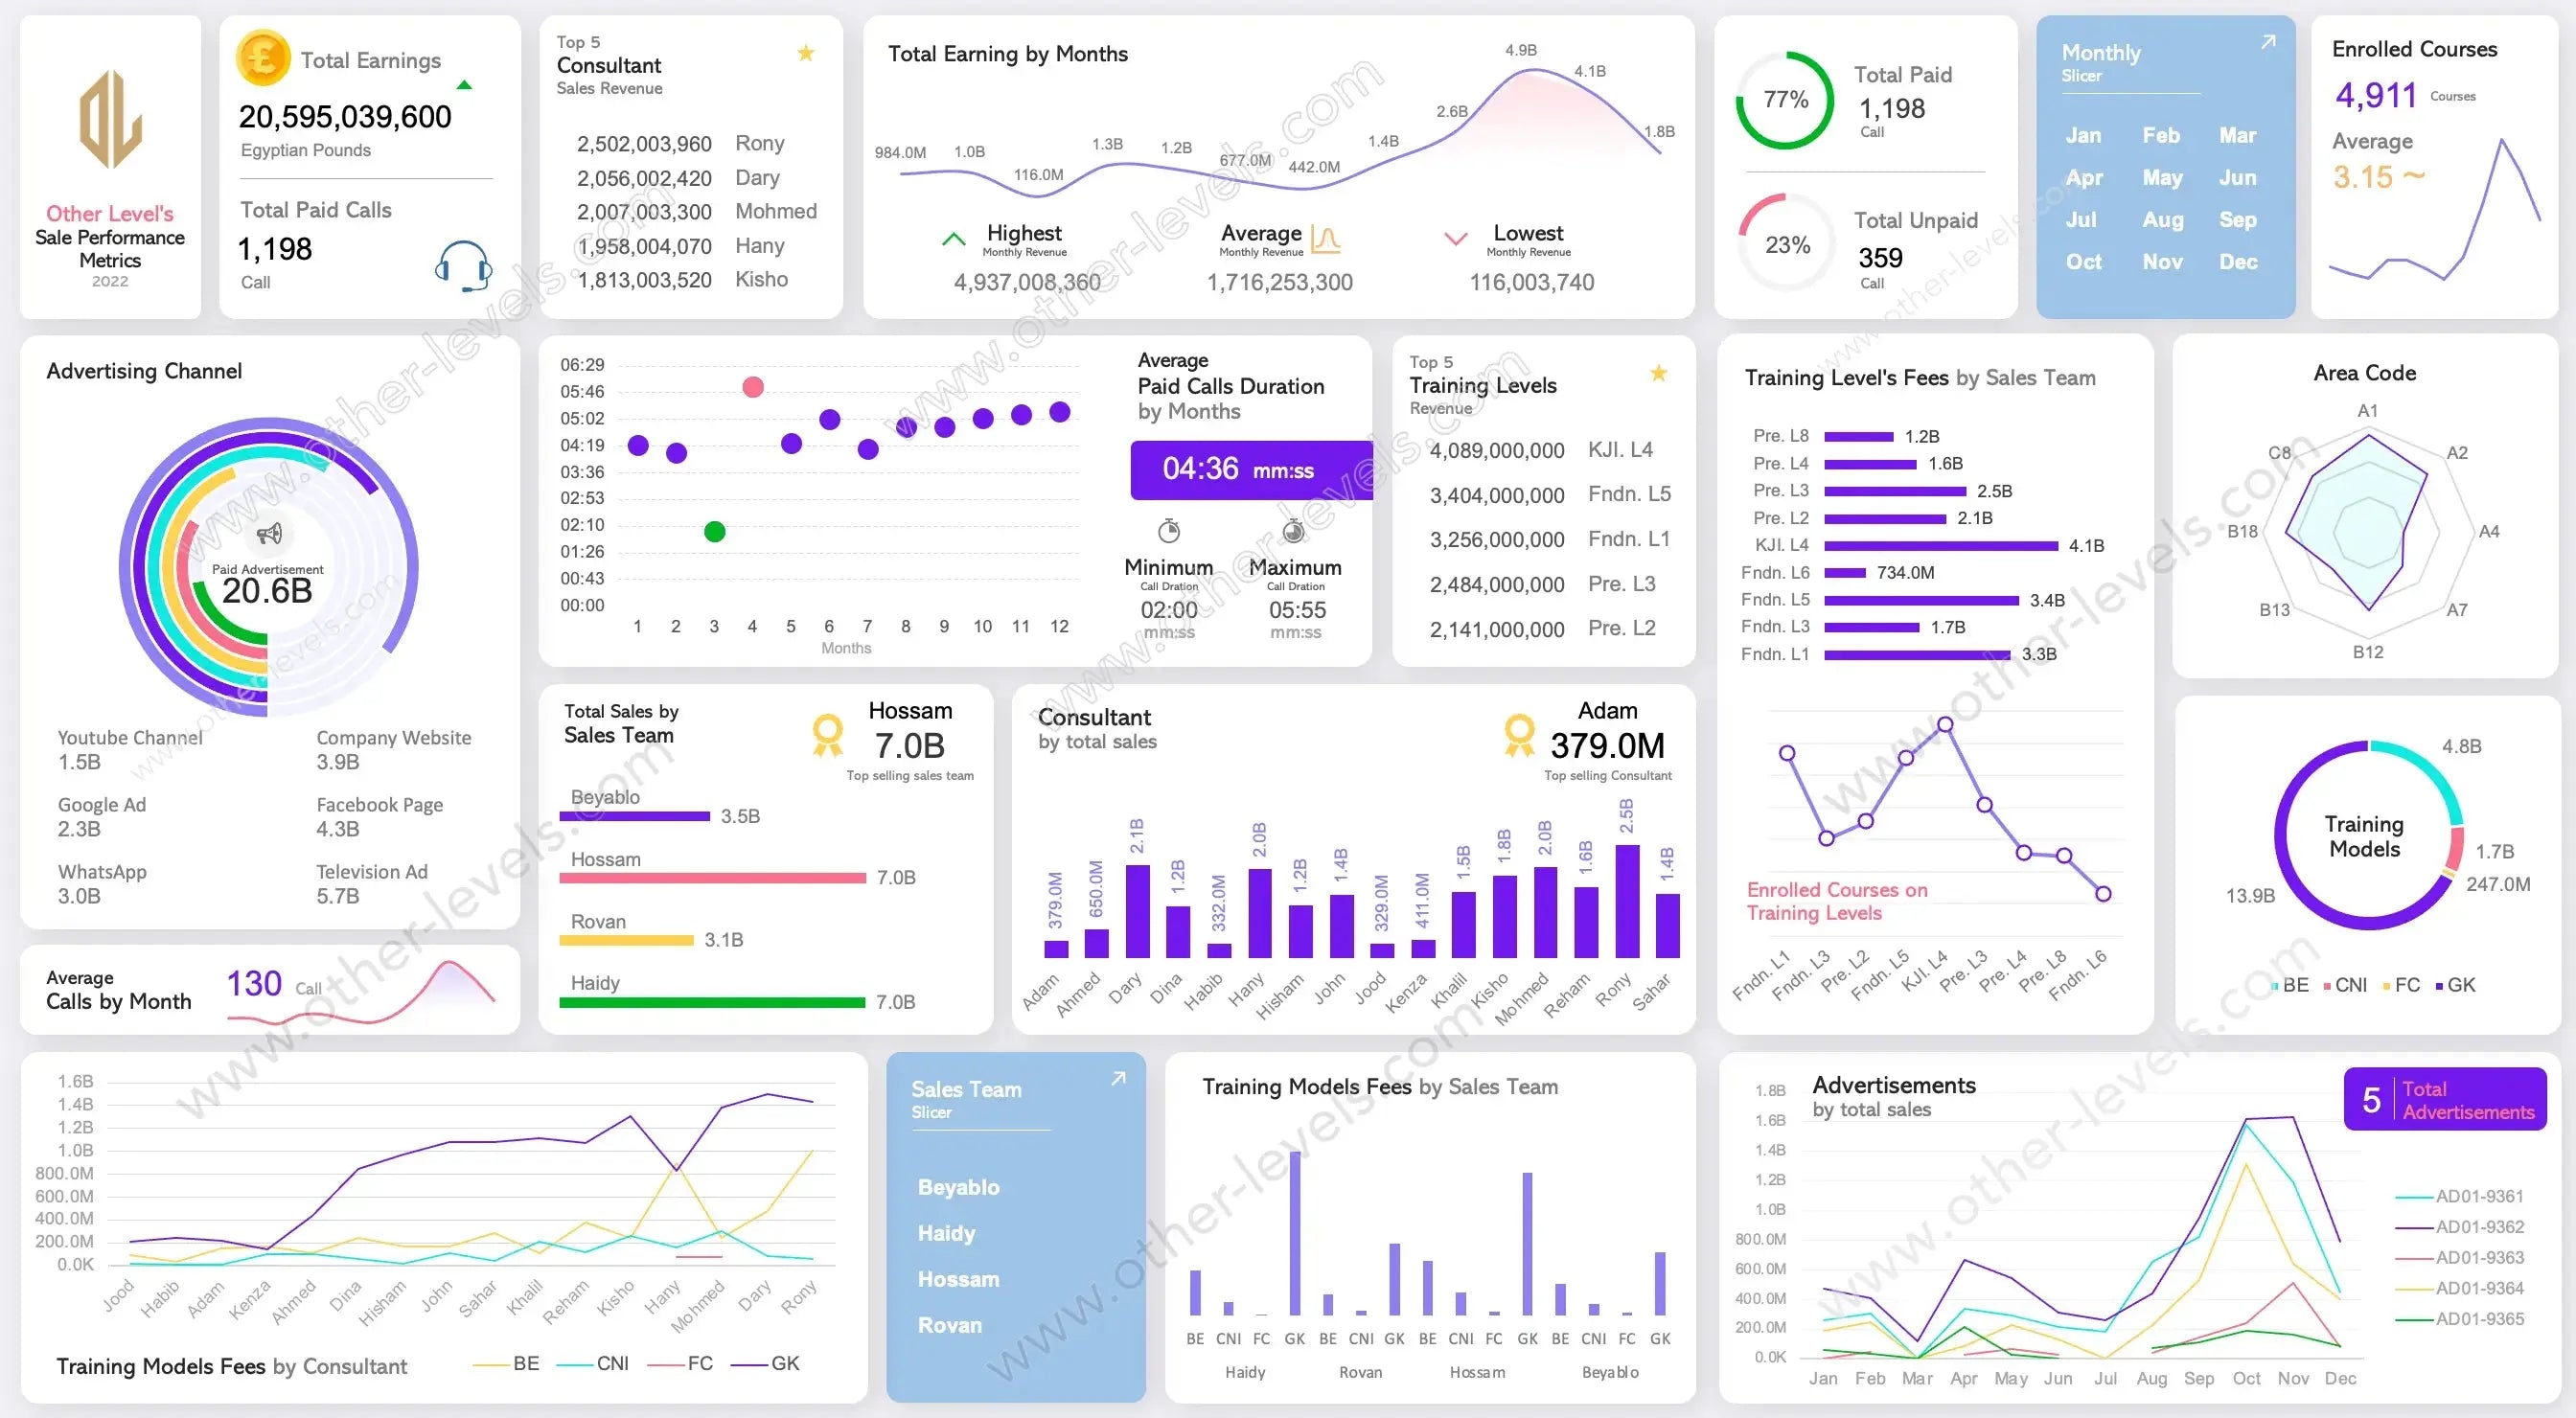
Project Tracker Google Sheets Dashboard – Business Analyst
Pairs well with
Project Tracker Google Sheets Dashboard – Business Analyst
Open the file and you’re home. This is your living, breathing project status dashboard. Think of it as a friendly project tracker that you can share in one link. No heavy setup. No steep learning curve.
Who it’s for (and why it works)
If you’re a business analyst or a business systems analyst, this fits right in. It also helps teams managing project managers or coordinating several project managers at once. Here’s the thing: everyone sees the same truth, updated in real time.
What you actually get
- A clean, ready-to-edit project status report template in Google Sheets.
- Charts and pivots wired into a live project tracking dashboard.
- Drop-down lists, lookups, and validations that keep data tidy.
- Notes for teams that still keep an export in project tracker excel.
How the dashboard reads at a glance
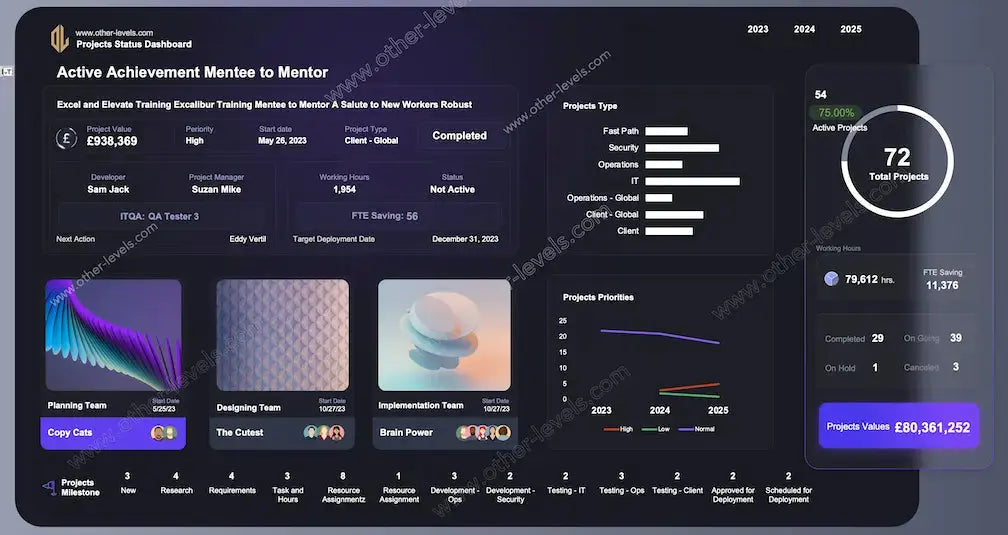
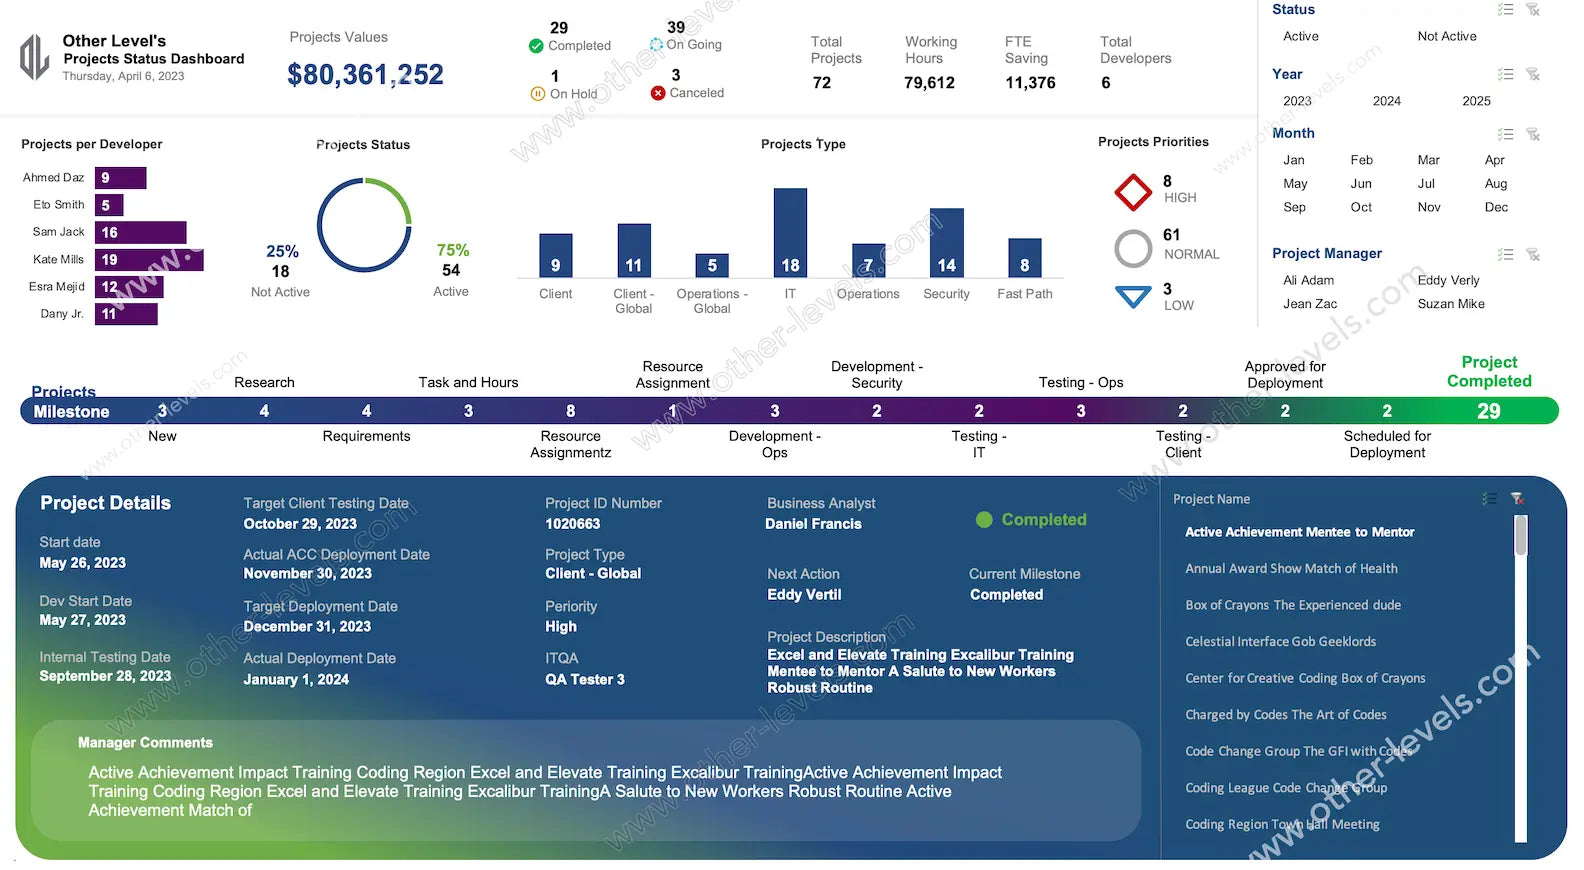
Top header with project status
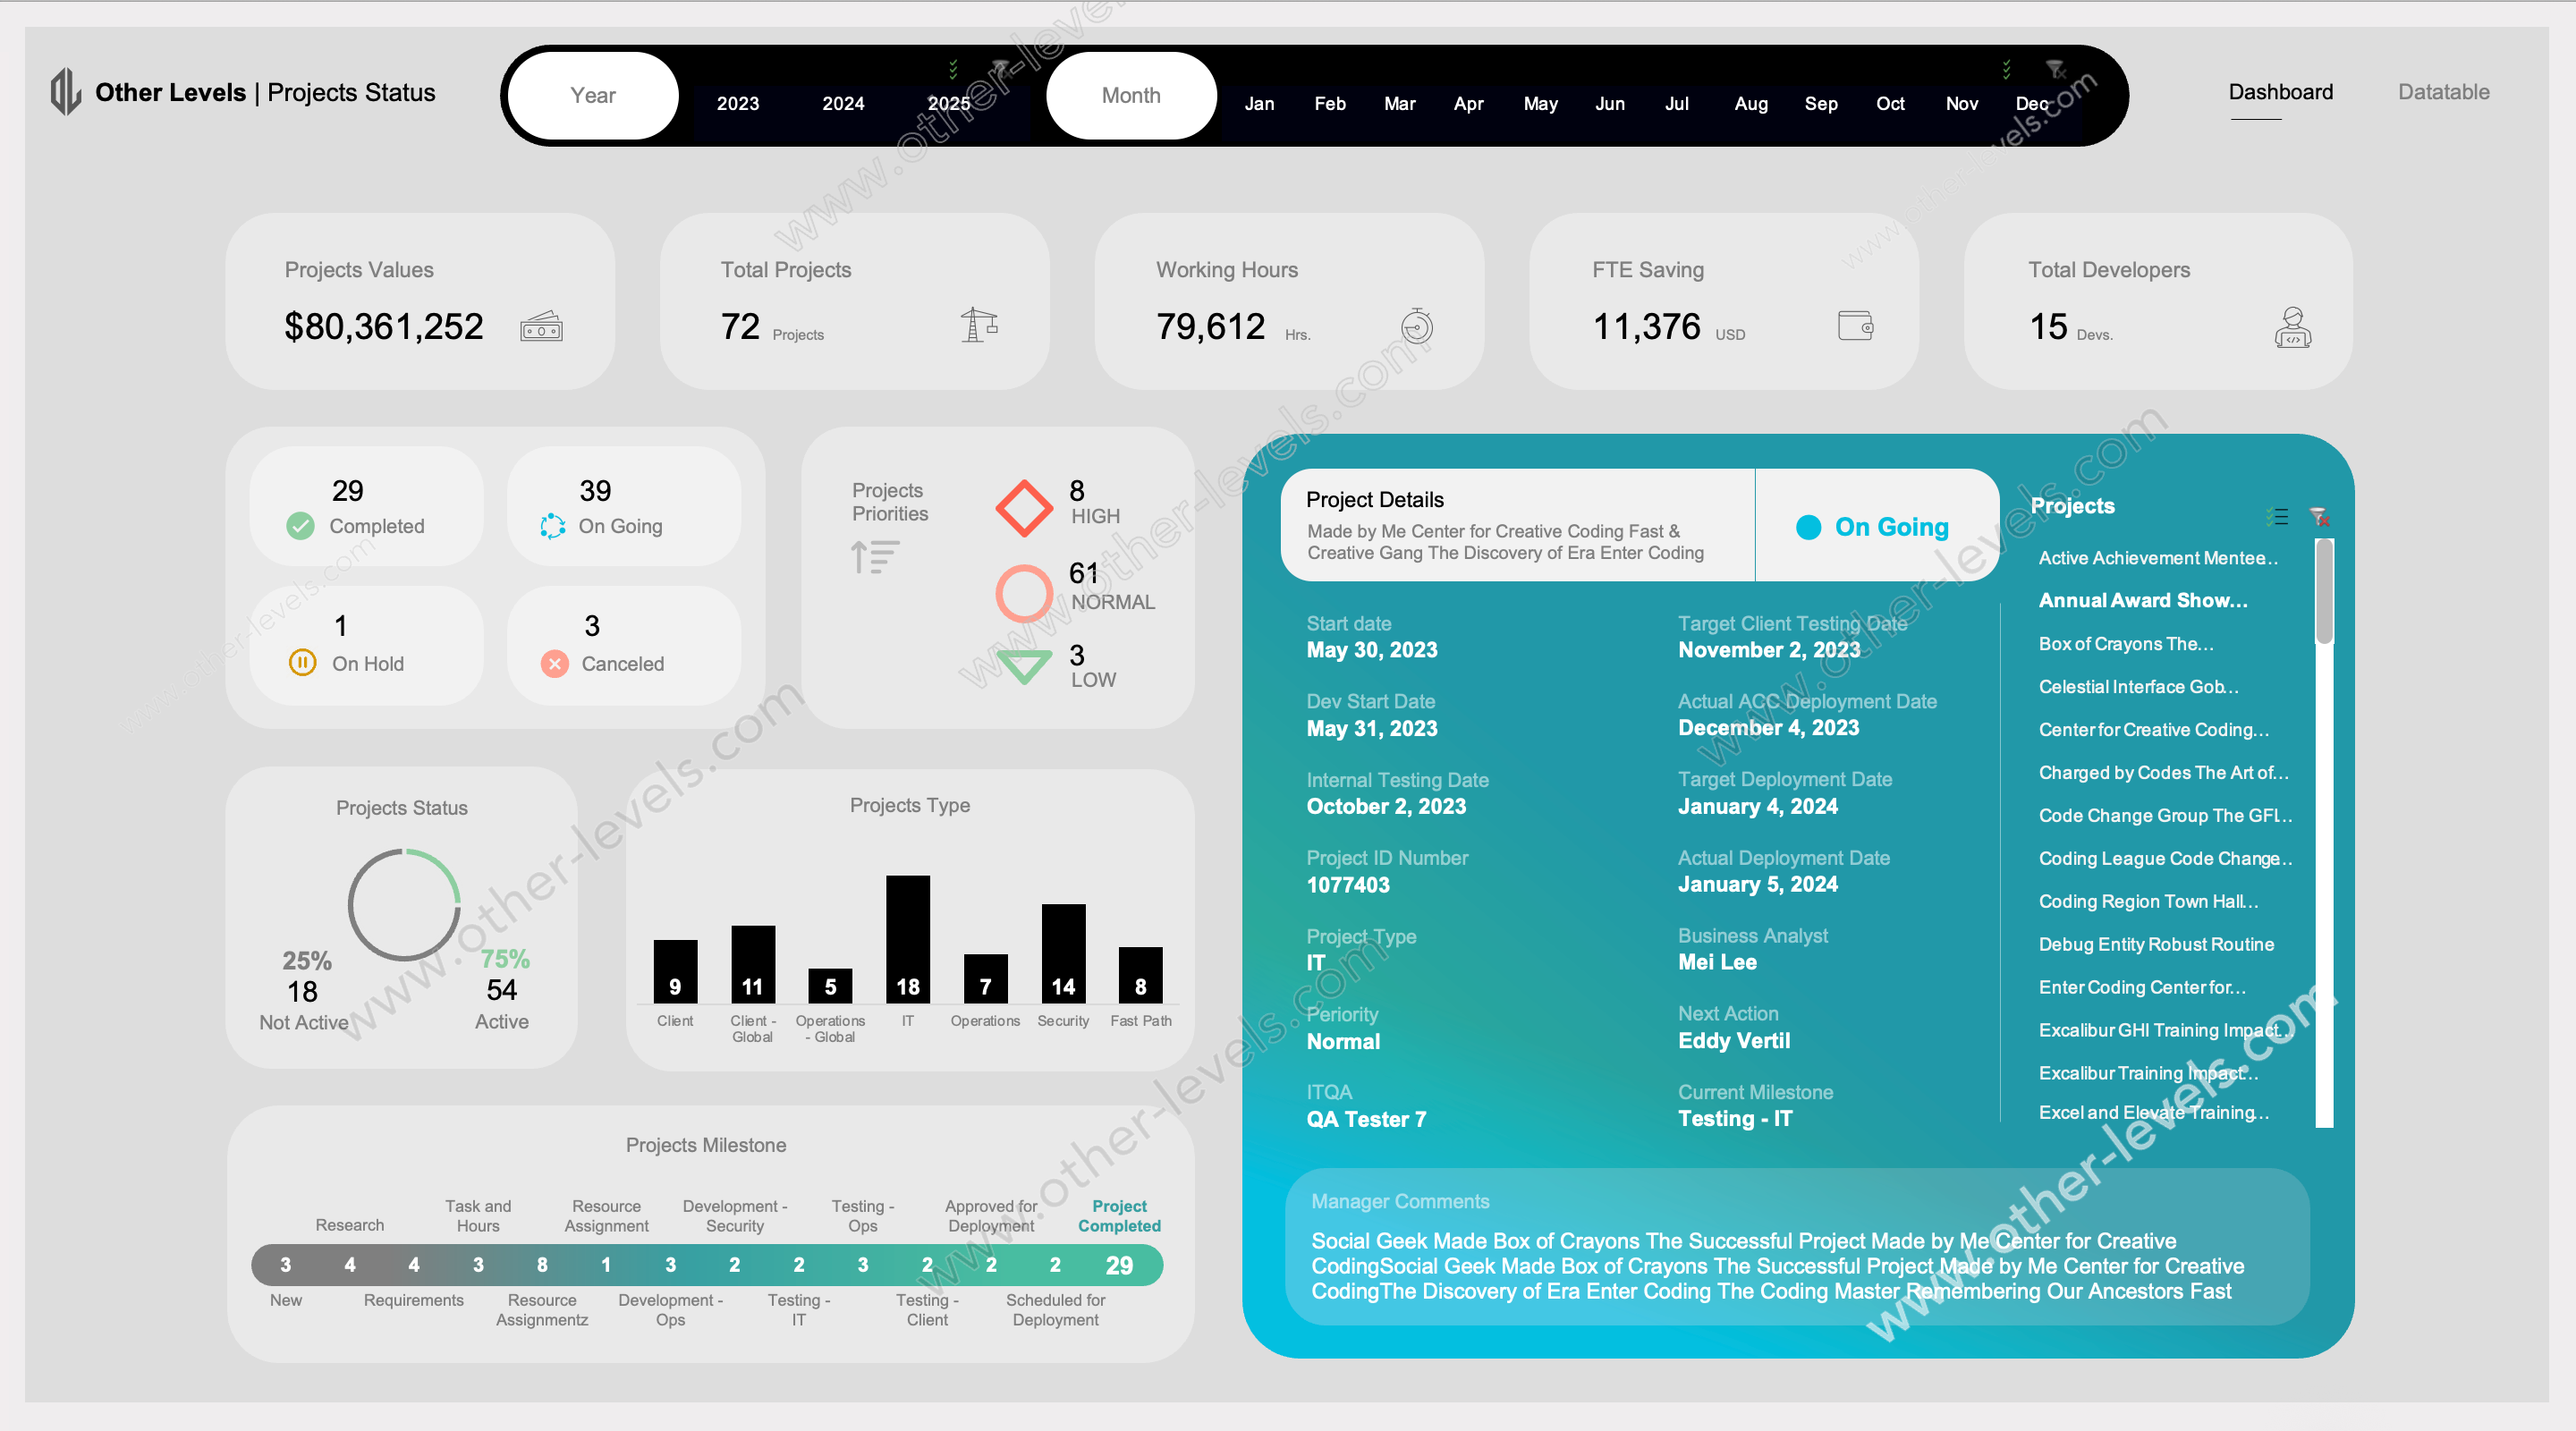
You’ll notice a compact header that shows the active project, owners, dates, and project status. “Next action” bubbles up on its own, so you don’t hunt through tasks.
Work mix and project priority
An excel bar chart compares project types side by side. In practice, it makes capacity trade-offs obvious. A small badge highlights project priority so you can decide what moves first.
Portfolio health ring
A donut tells the story fast. You’ll see completed projects and ongoing projects without reading a single table. It’s designed so you could recreate it as a doughnut chart excel if you ever need to.
Hours and efficiency
Time rolls up from tasks to help answer real questions—like working hours in a year for planning and forecasting. It keeps the math consistent across teams.
Yearly trend lines
Planning for next year? The trend view doubles as a project 2025 tracker and a simple project 2025 progress tracker. You’ll spot shifts in demand before they become fire drills.
Teams and ownership
Cards show who’s on what, when they started, and what’s next. Hand-offs get smoother because everyone sees the same context.
Milestone pipeline
The left-to-right stage bar keeps an eye on my milestone counts—intake, build, test, deploy. Bottlenecks stand out. Conversations get easier.
Filters & quick interactions
Two slicers do the heavy lifting. Pick a year and a segment, and everything updates—KPIs, charts, counts. Click a chart to drill into rows. It’s fast, and it feels natural.
Data tables under the hood
- Projects — one row per project with owners, dates, value, and links to goals.
- Tasks — stages, owners, planned vs. actual hours, and due dates that drive project progress.
- Time/Hours — optional daily entries for detailed tracking and audits.
- Lookups — lists and rules that tie everything to your organizational goals.
Why teams like it
- It’s familiar—pure Sheets, perfect for project tracking google workflows.
- It replaces slide decks with a link that updates itself.
- It scales from a single squad to a whole portfolio without getting heavy.
Getting started (no fluff)
- Paste your Projects and Tasks. Keep IDs consistent.
- Confirm stages so pipeline counts are accurate.
- Set standard hours (helps when someone asks “how many working hours in a year?”).
- Refresh pivots once; they’ll auto-grow after that.
If you’re comparing tools
Looking at the best project tracking software? This template gives you control, speed, and zero lock-in. Keep it simple now, layer in automation later.
Related templates to pair with this dashboard
For deeper portfolio views and presentations, you can combine this file with:
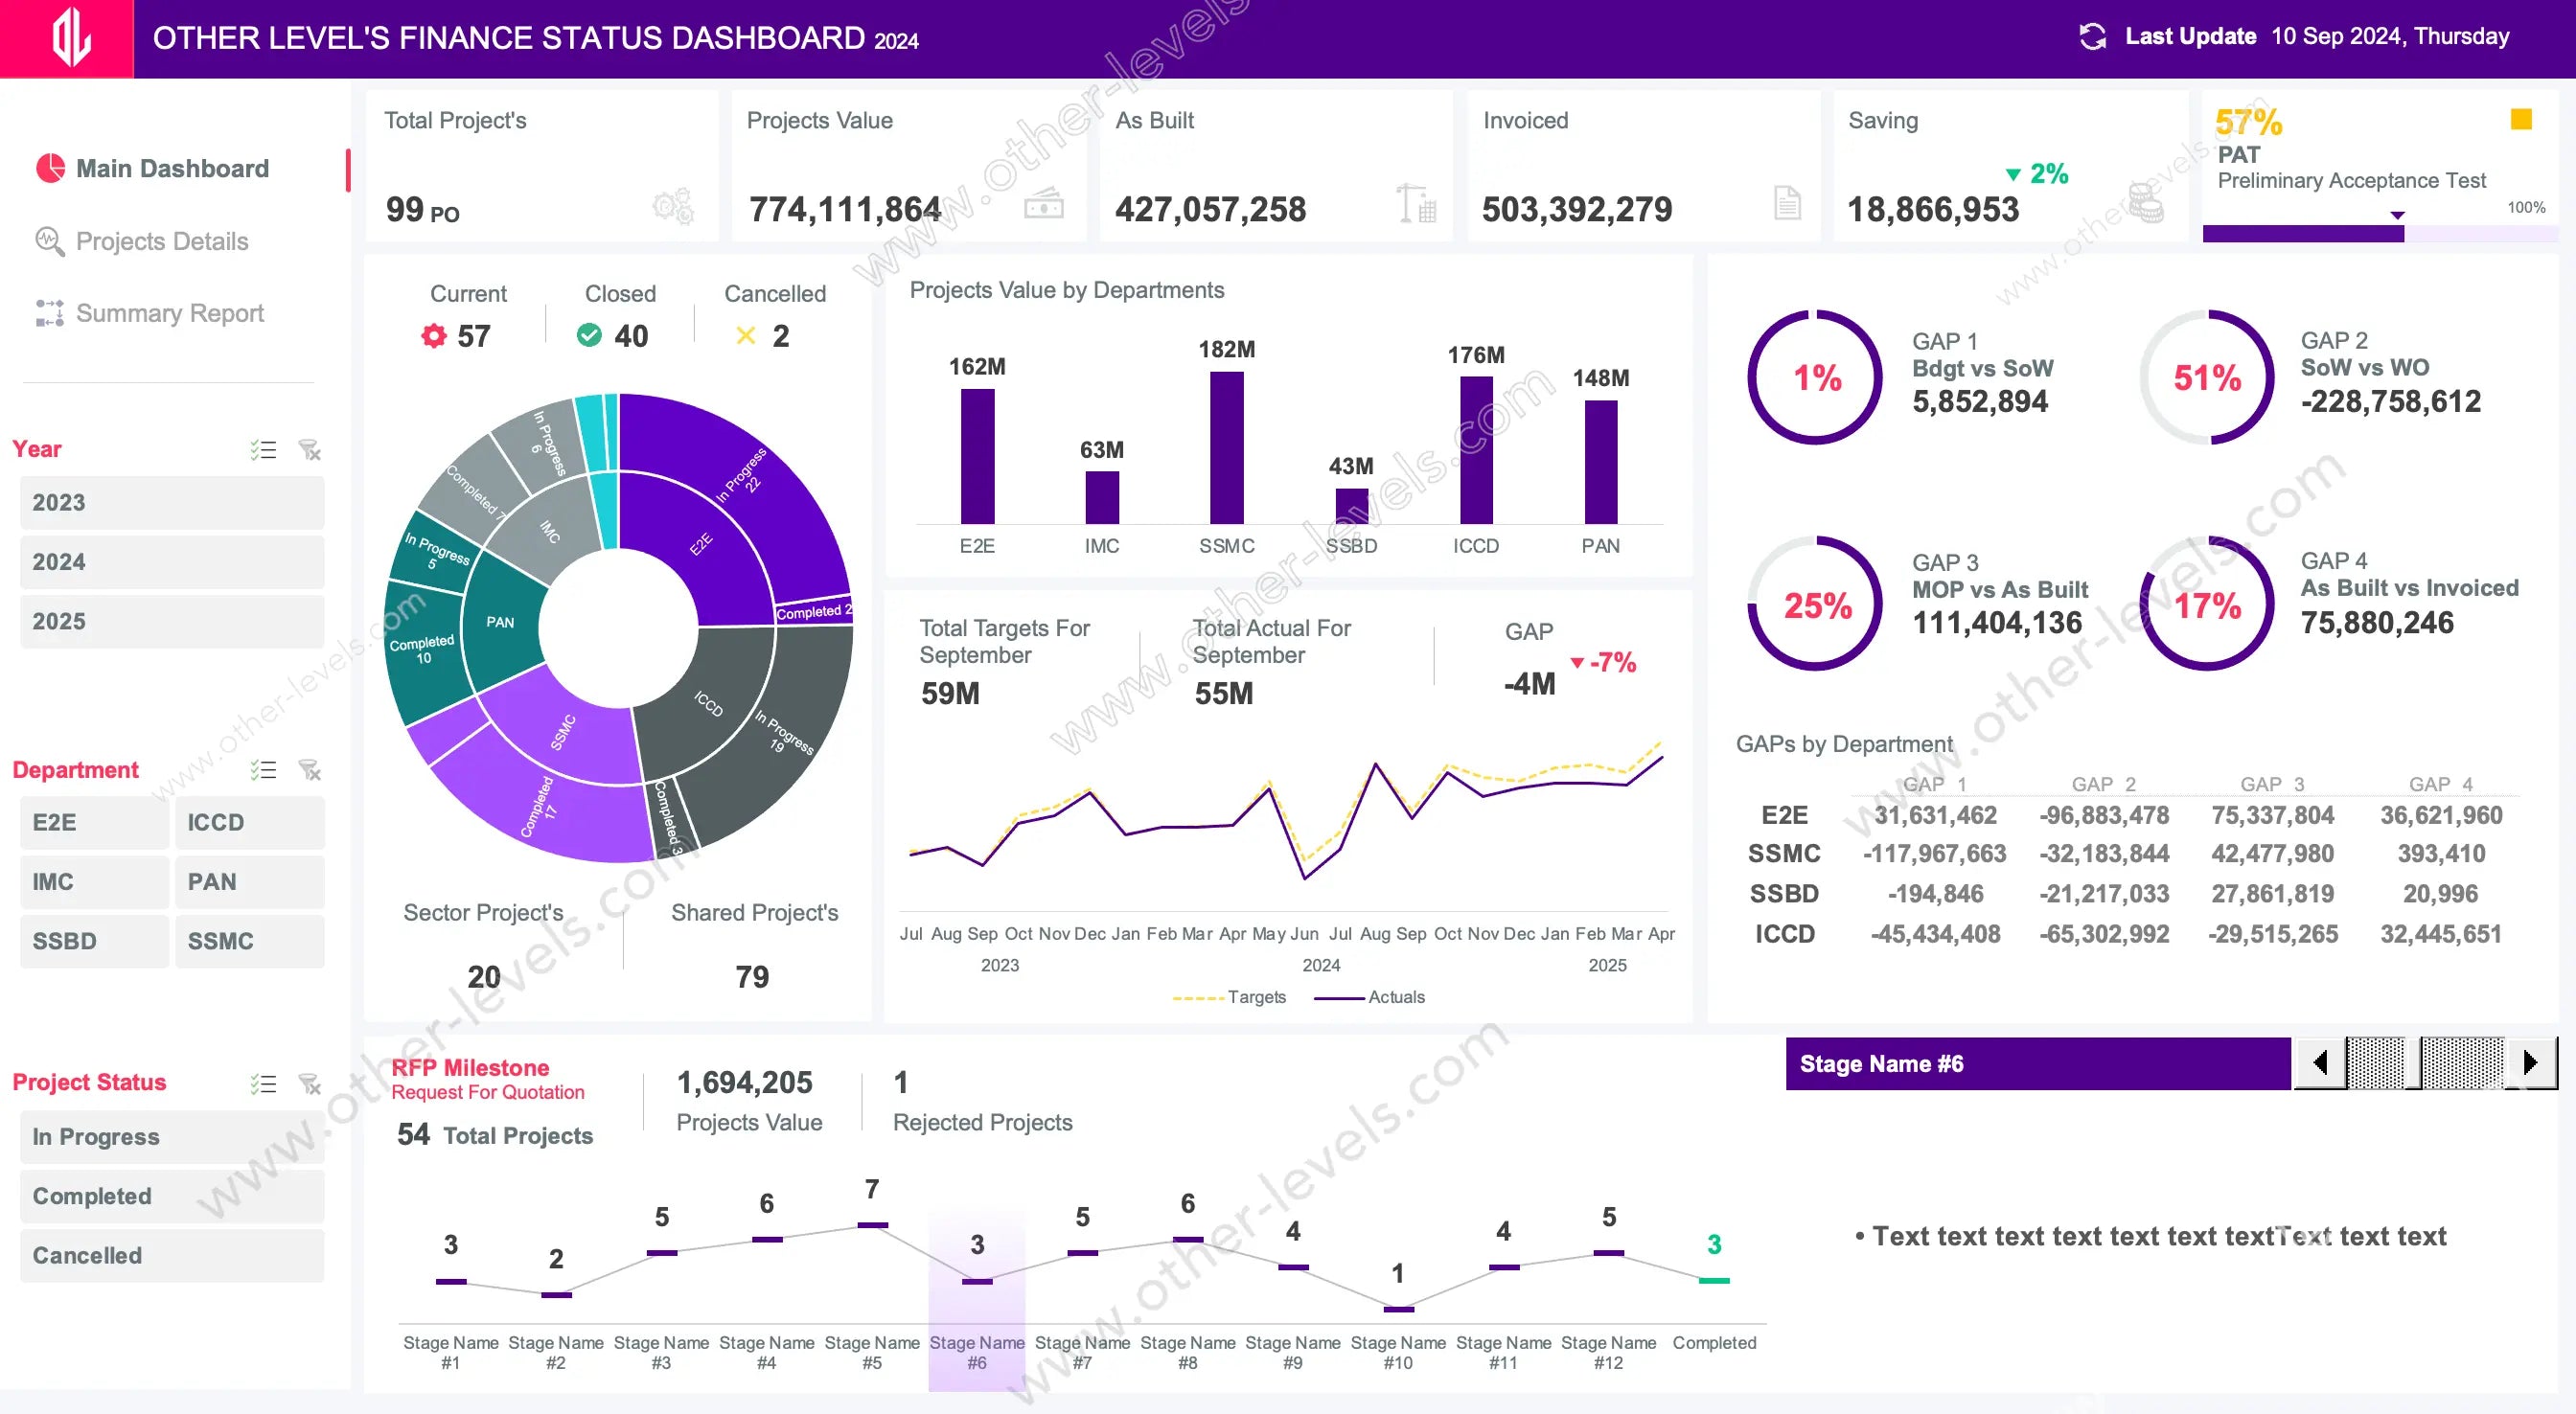
- Projects Status & Details Dashboard - Comprehensive Excel Dashboard — use it alongside this Google Sheets build when you want a richer Excel view of portfolio health and a detailed project status breakdown.
- Animated Workflow, Timeline, and Milestones PowerPoint Template — great for stakeholder updates; drop in charts from your project tracking dashboard and narrate the change over time.
Video tutorial
Watch the full Project Tracker Google Sheets Dashboard tutorial on our Other Levels YouTube Channel
A quick story from day one
Monday morning, you open the file. You check the header, skim the donut, and glance at the trend line. One click on a stage count and you’re in the exact tasks that need attention. By stand-up, everyone’s aligned—no copy-paste, no guessing.
Specifications
Get all essential details in one place. From features and package contents to software compatibility and skill level required, this section gives you a clear overview so you know exactly what to expect before download.
Template Features
Package Details
Software Compatibility
Skill Level Required
Intermediate
FAQs
Please read our FAQs page to find out more.
Are the templates fully customizable?
Yes, all our templates are fully customizable. You can adjust the layout, data, and design elements to fit your specific needs. Our templates are designed to be flexible, allowing you to easily tailor them to your preferences.
Can I order a product in any language?
Yes, we provide products in any language. Simply select the "Other Language" option from the product options during your purchase. Once your order is placed, you will receive it within 48 hours.
What happens if I choose the wrong monitor screen size for my dashboard?
If you choose the wrong screen size, the dashboard may not display correctly on your monitor. Elements could appear too large, too small, or misaligned, affecting the readability and usability of the dashboard. We recommend selecting the appropriate screen size to ensure optimal viewing and performance.
Do I need specific skills to use the advanced Excel dashboard templates?
Our advanced Excel dashboards are easy to use, the only thing you need to know is how to work with PivotTables. With basic knowledge of PivotTables, you'll be able to customize and fully utilize these templates effortlessly. "Please check the skill level required"