✅ Instant Digital Delivery | 🔒 Secure Checkout | ⭐ Trusted by 1,000+ Professionals | 💬 24hr Support
Real Property Management Excel Dashboard – Rental Performance
Pairs well with
Overview of the Real Property Management Dashboard
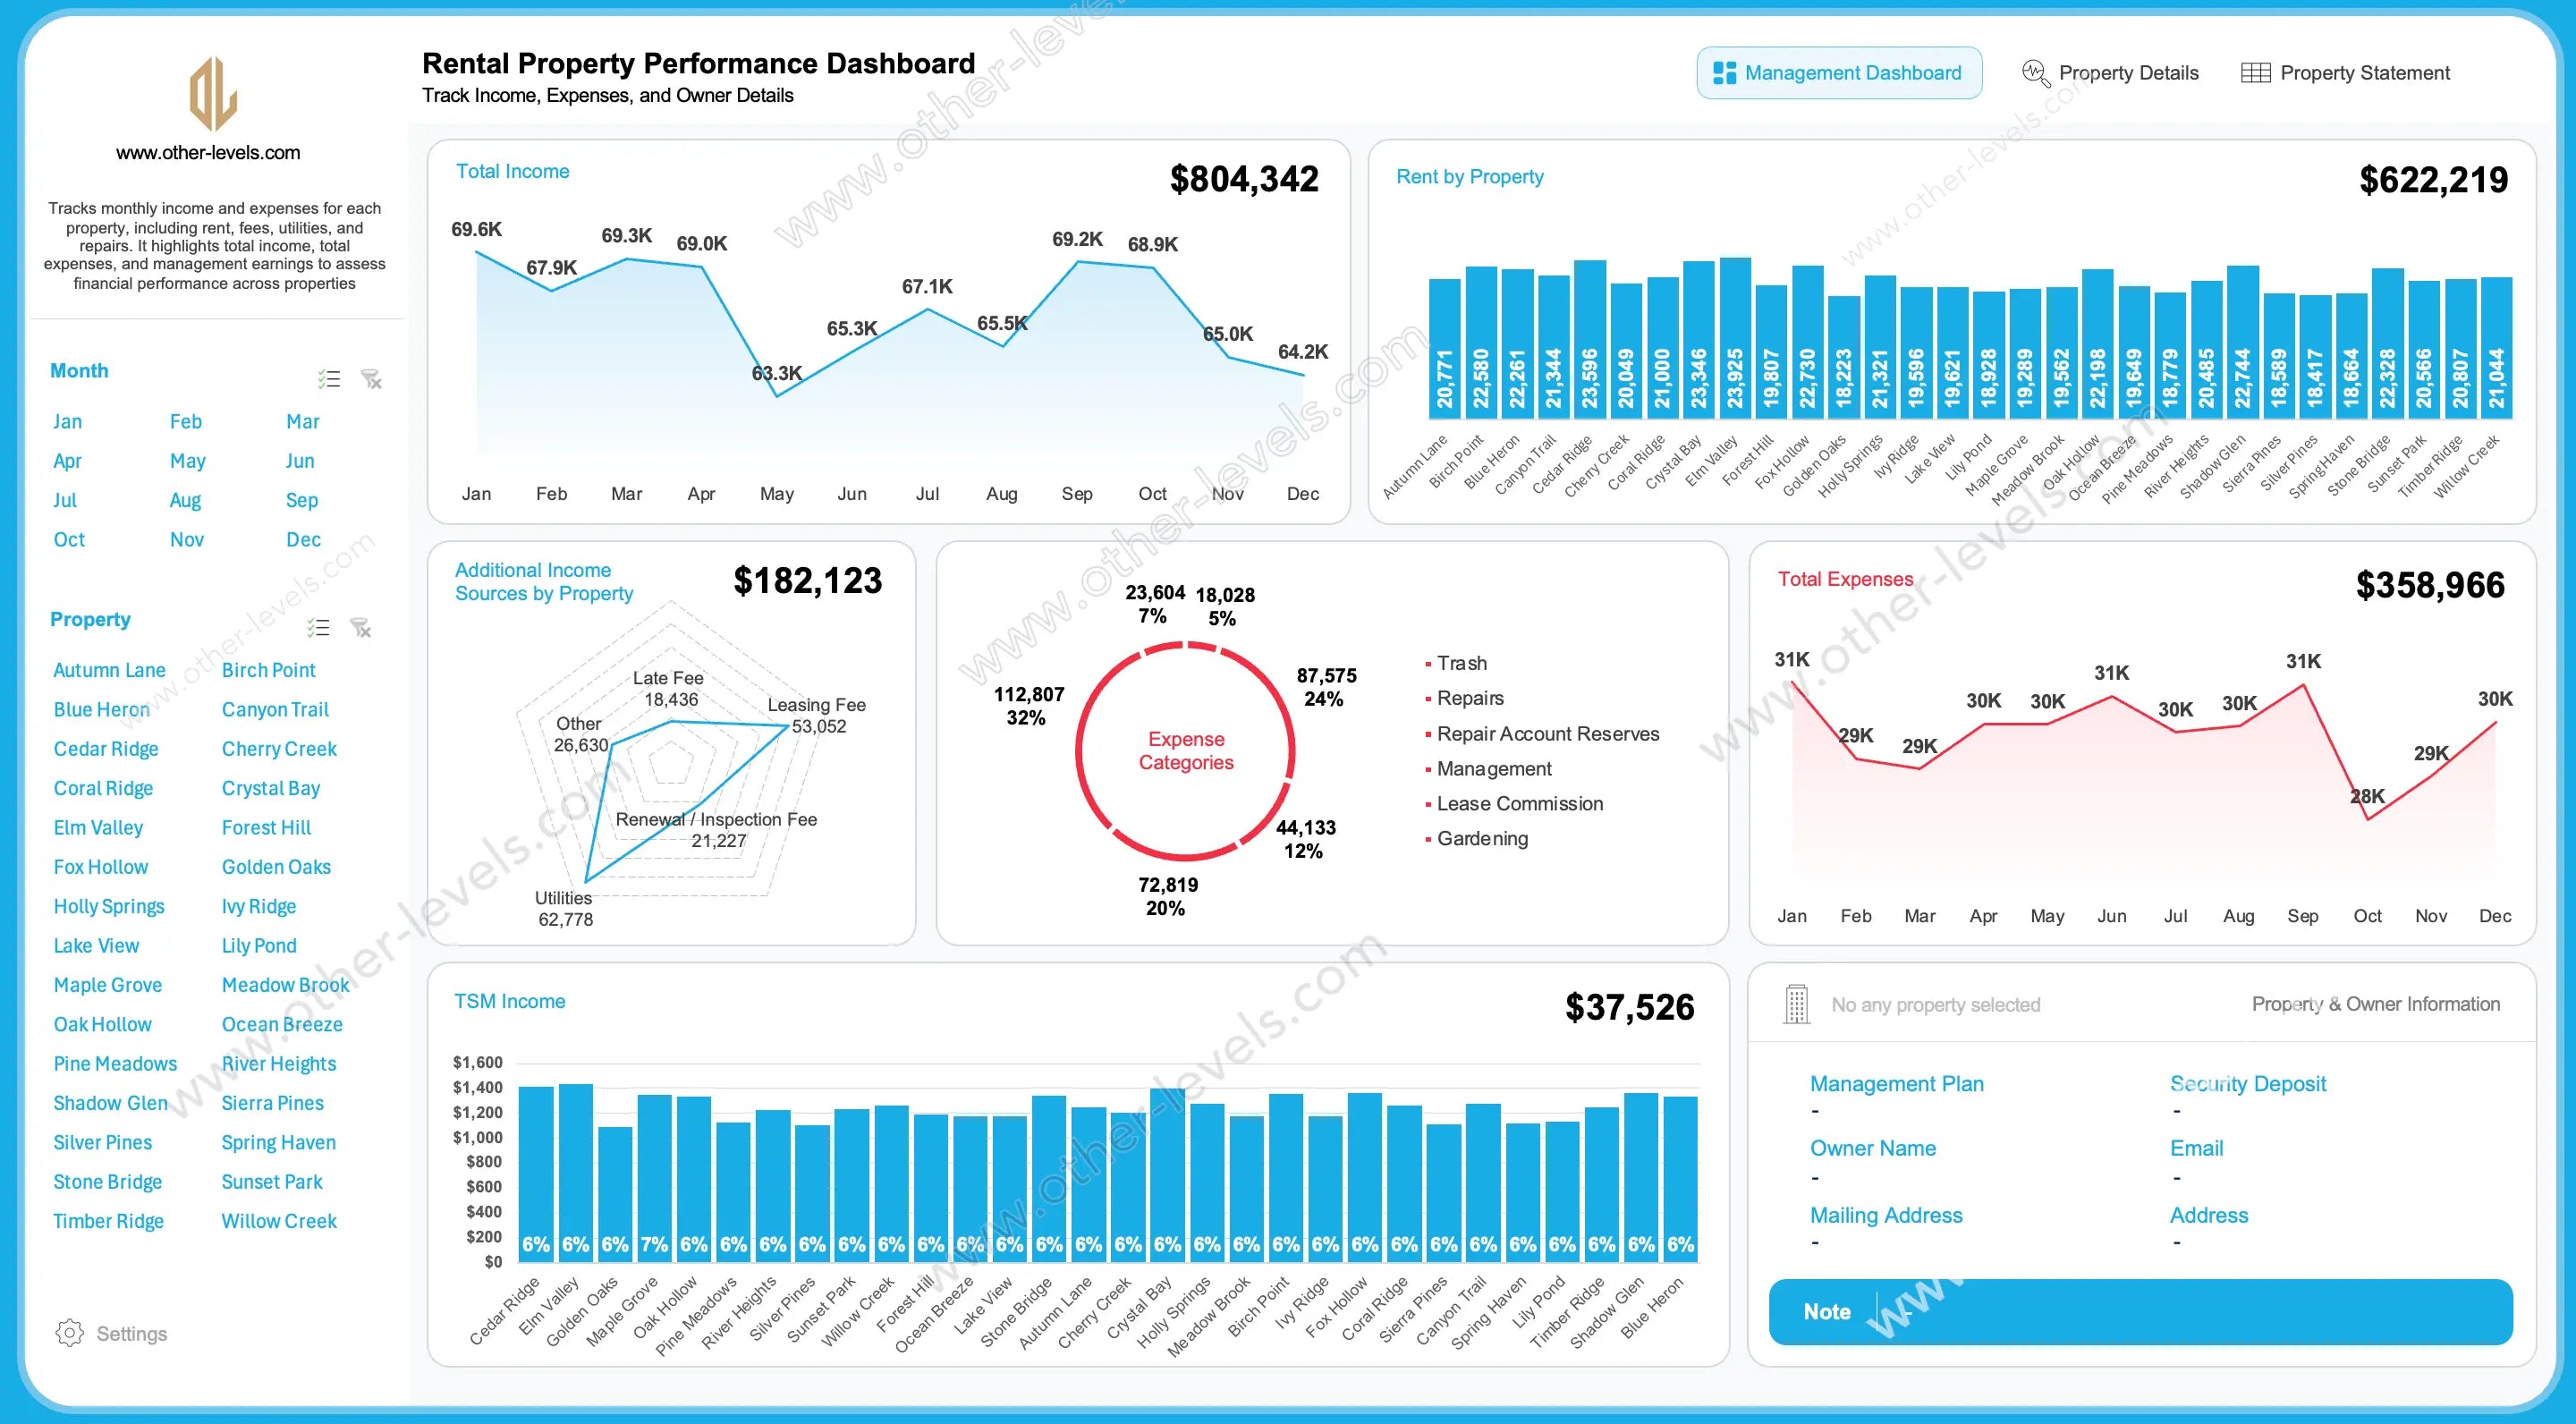
The Rental Property Performance Dashboard is an advanced Excel template built to track financial performance across multiple rental units. It provides property managers, investors, and owners with a clear view of total income, expenses, and property owner information. This spreadsheet helps simplify reporting and supports decision-making for real property management and premier property management teams. It also organizes spending categories into clear visuals for easy analysis.
Main Features of the Dashboard
Total Income Analysis Over Time
A monthly line chart tracks rental income trends, showing how properties perform throughout the year. It enables property owners and managers to assess portfolio financial performance and apply earned value management principles to spot patterns, project growth, or identify slow seasons.
Total Expenses with Spending Categories
Expenses are analyzed month by month using a trend line and grouped by business expense categories. This section provides insights into repair costs, utilities, management fees, and other spending categories. It gives managers a clear view of how much each expense report contributes to overall outflow. The design uses a built-in pie chart maker to visualize cost distribution.
Rent by Property Comparison
A bar chart compares rent collected per property, allowing quick benchmarking of top and low performers. This helps with the management of investment portfolios, ensuring stronger assets are identified and weaker ones can be improved.
Additional Income Sources
Non-rental income streams such as late fees, utilities, leasing fees, and inspection charges are captured. This diversification shows how much extra income comes from each property beyond rent, making the excel format for expense reports and income tracking more complete.
Expense Categories Distribution
A donut chart groups expenses into categories like trash, repairs, reserves, gardening, and commissions. This view helps owners understand their largest business expense categories and find ways to optimize costs across the portfolio.
Company Income (Management Earnings)
Displays management service fees earned from each property, supporting transparent reporting for real property management and premier property management operations.
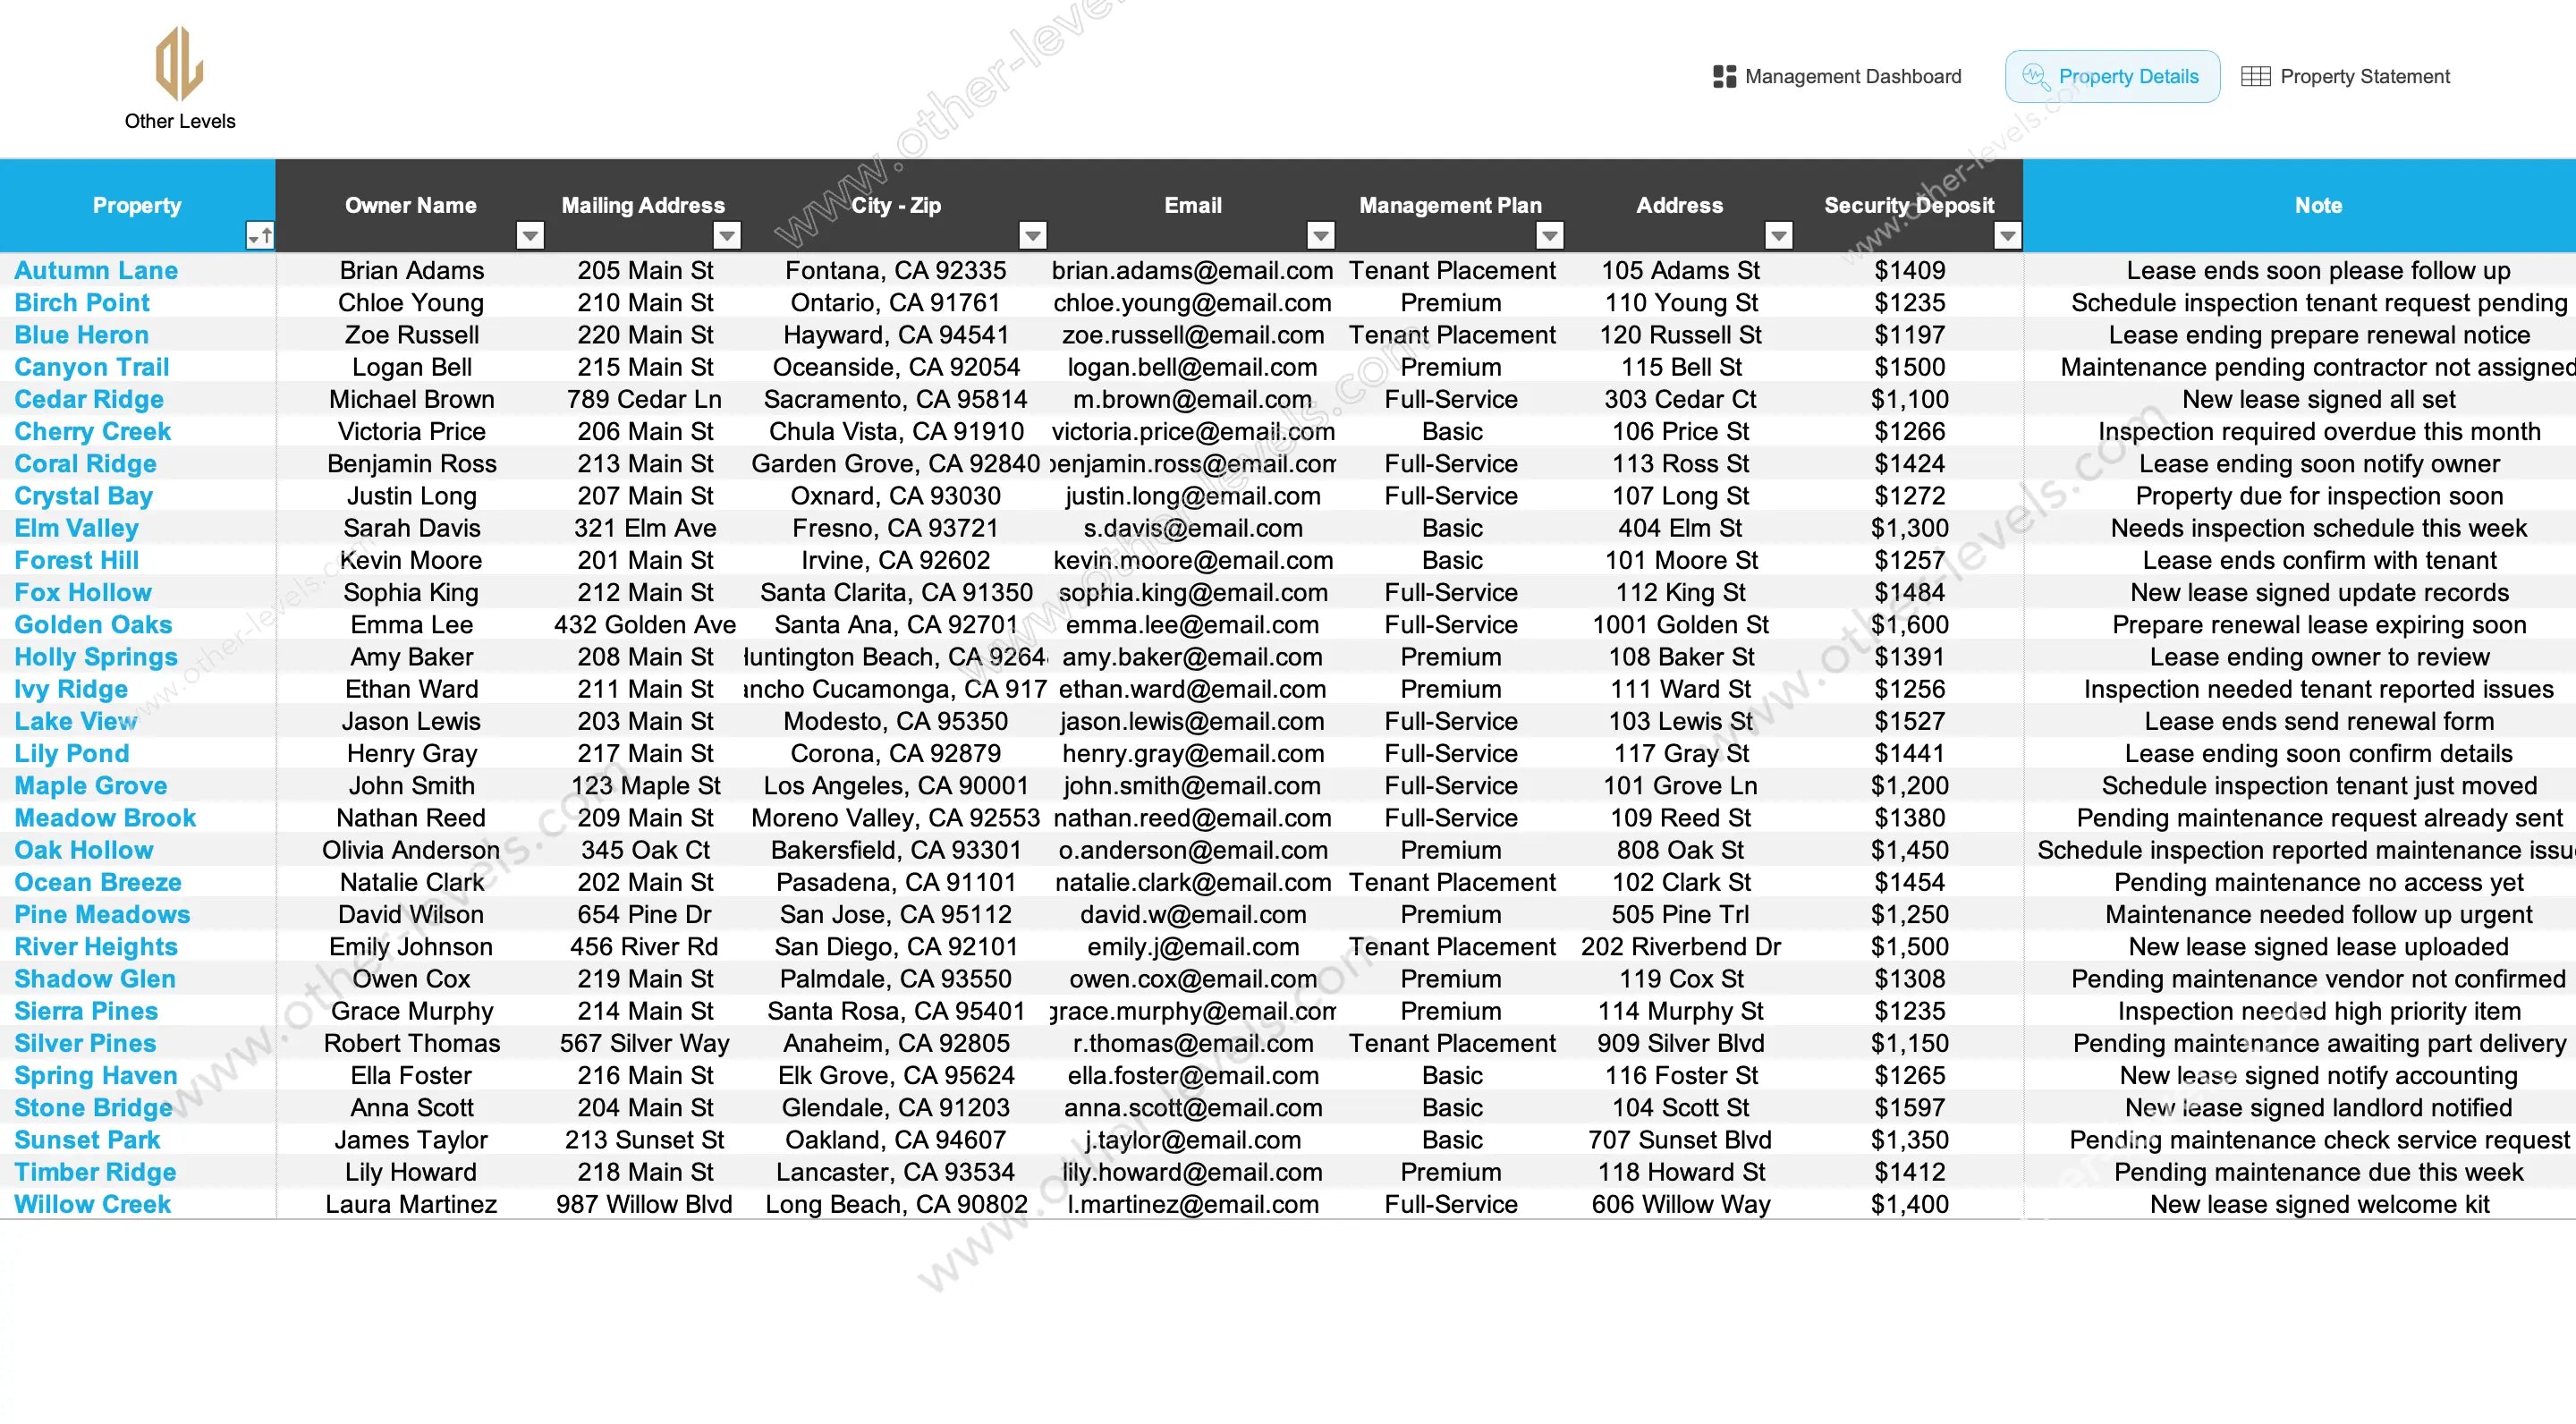
Property Owner Information
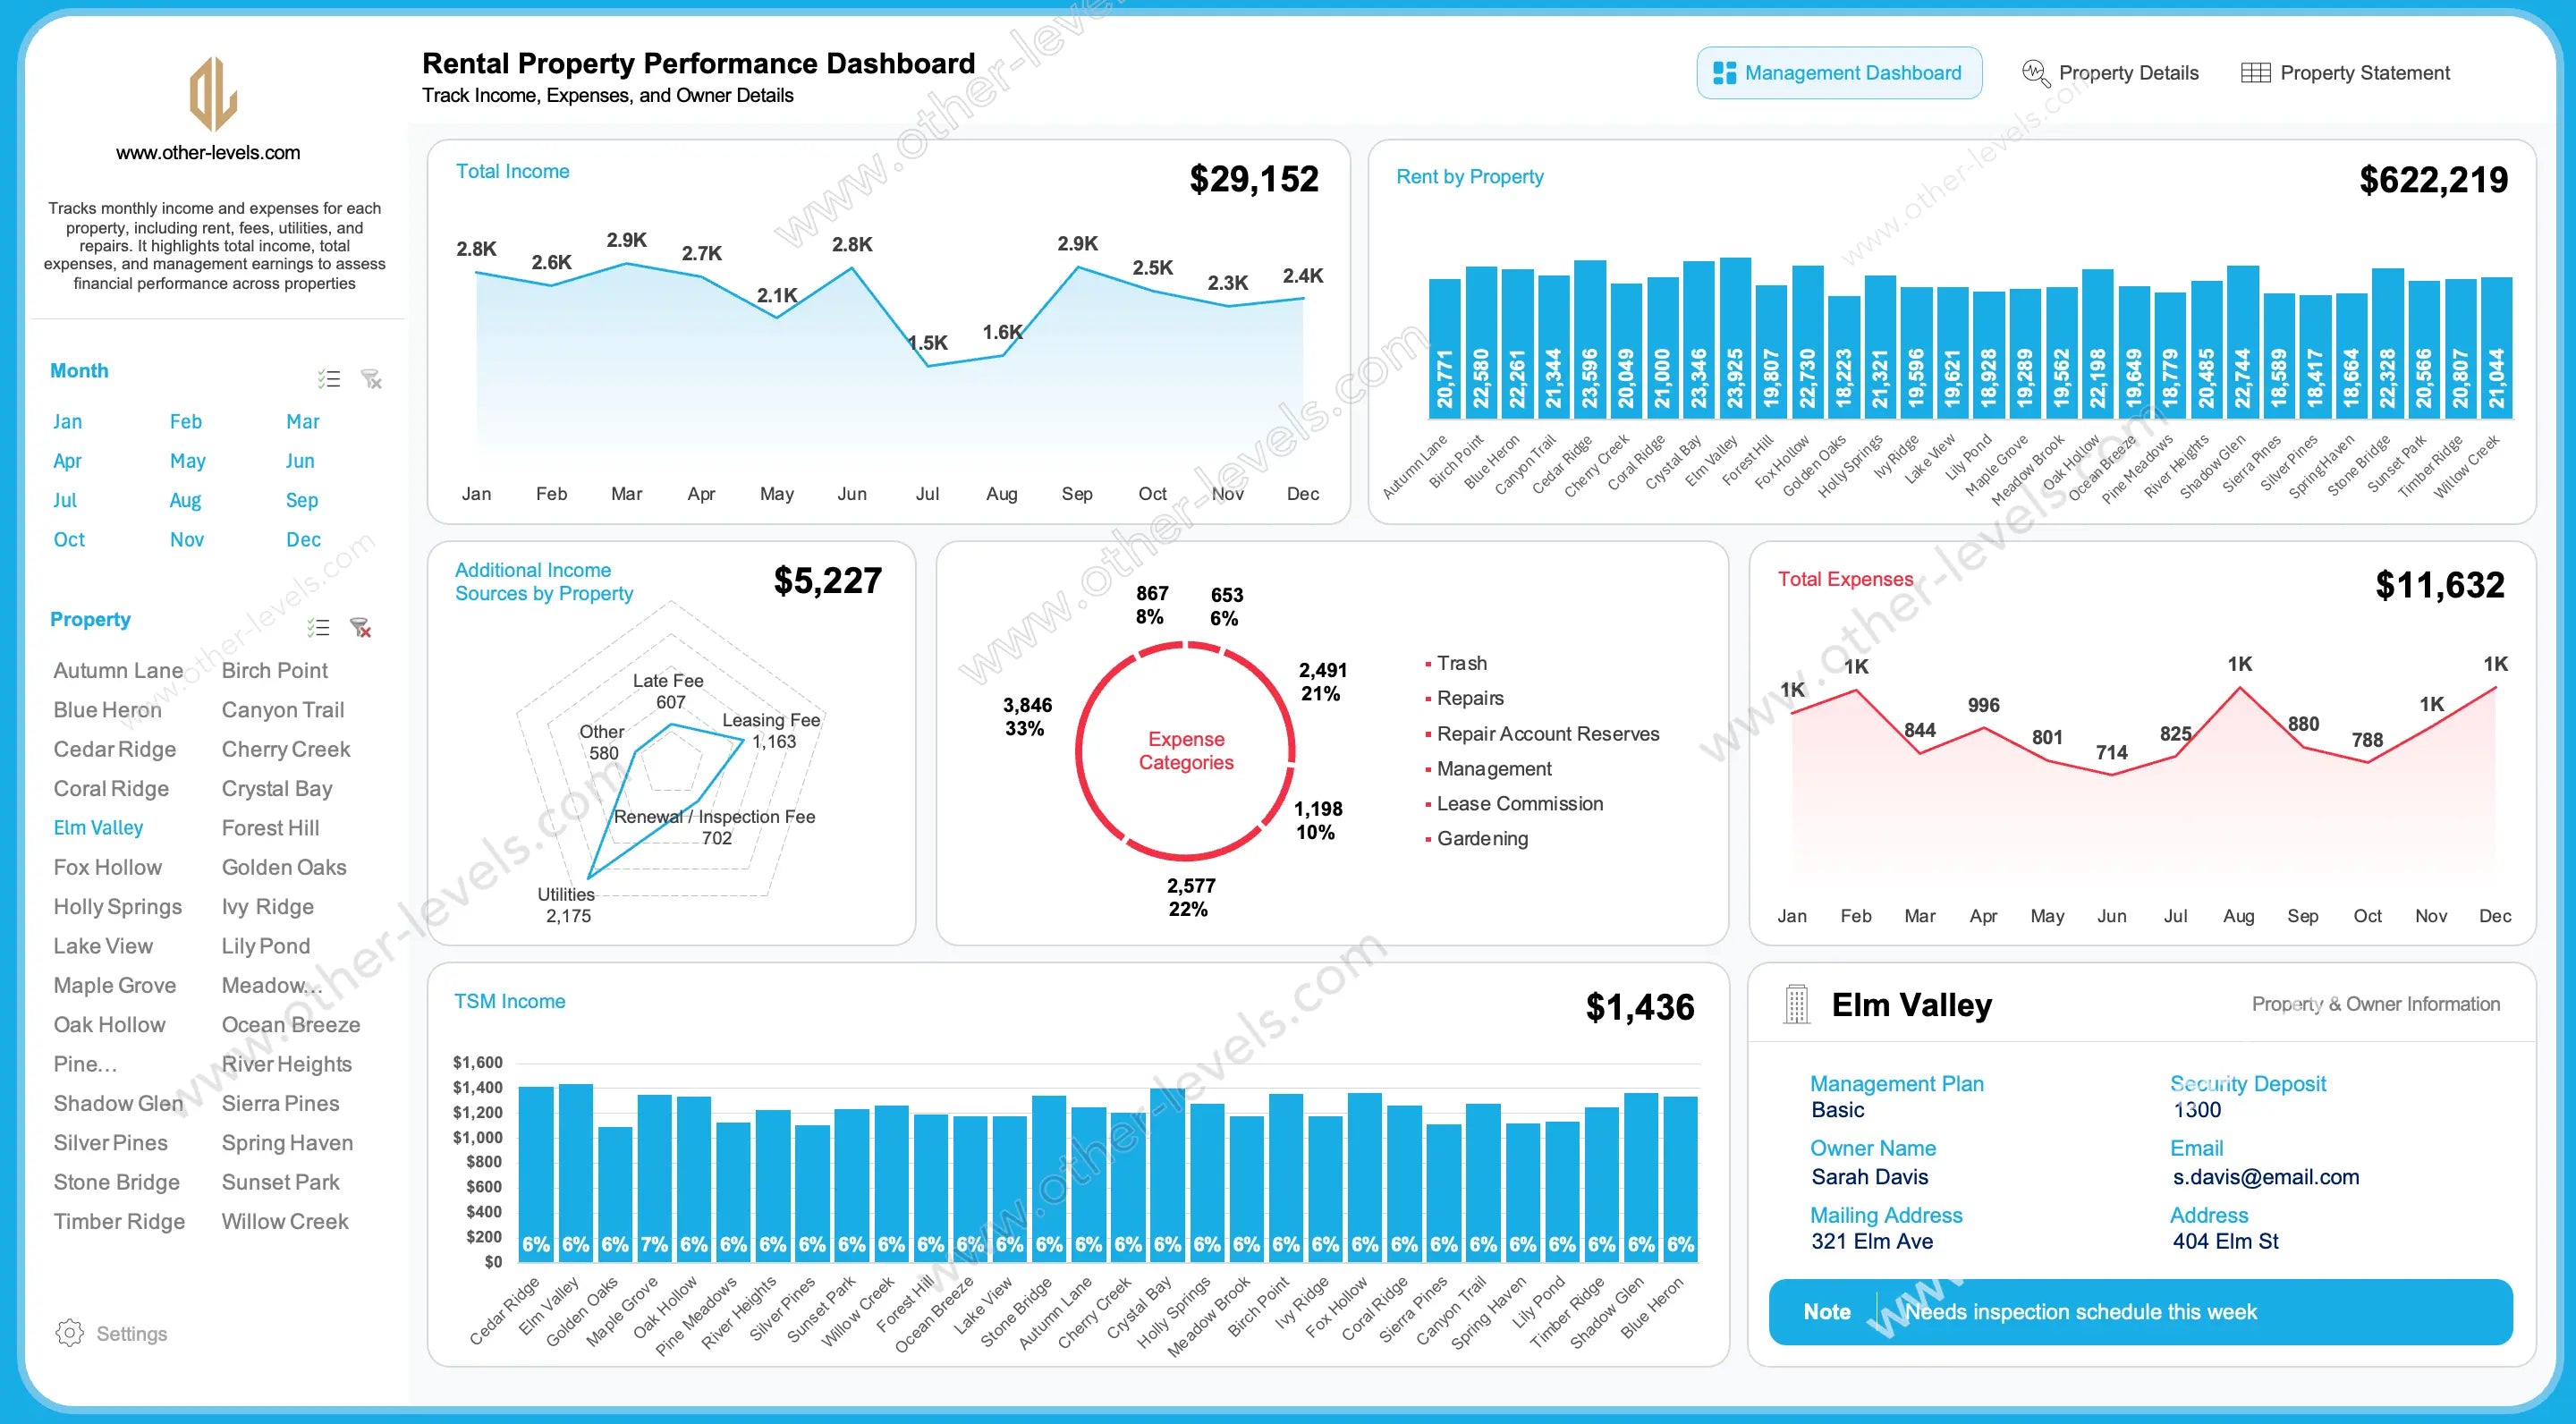
Property Owner Search and Details
Each property includes details such as management plan, security deposit, mailing address,rent to own dashboard, and tenant placement. It supports quick property owner search and makes it easy to find property owner by address.
Owner of Property Contact Information
The dashboard displays property owner information such as owner name, email, and physical address, helping managers easily identify the owner of property for any rental unit. This functionality makes portfolio-wide communication straightforward.
Navigation and Interactivity
Management Dashboard View
A portfolio-level view summarizing total income, expenses, and additional income sources across all units.
Property Details View
Provides a deep dive into specific property performance, including tenant, owner, and property owners association Texas considerations where relevant.
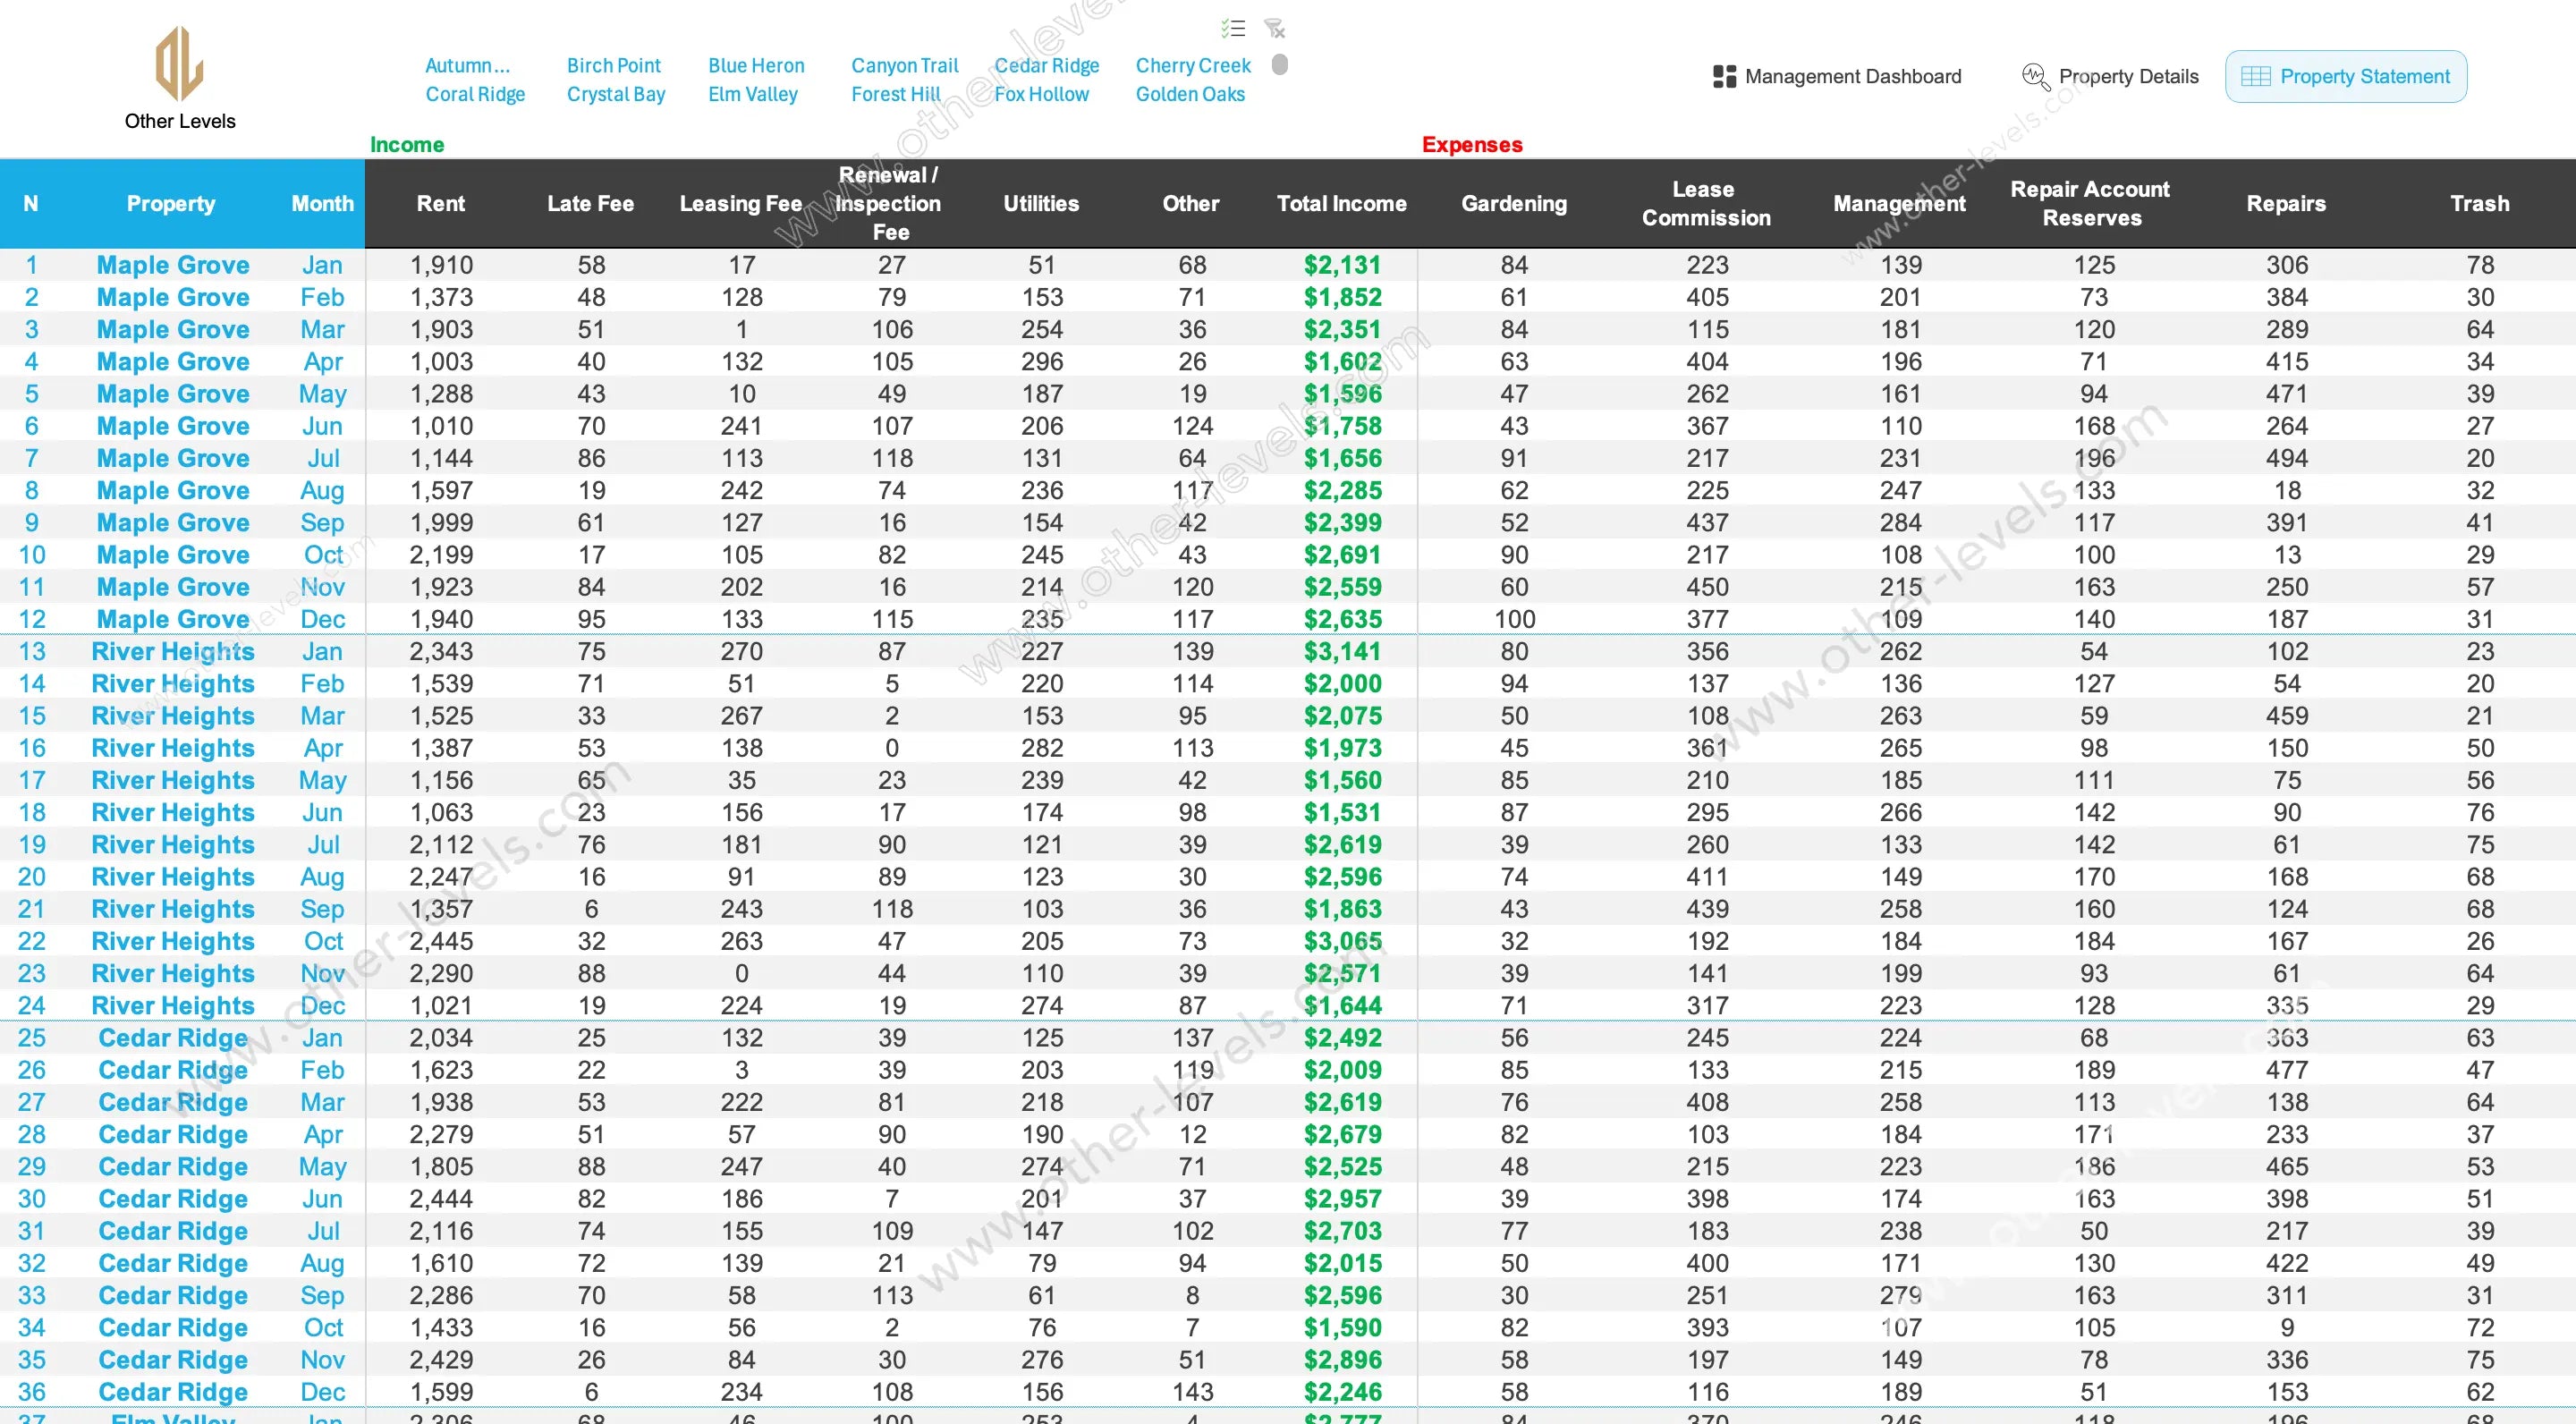
Property Statement View
Summarized financial statements show a complete picture of each unit, making it useful for audits, reviews, and when sharing with stakeholders.
Additional Notes
Low Income Apartments for Rent
The dashboard dataset supports portfolio tracking across different property types, including premium units and low income apartments for rent.
Will Template and Estate Planning
Although this Excel spreadsheet is focused on rental analysis, the dataset and structure can also complement planning tools such as a will template or property succession planning.
Specifications
Get all essential details in one place. From features and package contents to software compatibility and skill level required, this section gives you a clear overview so you know exactly what to expect before download.
Template Features
Package Details
Software Compatibility
Skill Level Required
Intermediate
FAQs
Please read our FAQs page to find out more.
Are the templates fully customizable?
Yes, all our templates are fully customizable. You can adjust the layout, data, and design elements to fit your specific needs. Our templates are designed to be flexible, allowing you to easily tailor them to your preferences.
Can I order a product in any language?
Yes, we provide products in any language. Simply select the "Dashboard language change" Service and once your order is placed, you will receive it within 48 hours.
What happens if I choose the wrong monitor screen size for my dashboard?
If you choose the wrong screen size, the dashboard may not display correctly on your monitor. Elements could appear too large, too small, or misaligned, affecting the readability and usability of the dashboard. We recommend selecting the appropriate screen size to ensure optimal viewing and performance.
Do I need specific skills to use the advanced Excel dashboard templates?
Our advanced Excel dashboards are easy to use, the only thing you need to know is how to work with PivotTables. With basic knowledge of PivotTables, you'll be able to customize and fully utilize these templates effortlessly. "Please check the skill level required"
All dashboards are 100% editable Excel files. Learn how to use them through our video tutorials, included datasets, and lifetime access program.