✅ Instant Digital Delivery | 🔒 Secure Checkout | ⭐ Trusted by 1,000+ Professionals | 💬 24hr Support
Project Management Dashboard Excel - Capital Expenditures
Pairs well with
Project Management Dashboard Excel - Capital Expenditures, Financial, Safety, Equipment & Labor
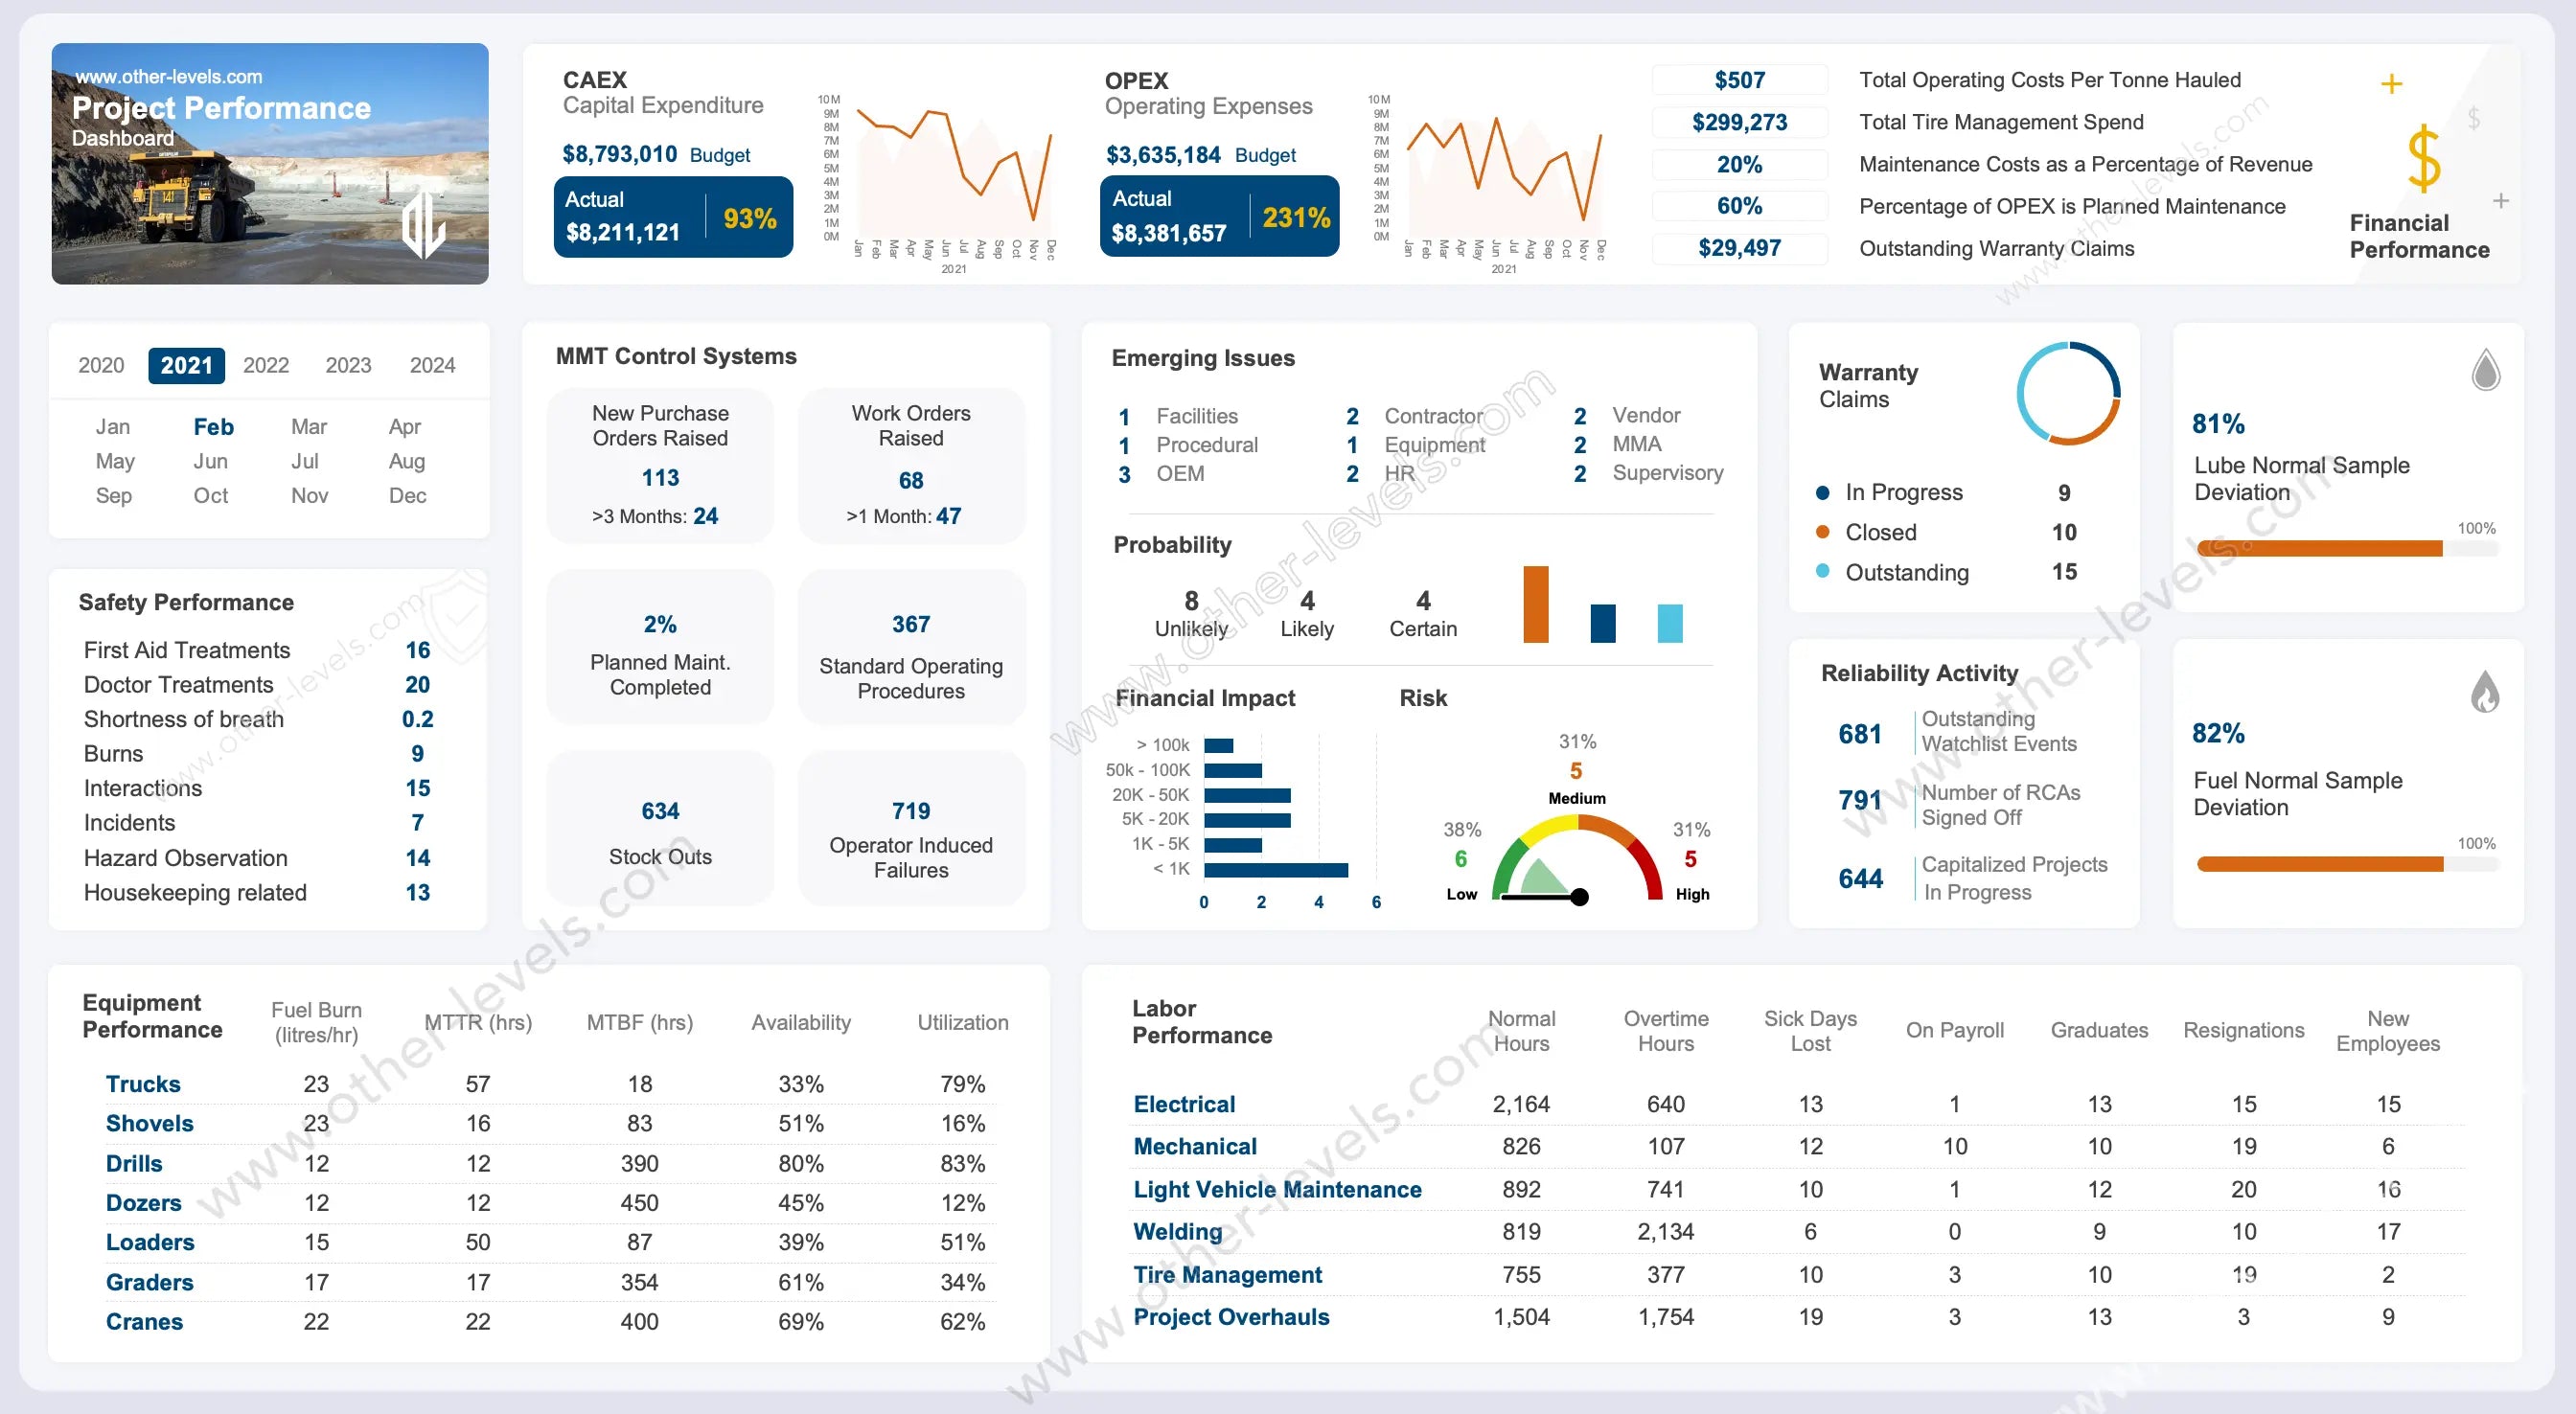
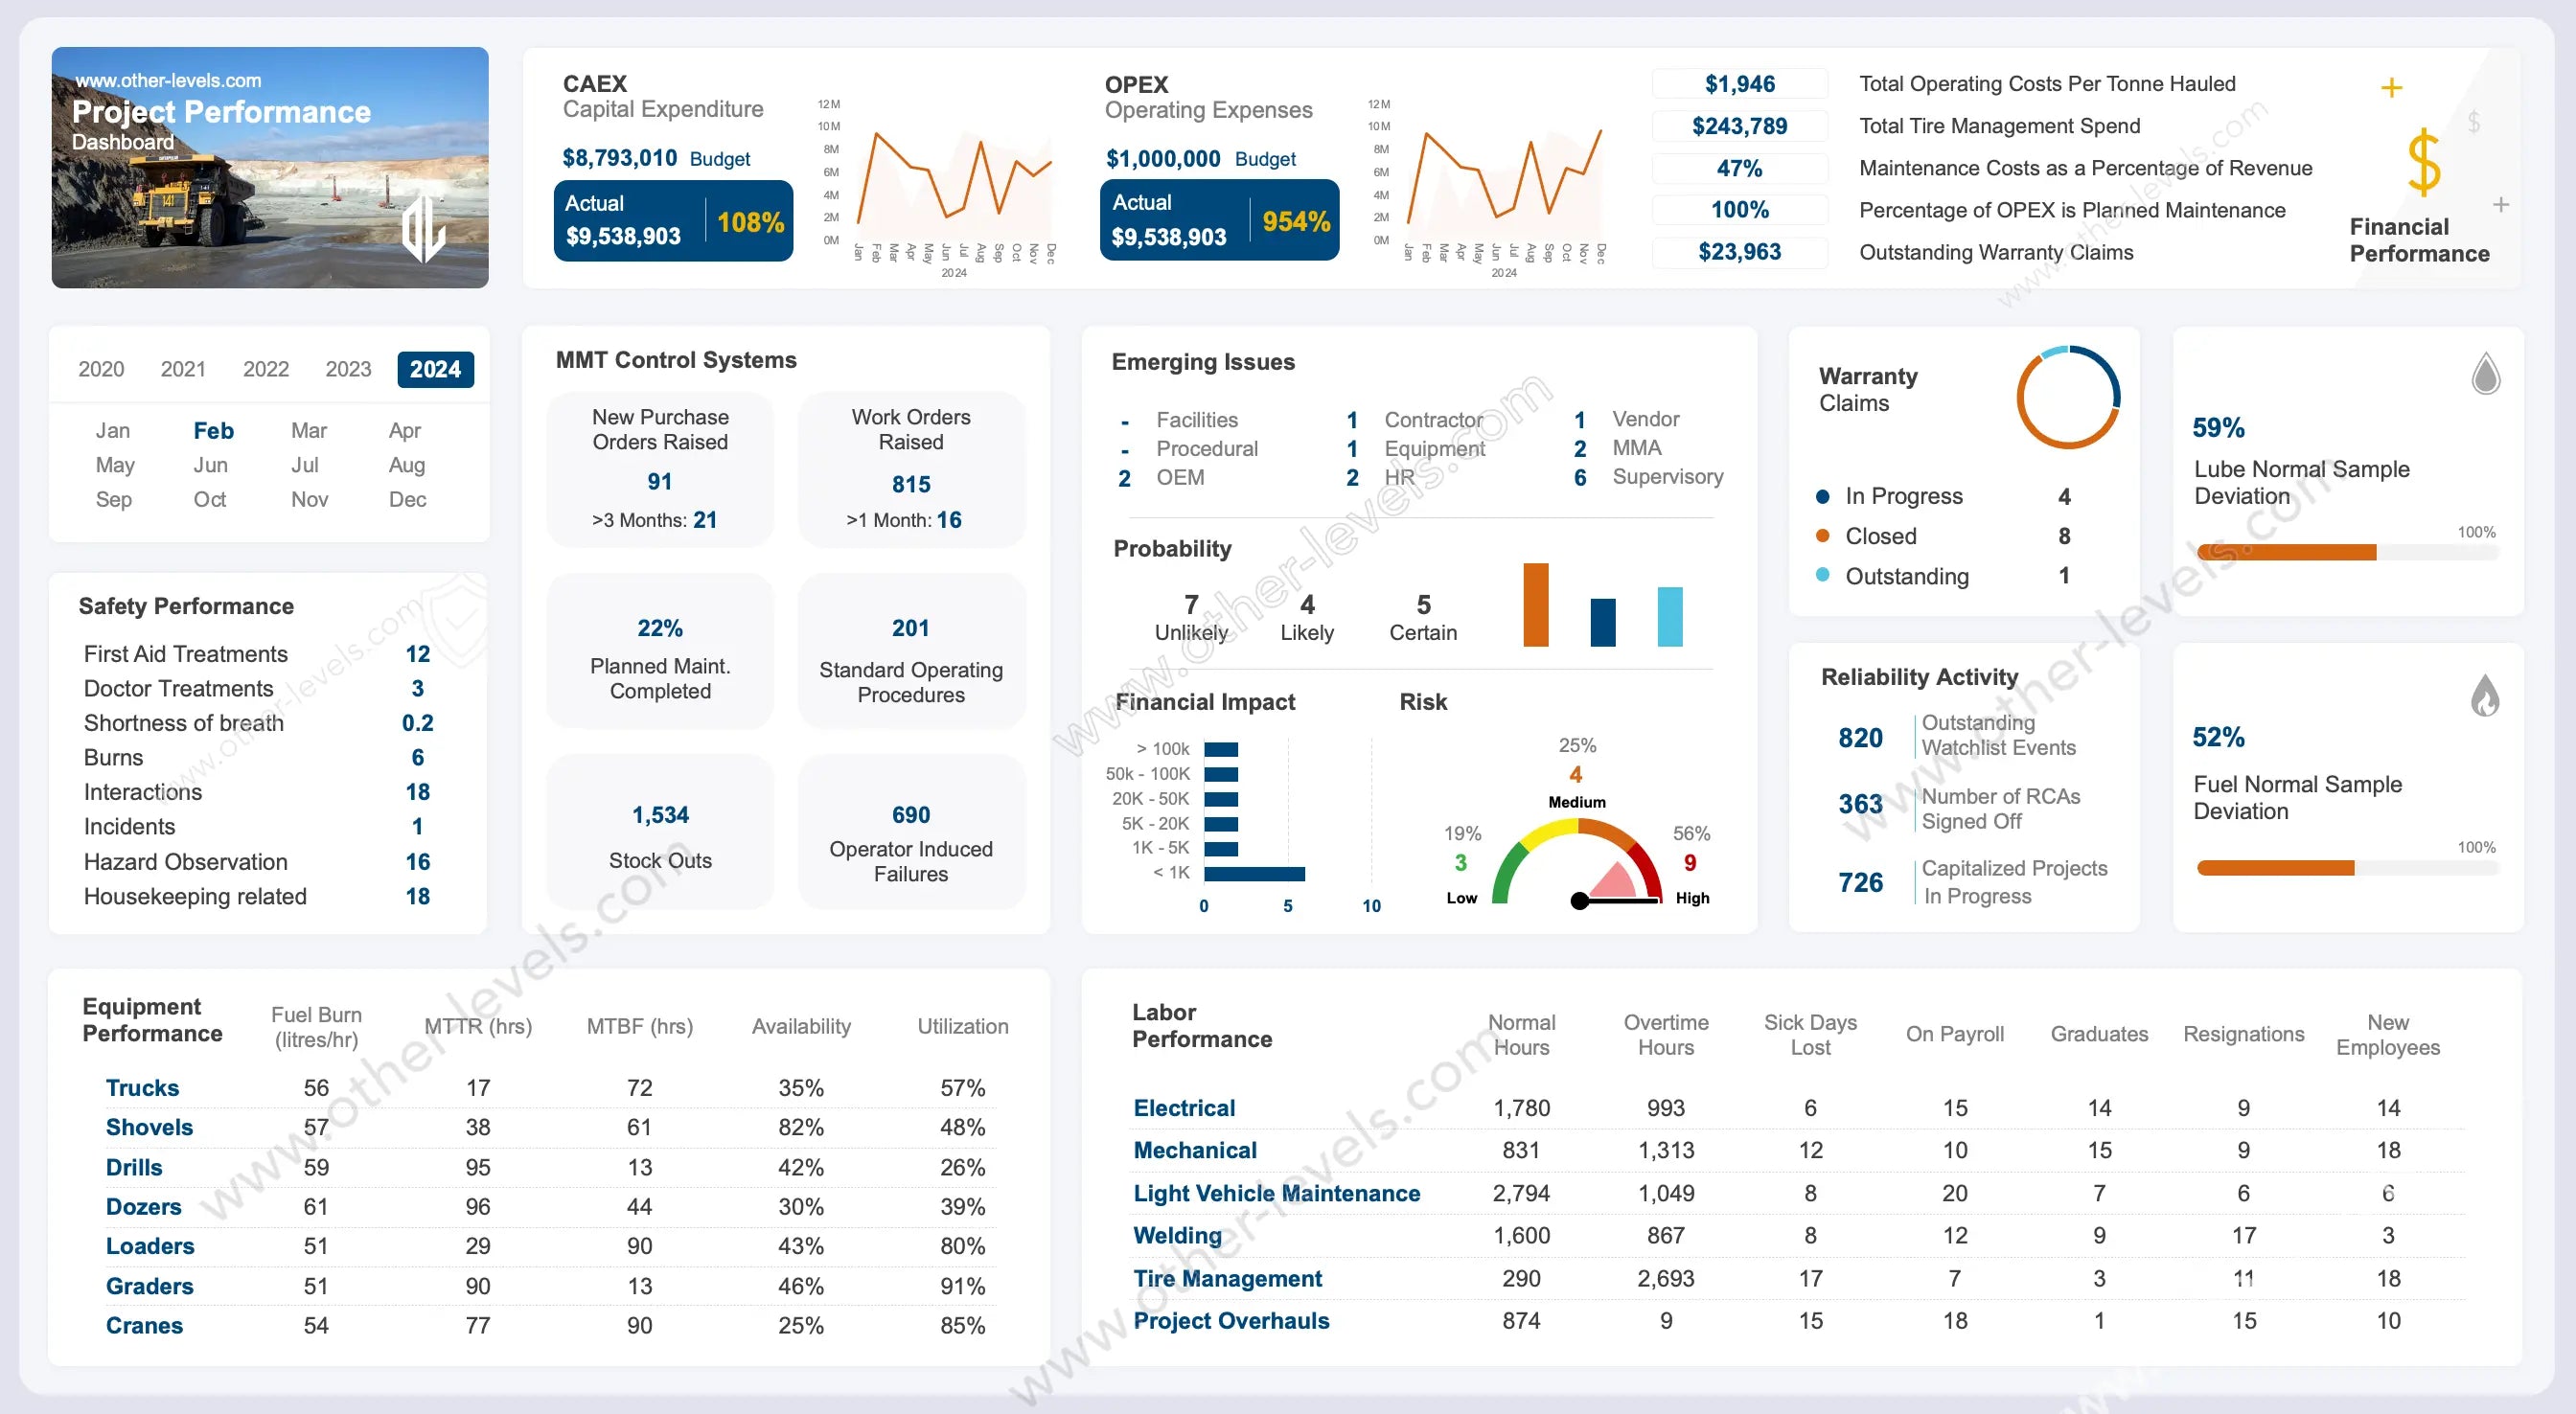
Run projects with clarity. This Excel Dashboard brings financials, safety metrics, equipment status, and labor insights into one clean control panel so you can scan trends, drill into issues, and act fast.
Video Walkthrough
Prefer to open it on YouTube? Watch the video here.
What you can monitor
- Financial Performance: Track CAPEX/OPEX budgets vs. actuals by month, visualize Budget vs. Actual trends, and review maintenance, warranty, and operating costs to keep spending on target.
- Safety Performance: Log incidents, treatments, and hazard observations; review recurring causes (including control-system and operator-related events) to improve compliance and prevention.
- Equipment Performance: Measure utilization, availability, and maintenance activity across multiple equipment types to boost reliability and reduce downtime.
- Labor Insights: See workload distribution and productivity signals to support better planning and resource allocation.
Why teams use it
- Fast visibility: Clear KPI cards and charts surface variances and hotspots without digging.
- Actionable trends: Monthly lines, bar charts, and breakdowns reveal where to optimize cost, safety, and uptime.
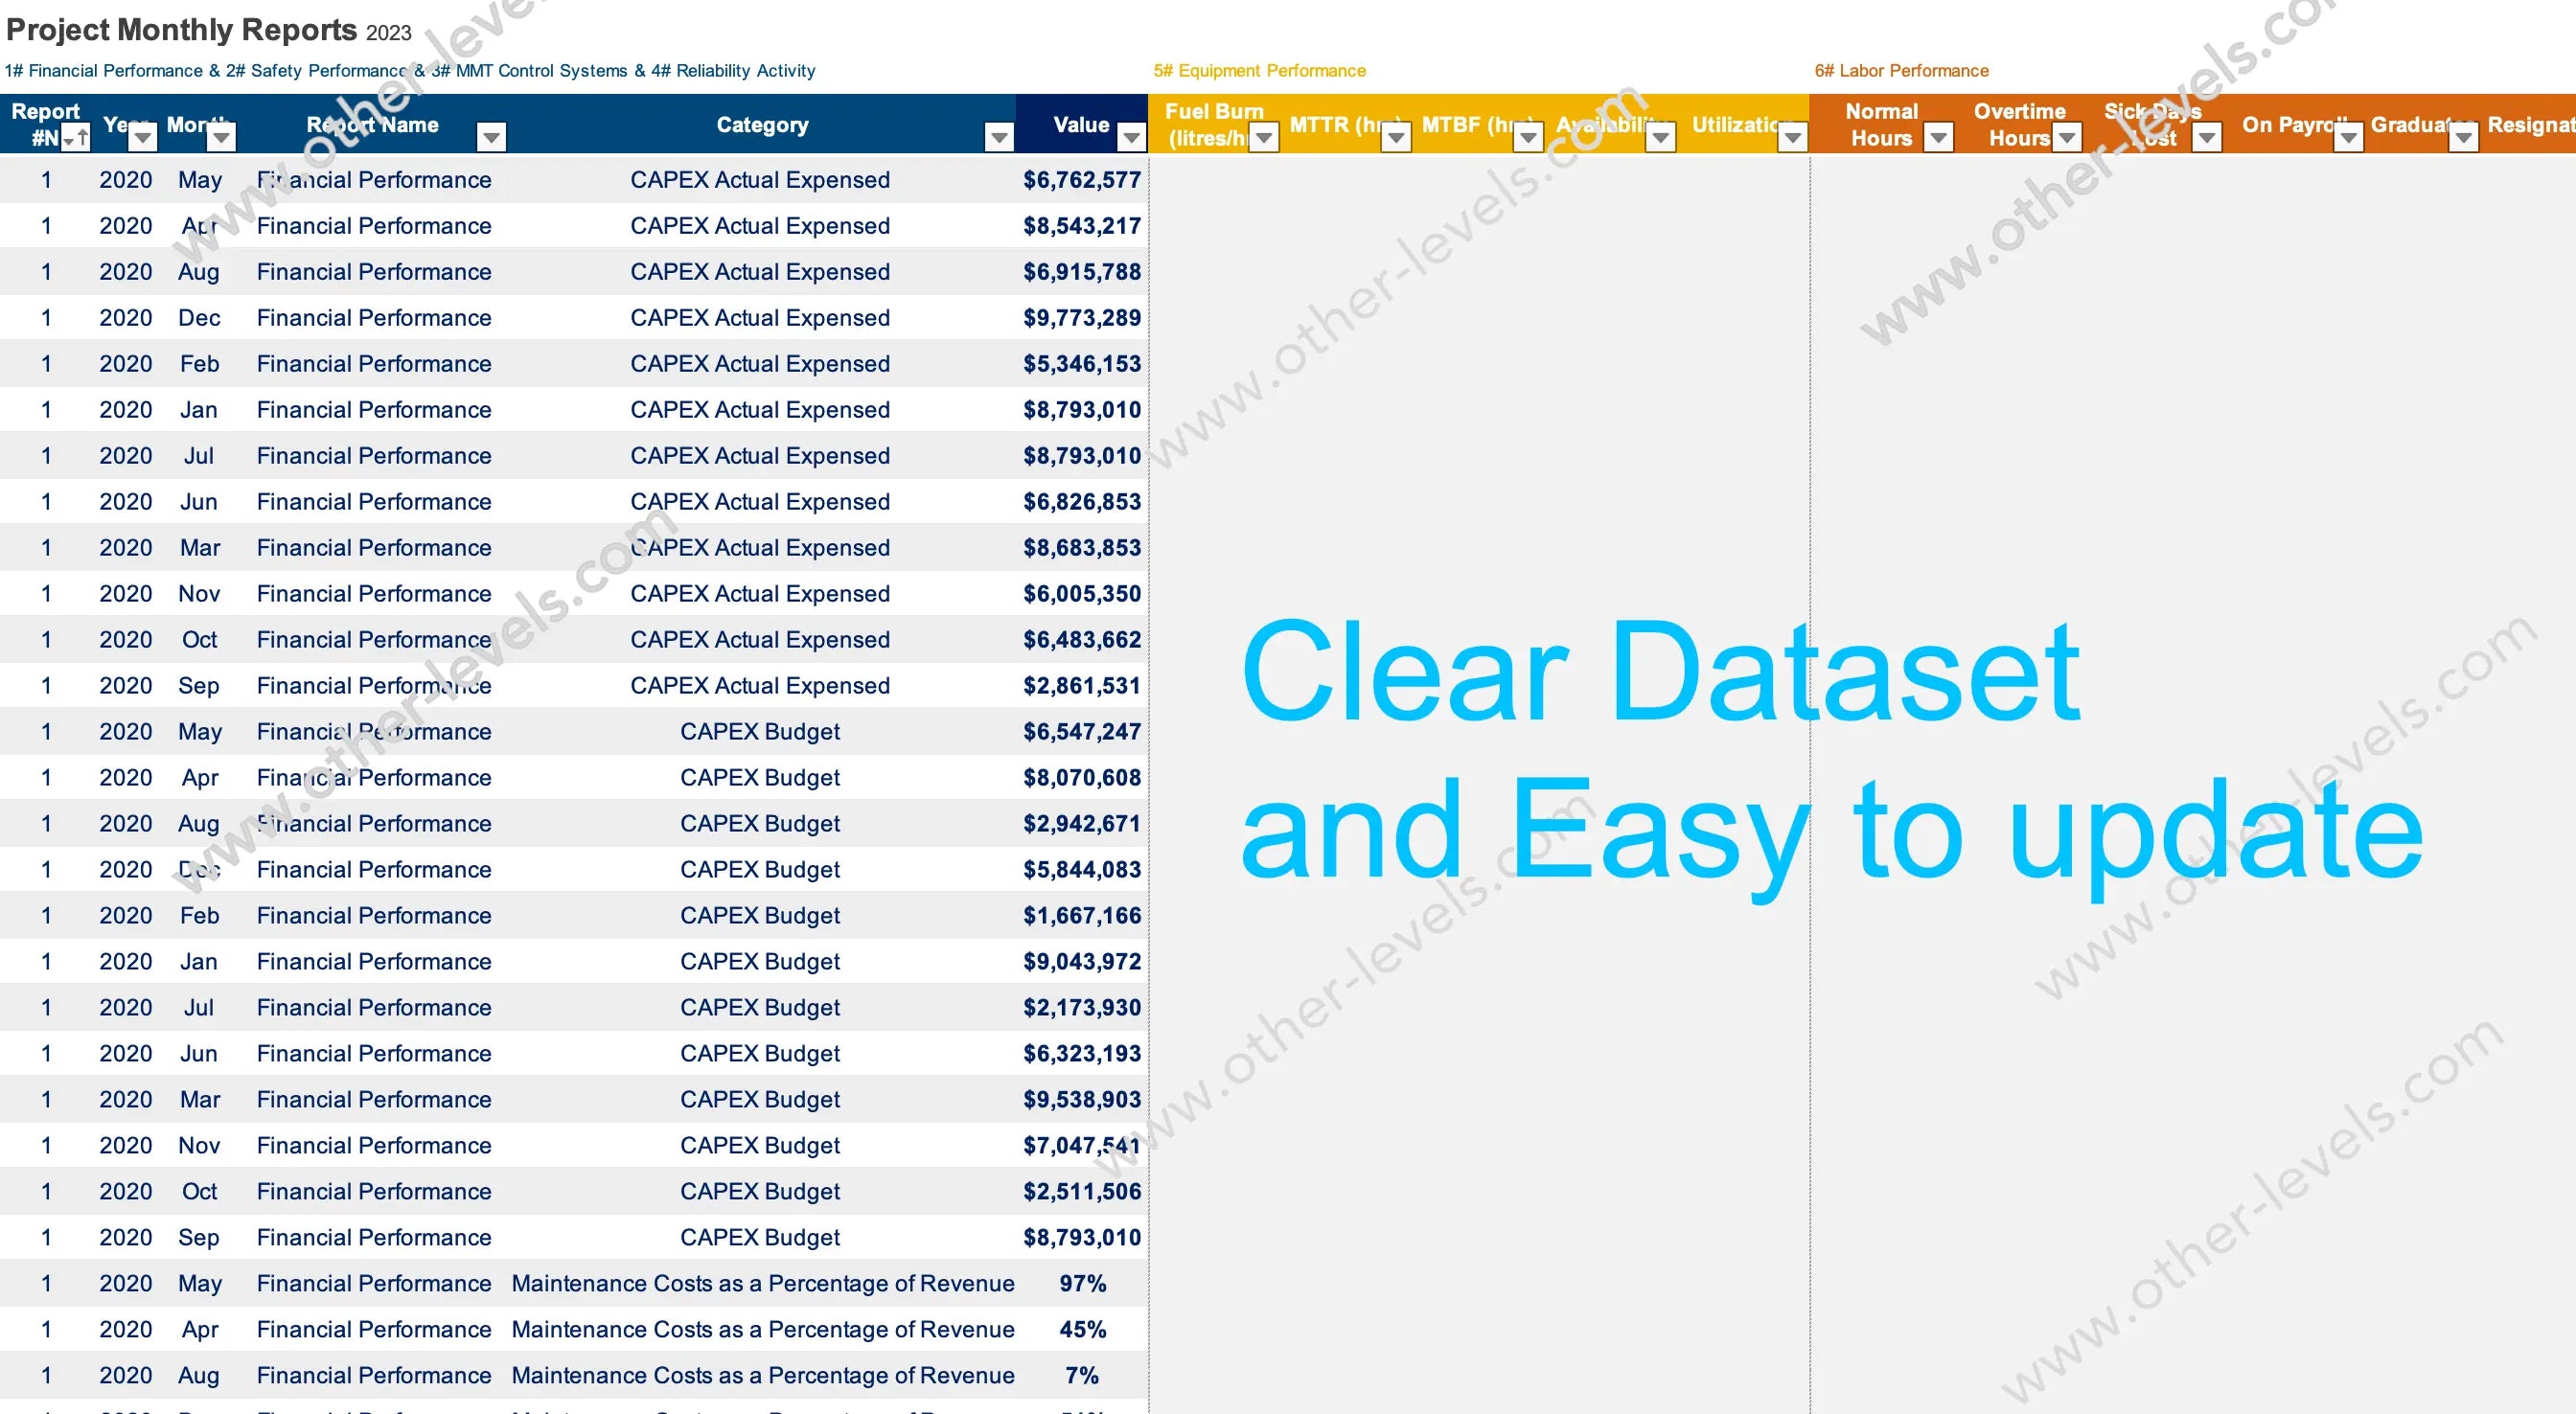
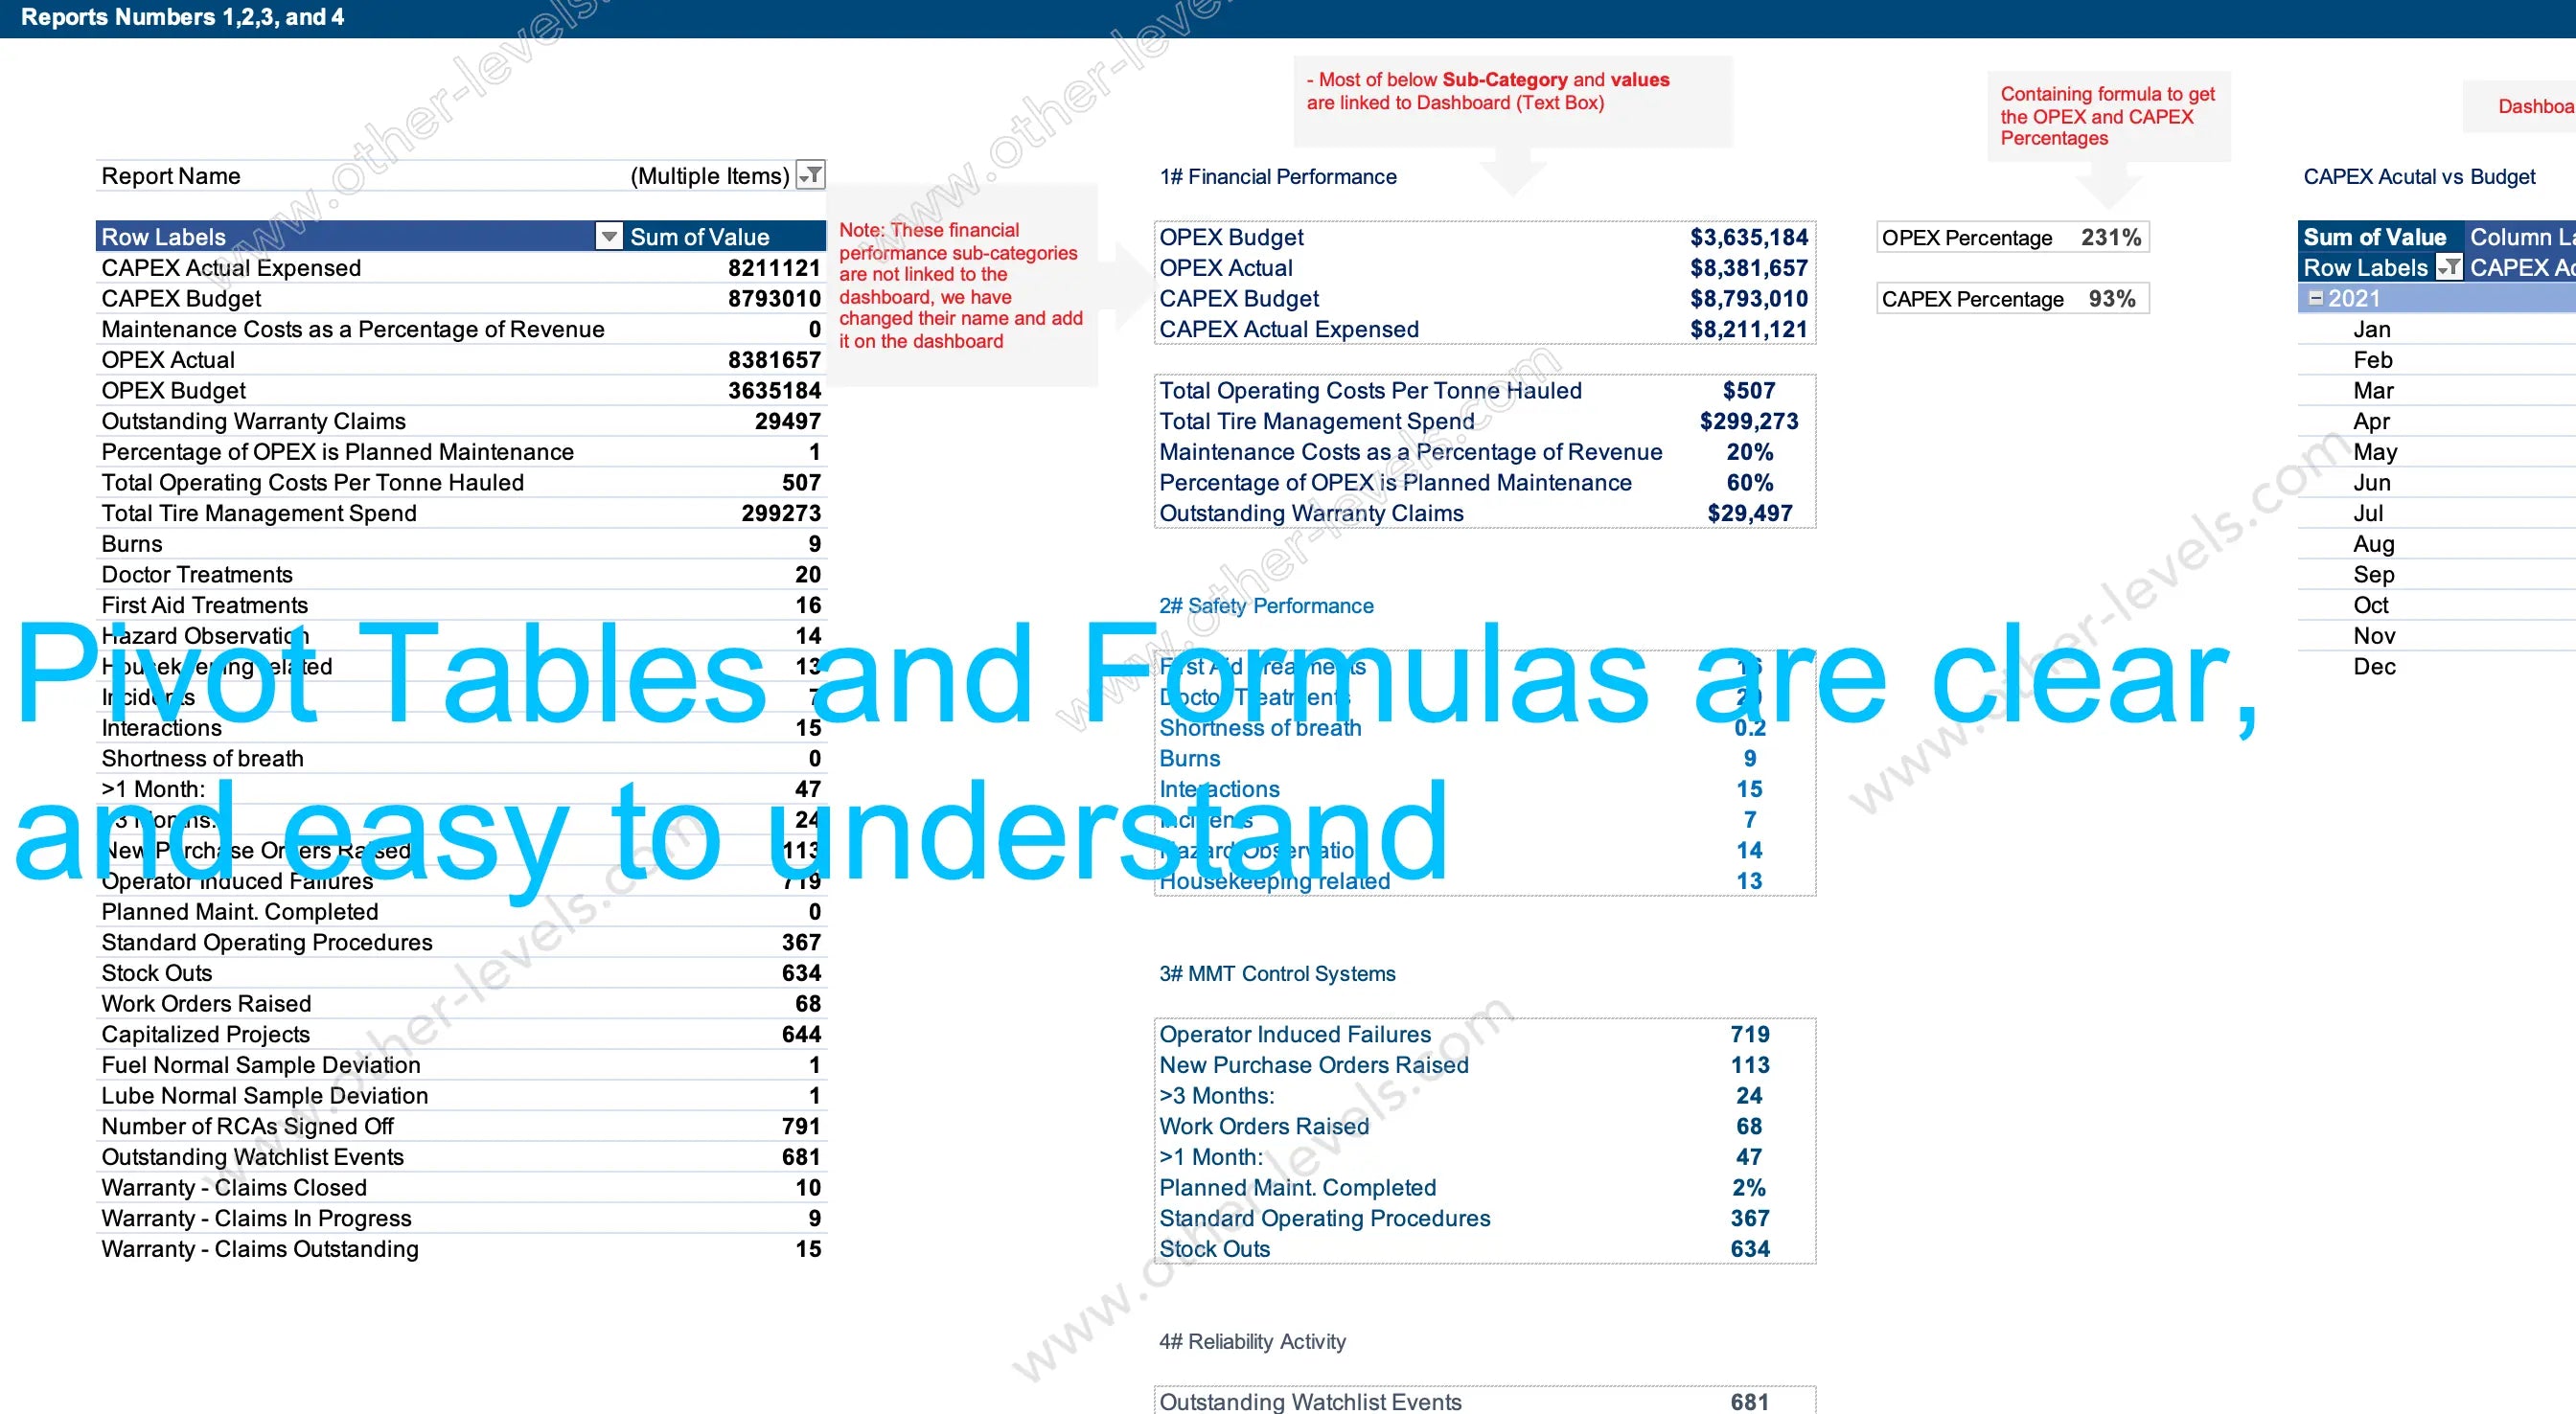
- Structured data model: A tidy, pivot-ready dataset keeps updates simple and reporting consistent.
- Flexible filters: Slice by period, business unit, or site to answer specific stakeholder questions in seconds.
Included pages & views
- Executive Overview: High-level KPIs for spend, incidents, equipment availability, and labor highlights.
- Financial Detail: CAPEX/OPEX breakdowns, Budget vs. Actual, cost categories, and trend analysis.
- Safety Detail: Incident counts, treatment types, hazard logs, and root-cause groupings.
- Equipment Detail: Utilization and availability by equipment type, with maintenance summaries.
- Labor Snapshot: Headline indicators for effort distribution and productivity (where captured).
Who it’s for
Project managers, operations leads, HSE teams, and asset managers who need a single source of truth for performance—built in Excel, easy to maintain, and ready for presentation.
Note: The dashboard is optimized for straightforward updates—refresh the underlying tables and your visuals adjust automatically. If you need additional KPIs or custom visuals, the layout is flexible for quick extensions.
Specifications
Get all essential details in one place. From features and package contents to software compatibility and skill level required, this section gives you a clear overview so you know exactly what to expect before download.
Template Features
Package Details
Software Compatibility
Skill Level Required
Intermediate
FAQs
Please read our FAQs page to find out more.
Are the templates fully customizable?
Yes, all our templates are fully customizable. You can adjust the layout, data, and design elements to fit your specific needs. Our templates are designed to be flexible, allowing you to easily tailor them to your preferences.
Can I order a product in any language?
Yes, we provide products in any language. Simply select the "Dashboard language change" Service and once your order is placed, you will receive it within 48 hours.
What happens if I choose the wrong monitor screen size for my dashboard?
If you choose the wrong screen size, the dashboard may not display correctly on your monitor. Elements could appear too large, too small, or misaligned, affecting the readability and usability of the dashboard. We recommend selecting the appropriate screen size to ensure optimal viewing and performance.
Do I need specific skills to use the advanced Excel dashboard templates?
Our advanced Excel dashboards are easy to use, the only thing you need to know is how to work with PivotTables. With basic knowledge of PivotTables, you'll be able to customize and fully utilize these templates effortlessly. "Please check the skill level required"
All dashboards are 100% editable Excel files. Learn how to use them through our video tutorials, included datasets, and lifetime access program.