Tutorials YouTube Channel
Dive into a world of hands-on learning with our comprehensive video tutorials, available on our YouTube channel, Our tutorials are crafted to guide you through each step of building powerful data visualizations, dashboards, and analytical tools using Excel and more. Whether you're a beginner or looking to enhance your skills, our video library covers everything from foundational techniques to advanced strategies, helping you bring your data insights to life.
Join our community of learners, follow along with real-world examples, and practice using the free datasets available on our site. Subscribe and start transforming your data skills today!
Join our community of learners, follow along with real-world examples, and practice using the free datasets available on our site. Subscribe and start transforming your data skills today!
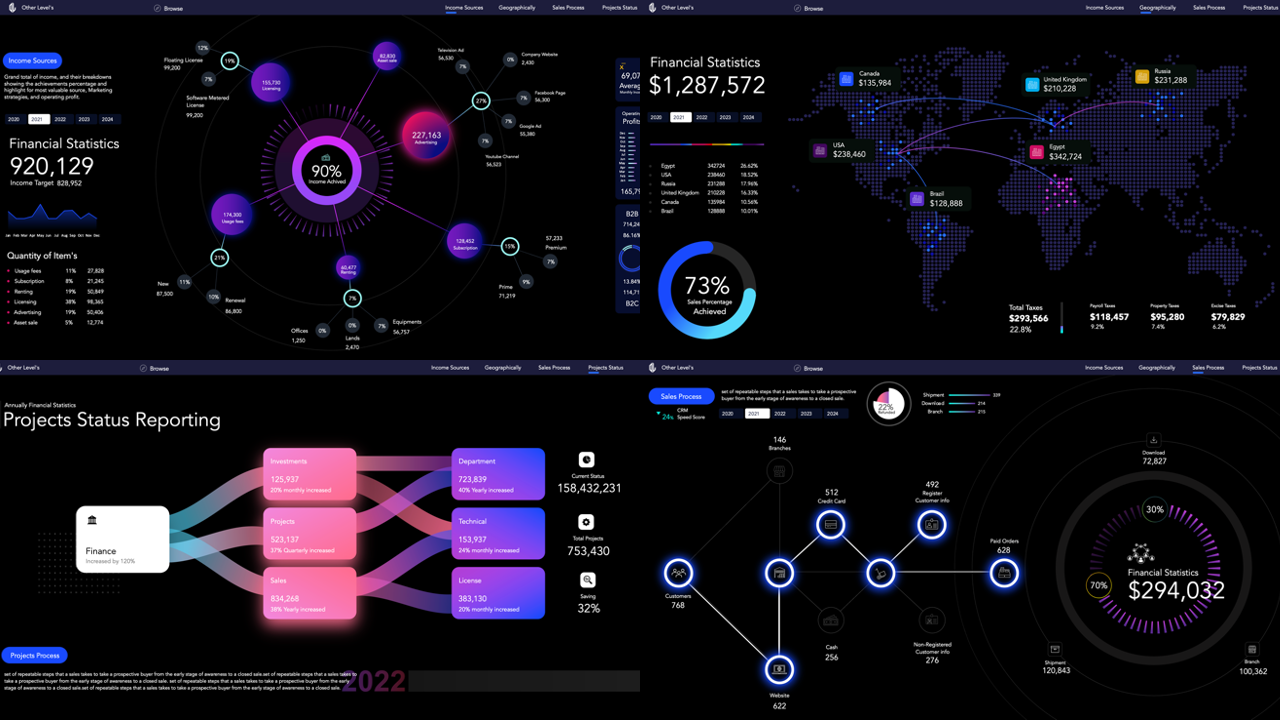
Financial Statistics Dashboards System
Unlock the secrets behind a Financial Statistics Dashboard that has captured nearly 6 million views! Learn step-by-step how to create stunning Excel dashboards that visualize key financial metrics and drive business insights. Perfect for analysts, data enthusiasts, and anyone looking to elevate their Excel skills!
How to build a Dynamic & Interactive Dashboard in EXCEL with Pivot Tables & Charts
Join over 5 million viewers in learning how to build a Dynamic & Interactive Dashboard in Excel using Pivot Tables & Charts! In Episode #1, you'll get a step-by-step guide to mastering data visualization and creating impactful dashboards. Perfect for data analysts and Excel enthusiasts looking to elevate their skills!