

Comprehensive Project Management Performance Excel Dashboard
Pairs well with

Comprehensive Project Management Performance Excel Dashboard
Comprehensive Project Management Performance Excel Dashboard
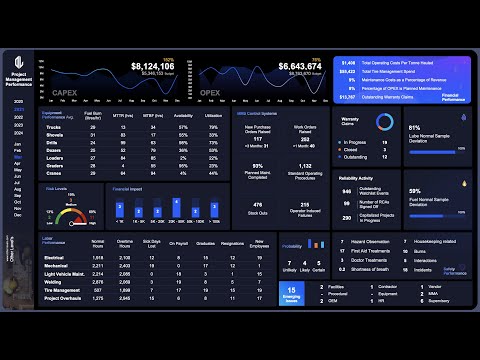
Achieve superior project oversight with the Comprehensive Project Management Performance Dashboard, a cutting-edge Excel-based solution designed to streamline performance tracking and decision-making across multiple domains. Tailored for professionals managing complex projects, this Excel Dashboard provides powerful insights into financial, operational, safety, and equipment performance metrics.
Gain control over Financial Performance with detailed analytics on CAPEX and OPEX expenditures, including budgets, actuals, and percentage tracking. Visualize key trends with Monthly Budget vs. Actual line charts, ensuring real-time visibility of resource allocation. Analyze critical metrics like maintenance costs, warranty claims, and operating costs to optimize expenditure and maximize efficiency.
The dashboard also excels in monitoring Safety Performance, offering comprehensive data on incidents, treatments, and hazard observations. With features that track control systems and operator-induced failures, you can prioritize workplace safety and compliance effectively.
For Equipment Performance, the dashboard provides in-depth tracking for utilization, availability, and maintenance across seven types of equipment, helping managers improve asset reliability and performance. Additional insights into Labor Performance, including hours worked, sick days lost, and employee turnover, ensure a holistic view of workforce efficiency.
Dynamic visualizations, including bar charts, dynamic indicators, and line graphs, make the data easy to interpret and actionable. Whether you’re managing budgets, safety, equipment, or labor, the Project Management Performance Dashboard empowers you with the tools you need to drive success.
Choose the Comprehensive Project Management Performance Dashboard by Other Levels to enhance project efficiency and achieve exceptional results with confidence.
Dashboard contents
- Financial Performance
- CAPEX Capital Expenditure
- Total Budgets
- Total Actual
- Actual percentage from budget
- Monthly Budgets vs. Actual line chart
- OPEX Capital Expenditure
- Total Budgets
- Total Actual
- Actual percentage from budget
- Monthly Budgets vs. Actual line chart
- Percentage of OPEX is Planned Maintenance
- Maintenance Costs as a Percentage of Revenue
- Total Operating Costs Per Tonne Hauled
- Outstanding Warranty Claims
- Total Tire Management Spend
- Safety Performance
- First Aid Treatments
- Doctor Treatments
- Shortness of breath
- Burns
- Interactions
- Incidents
- Hazard Observation
- Housekeeping related
- Control Systems
- Operator Induced Failures
- New Purchase Orders Raised
- Purchase Orders Raised for more than 3 Months
- Work Orders Raised
- Work Orders Raised for more than 1 Month
- Planned Maintenance Completed
- Standard Operating Procedures
- Stock Outs
- Reliability Activity
- Outstanding Watch list Events
- Number of RCAs Signed Off
- Capitalized Projects
- Warranty - Claims In Progress
- Warranty - Claims Closed
- Warranty - Claims Outstanding
- Lube Normal Sample Deviation - Bar Chart
- Fuel Normal Sample Deviation - Bar Chart
- Emerging Issues
- Origin
- Risk level percentage with dynamic indicator chart
- Probability
- Financial Impact bar chart
- Equipment Performance
- Fuel Burn (liters/hr)
- Mean time to repair (hrs)
- Mean time between failures (hrs)
- Availability
- Utilization
- for 7 different equipments (Trucks, Shovels, Drills, Dozers, Loaders, Graders, and Cranes)
- Labor Performance
- Normal Hours
- Overtime Hours
- Number of on Payroll
- Number of Graduates
- Sick Days Lost
- Resignations
- New Employees
Template Features
Package Details
Software Compatibility
Skill Level Required
Intermediate
FAQs
Please read our FAQs page to find out more.
Are the templates fully customizable?
Yes, all our templates are fully customizable. You can adjust the layout, data, and design elements to fit your specific needs. Our templates are designed to be flexible, allowing you to easily tailor them to your preferences.
Can I order a product in any language?
Yes, we provide products in any language. Simply select the "Other Language" option from the product options during your purchase. Once your order is placed, you will receive it within 48 hours.
What happens if I choose the wrong monitor screen size for my dashboard?
If you choose the wrong screen size, the dashboard may not display correctly on your monitor. Elements could appear too large, too small, or misaligned, affecting the readability and usability of the dashboard. We recommend selecting the appropriate screen size to ensure optimal viewing and performance.
Do I need any specific skills to use the dashboards?
Yes, to effectively use our advanced Excel dashboards, you must have at least a basic understanding of PivotTables. This will help you customize and analyze the data efficiently.
Do you provide services to add our own data to the purchased templates?
No, we do not offer services to input your specific data into the purchased templates. The templates are fully customizable, allowing you to easily add your own data.
Do I need specific skills to use the advanced Excel dashboard templates?
Our advanced Excel dashboards are easy to use, the only thing you need to know is how to work with PivotTables. With basic knowledge of PivotTables, you'll be able to customize and fully utilize these templates effortlessly. "Please check the skill level required"
Can I showcase these templates on websites or online platforms?
No, it is against our copyright policy to showcase these templates on websites, social media, or any online platforms. The templates are for your personal use only and are not permitted for public display or distribution.
Business Templates
Shop the Analytical Look
Services Requests Management Power BI Dashboard Template
Comprehensive Project Management Performance Excel Dashboard


