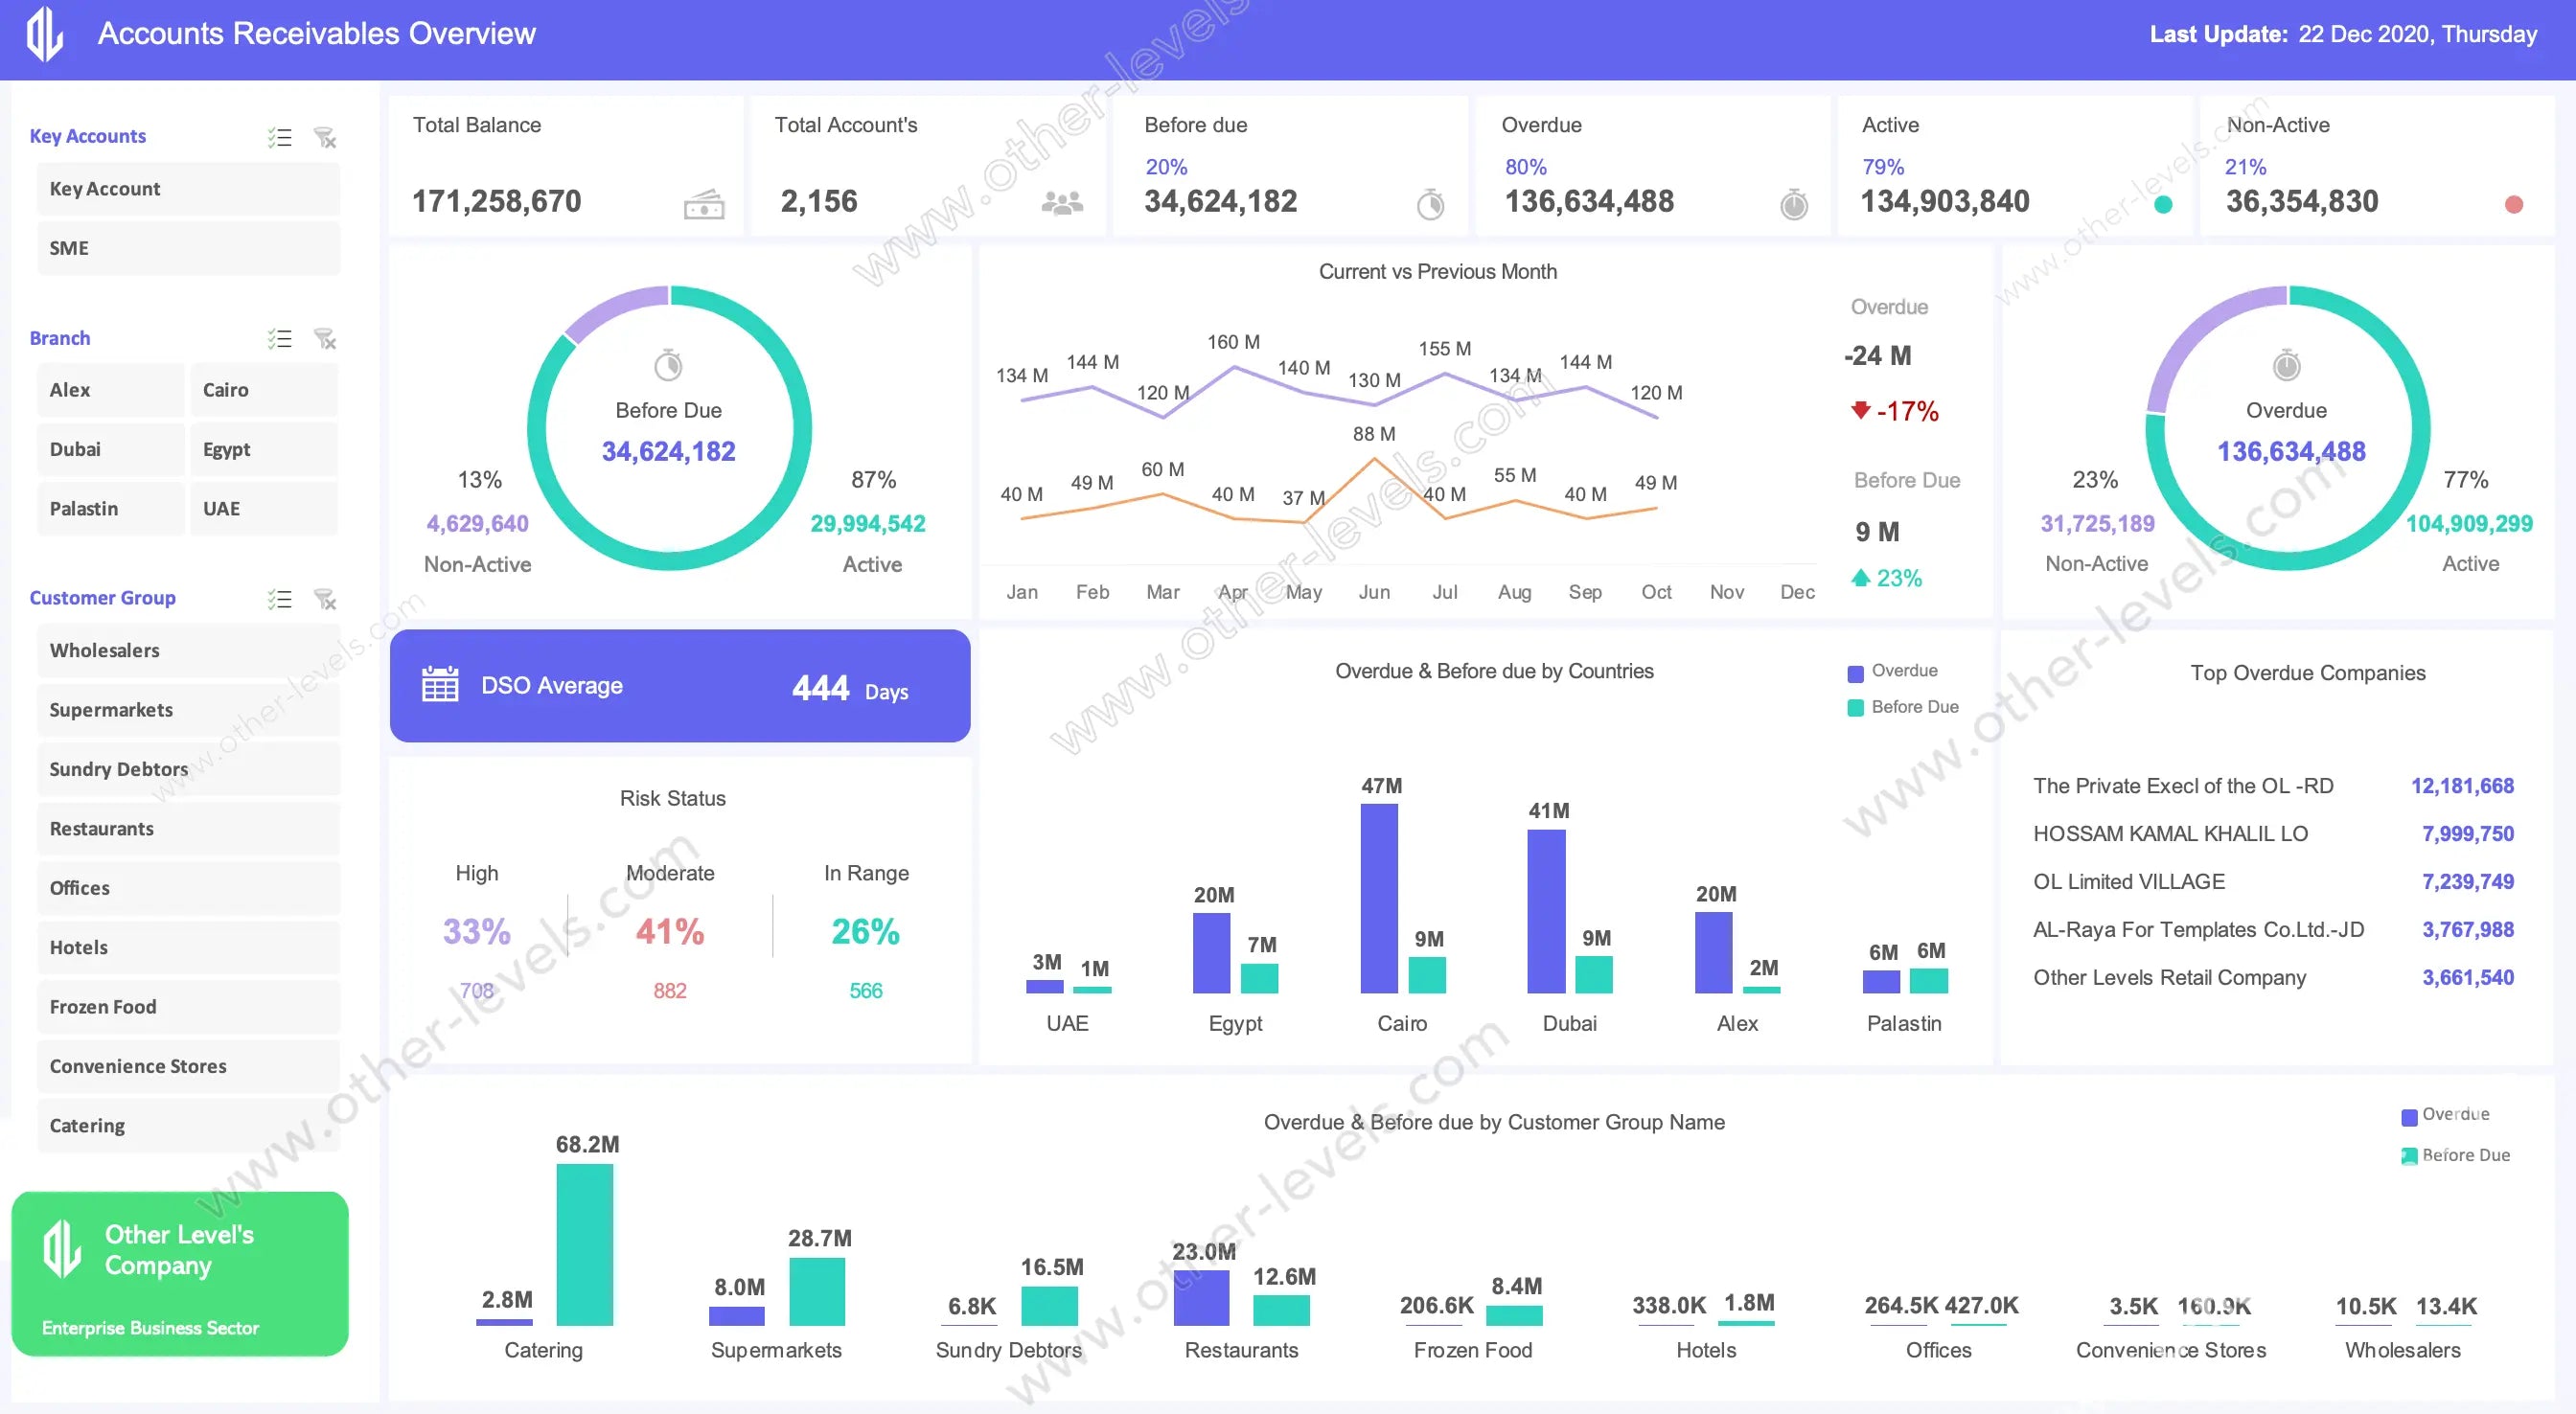
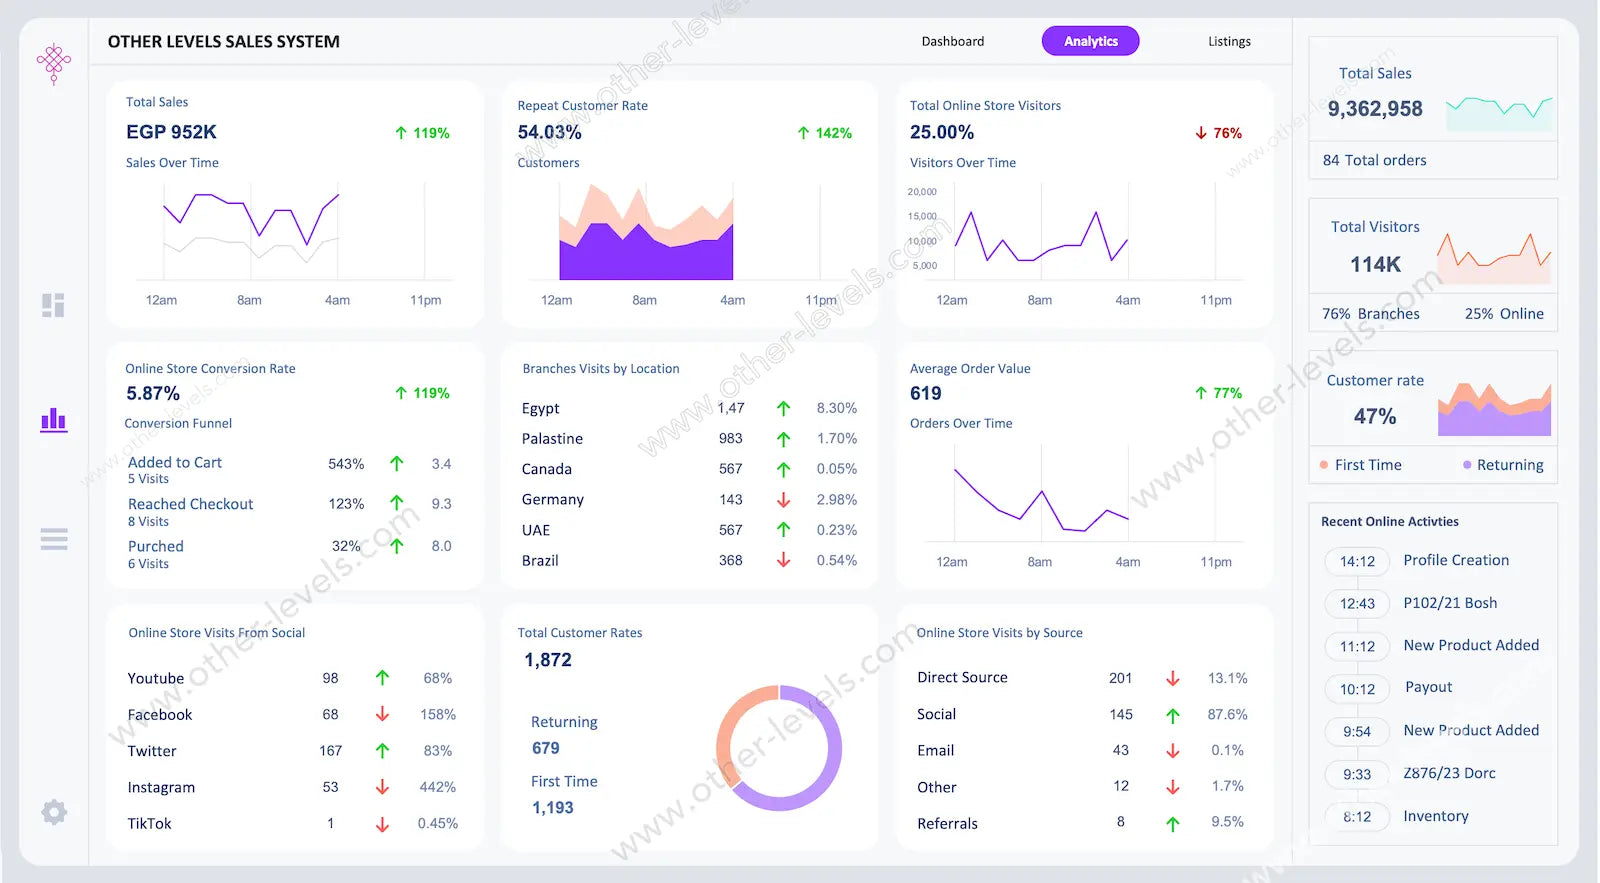
Dashboard Templates for Smarter Data Visualizations
Explore Dashboard Templates built for interactive dashboards and business dashboards across Excel and PowerPoint from Other Levels.
Read more
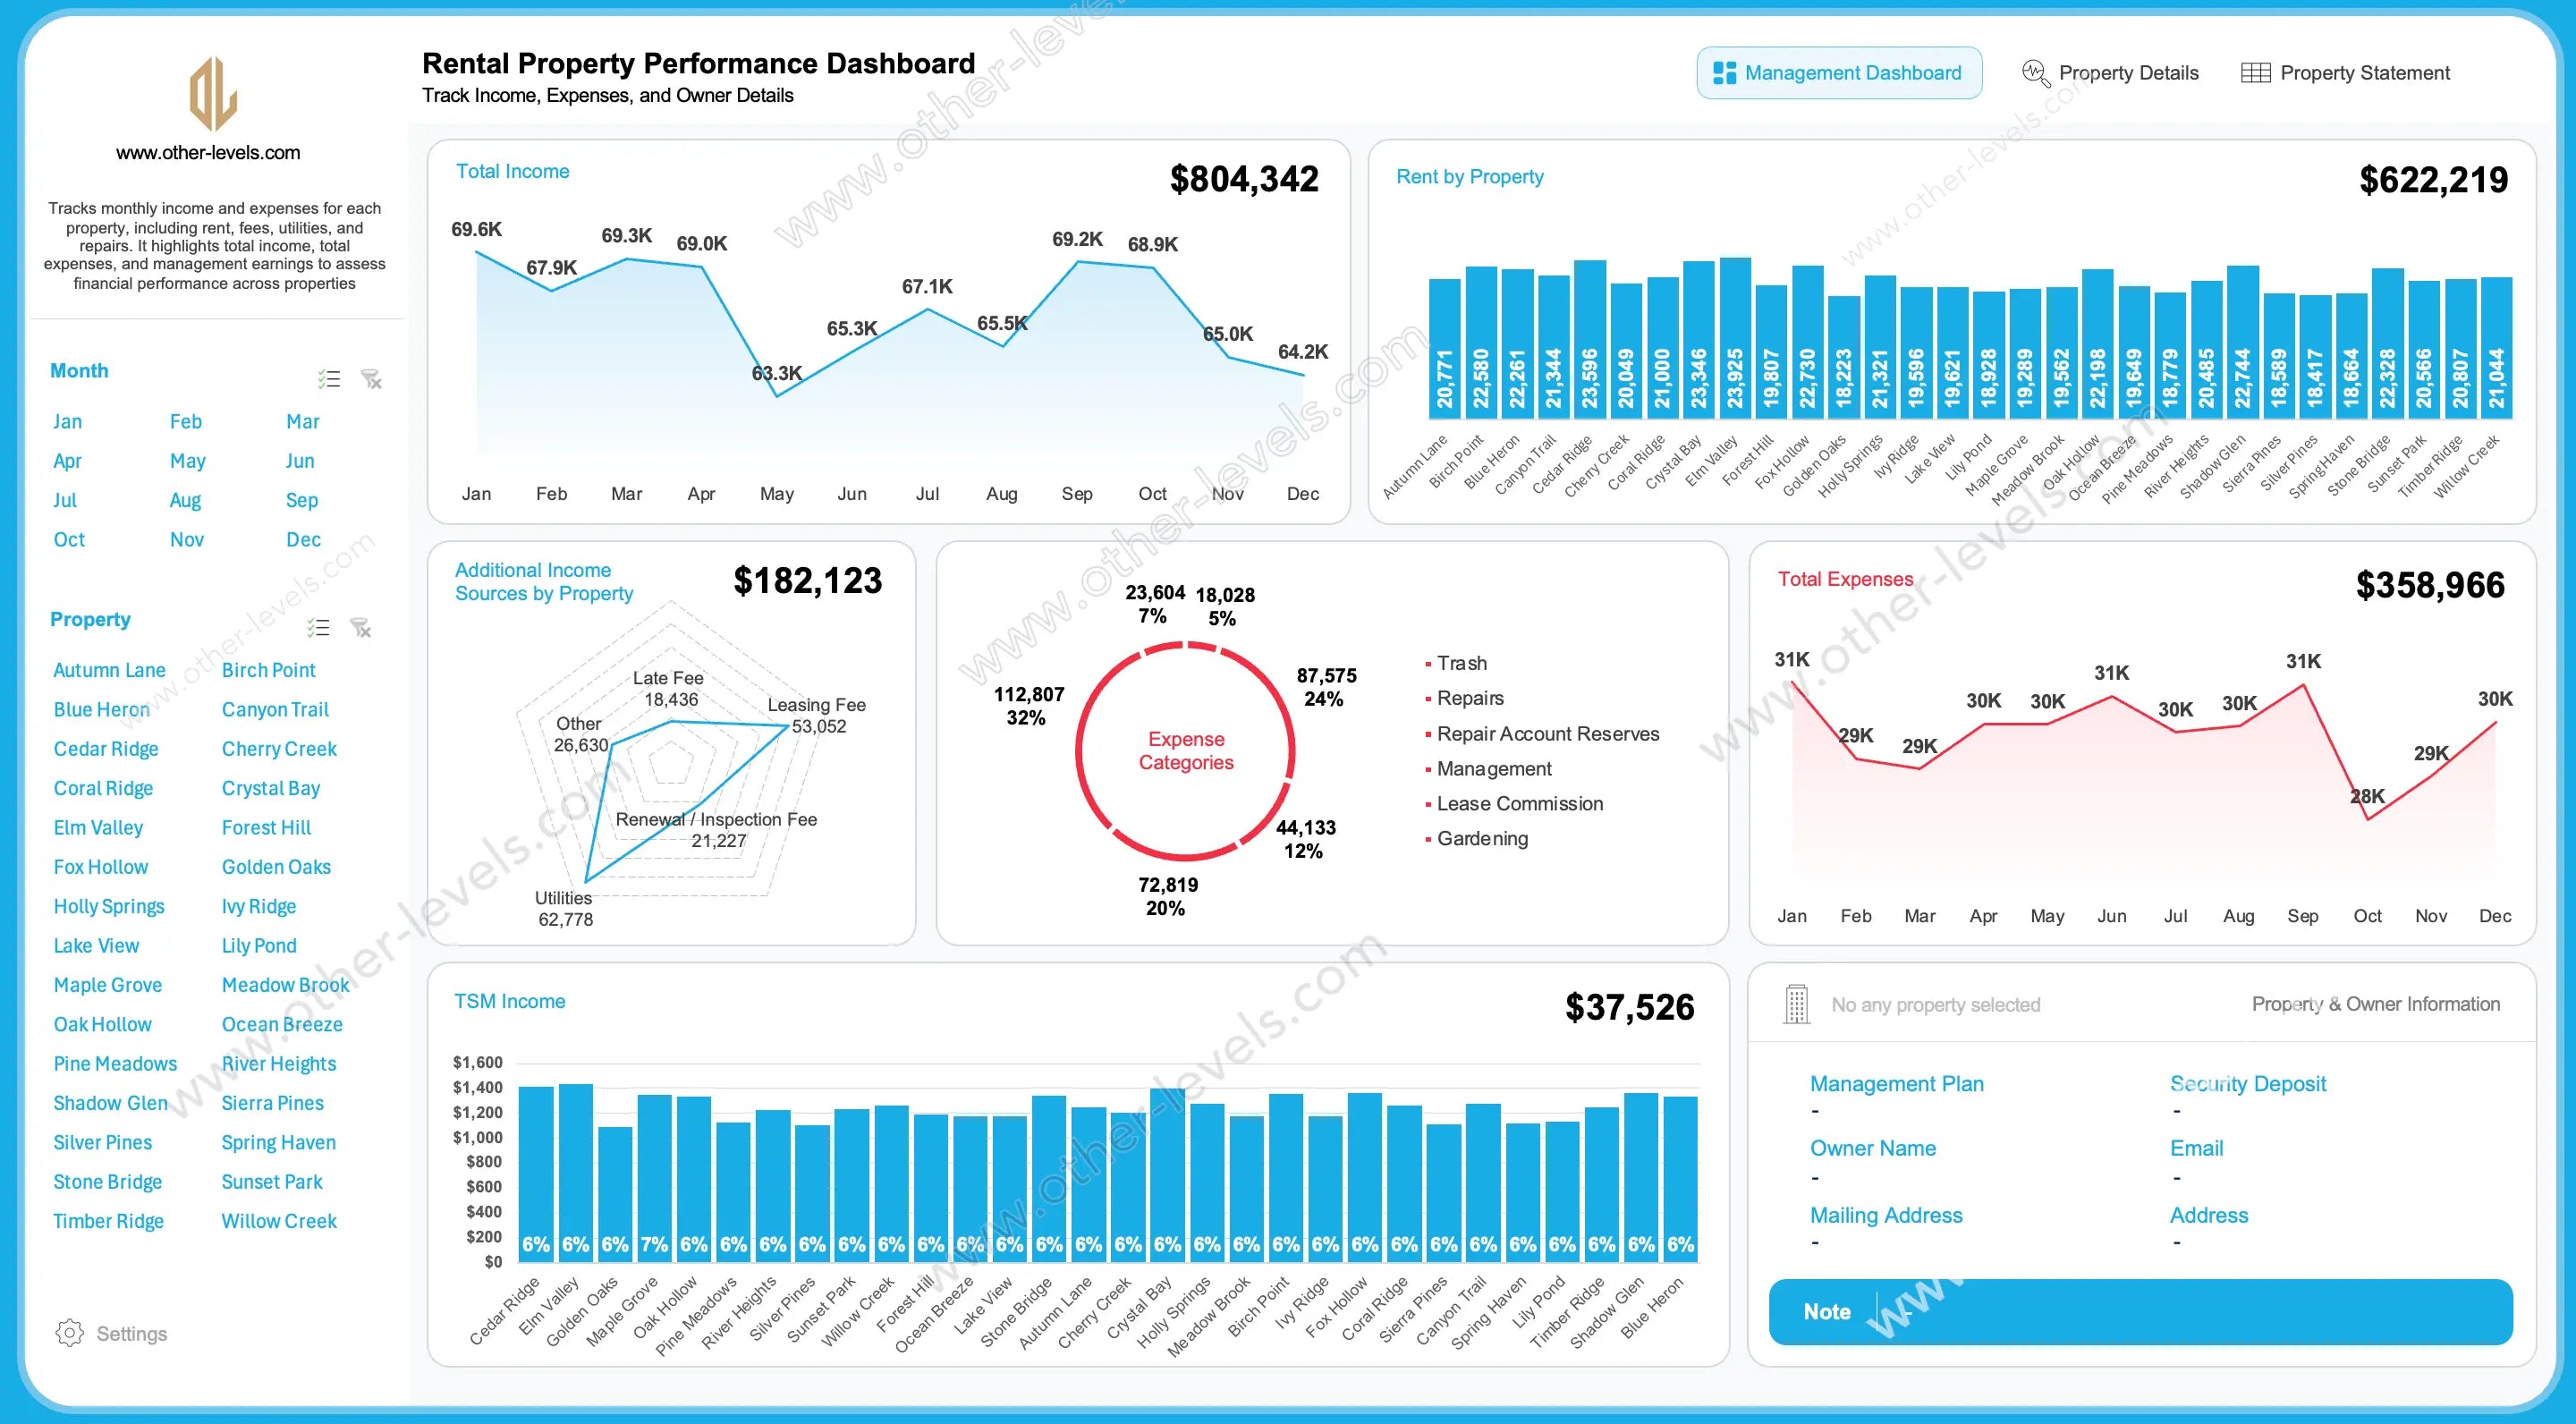
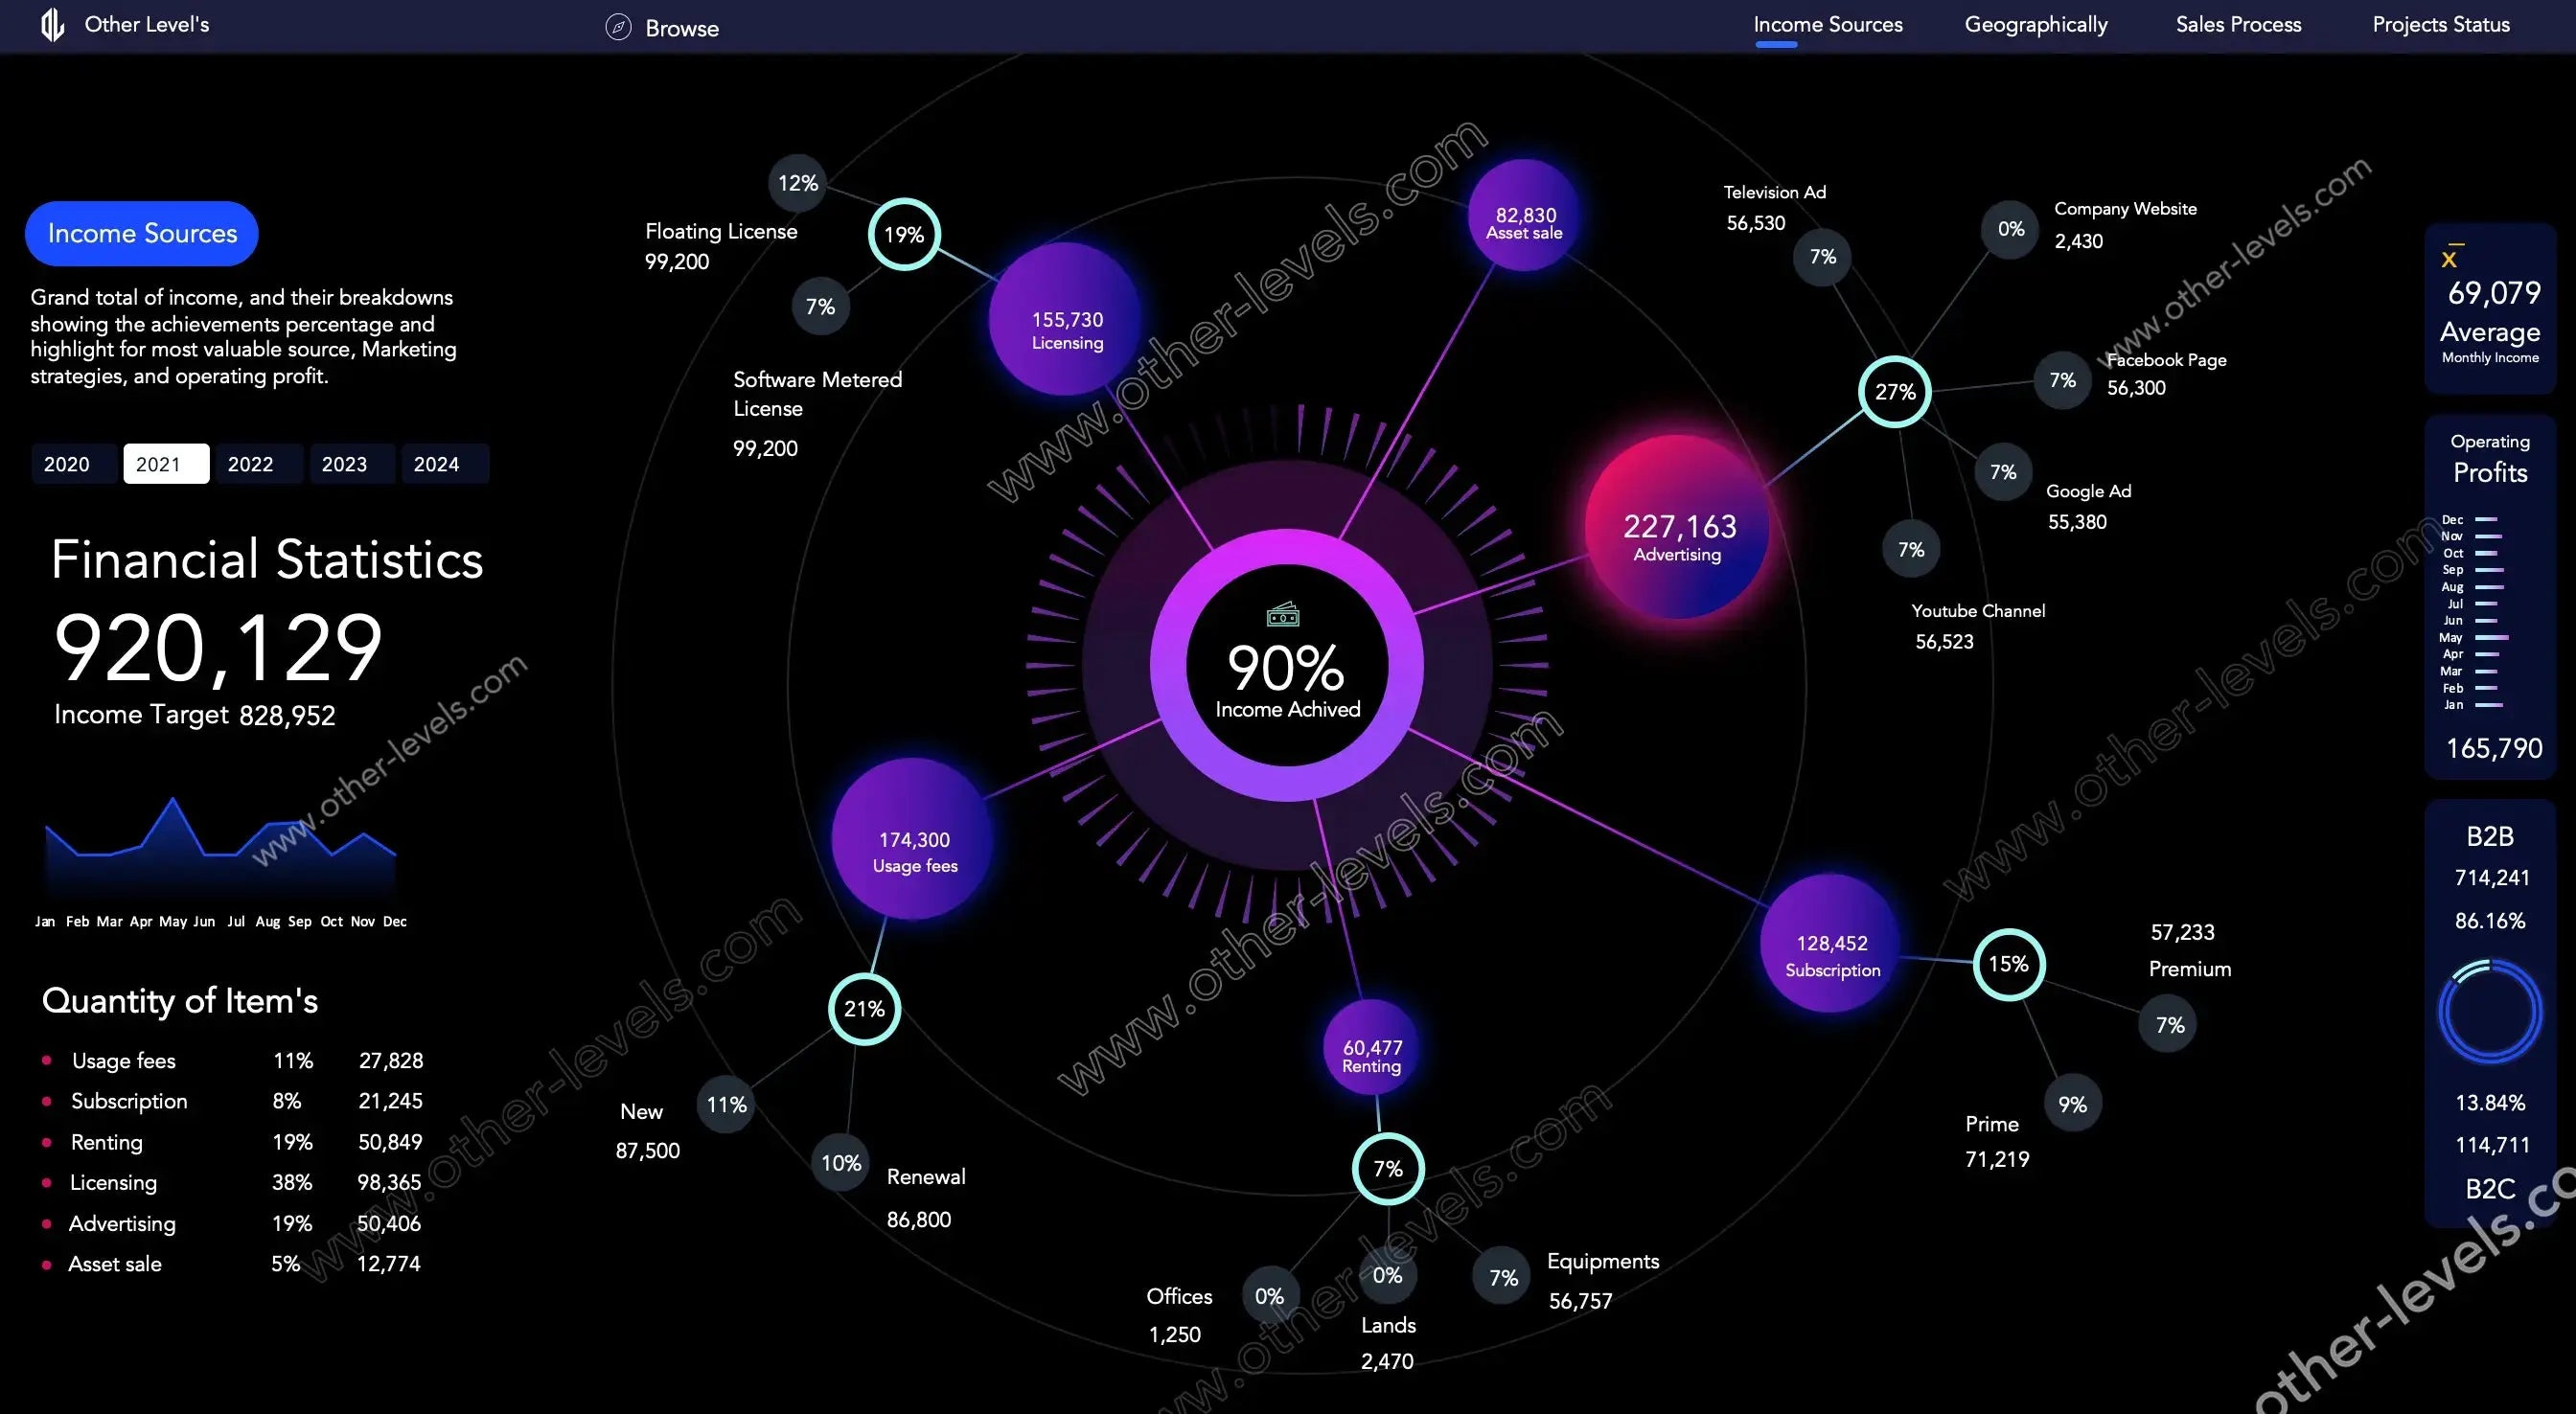
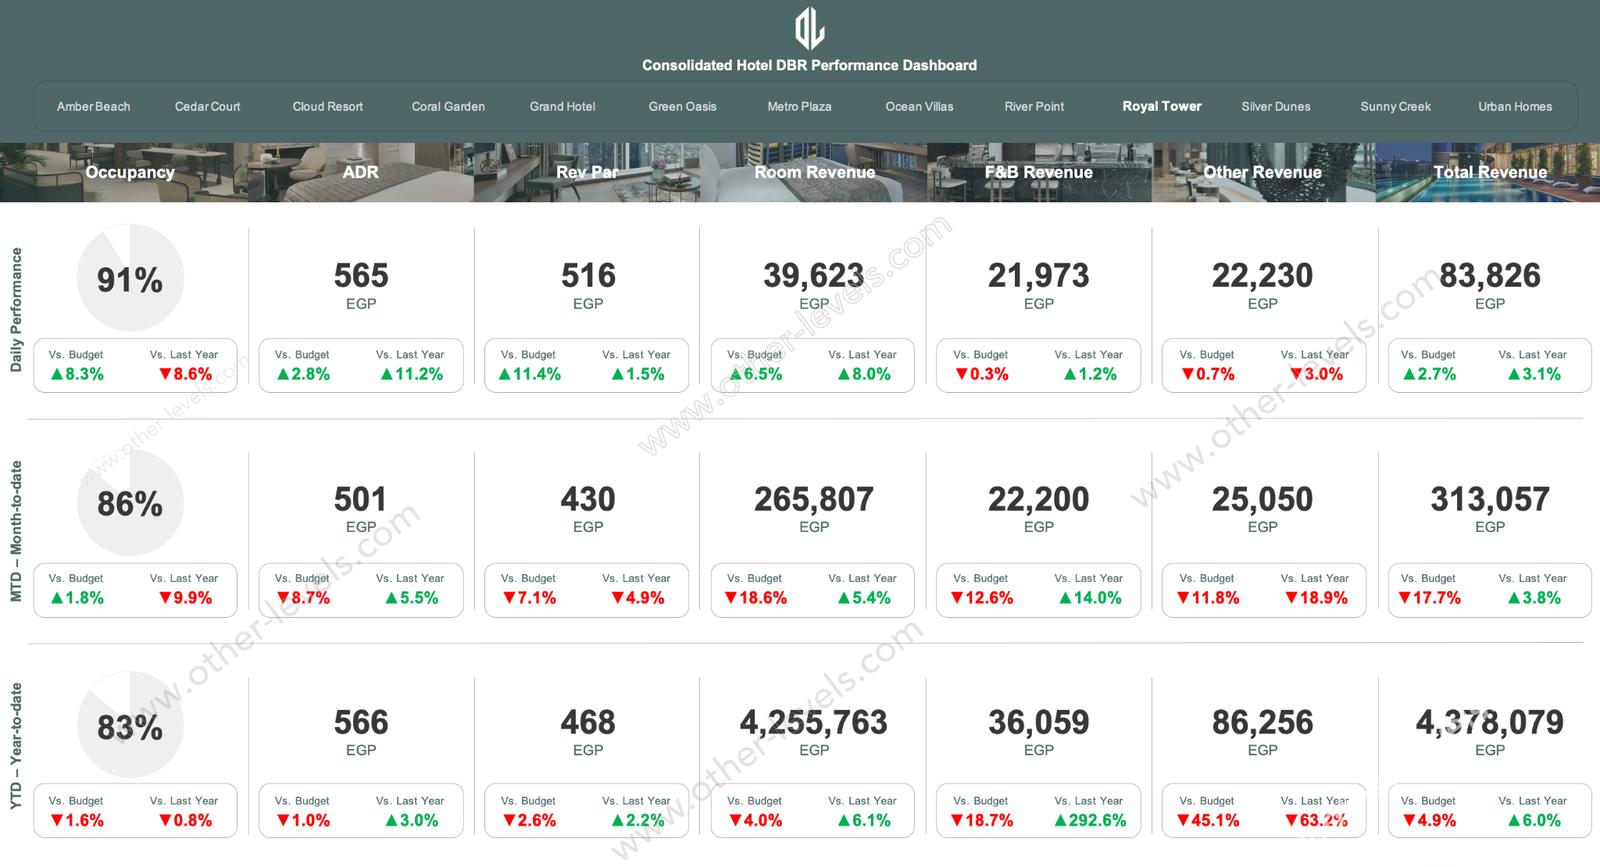
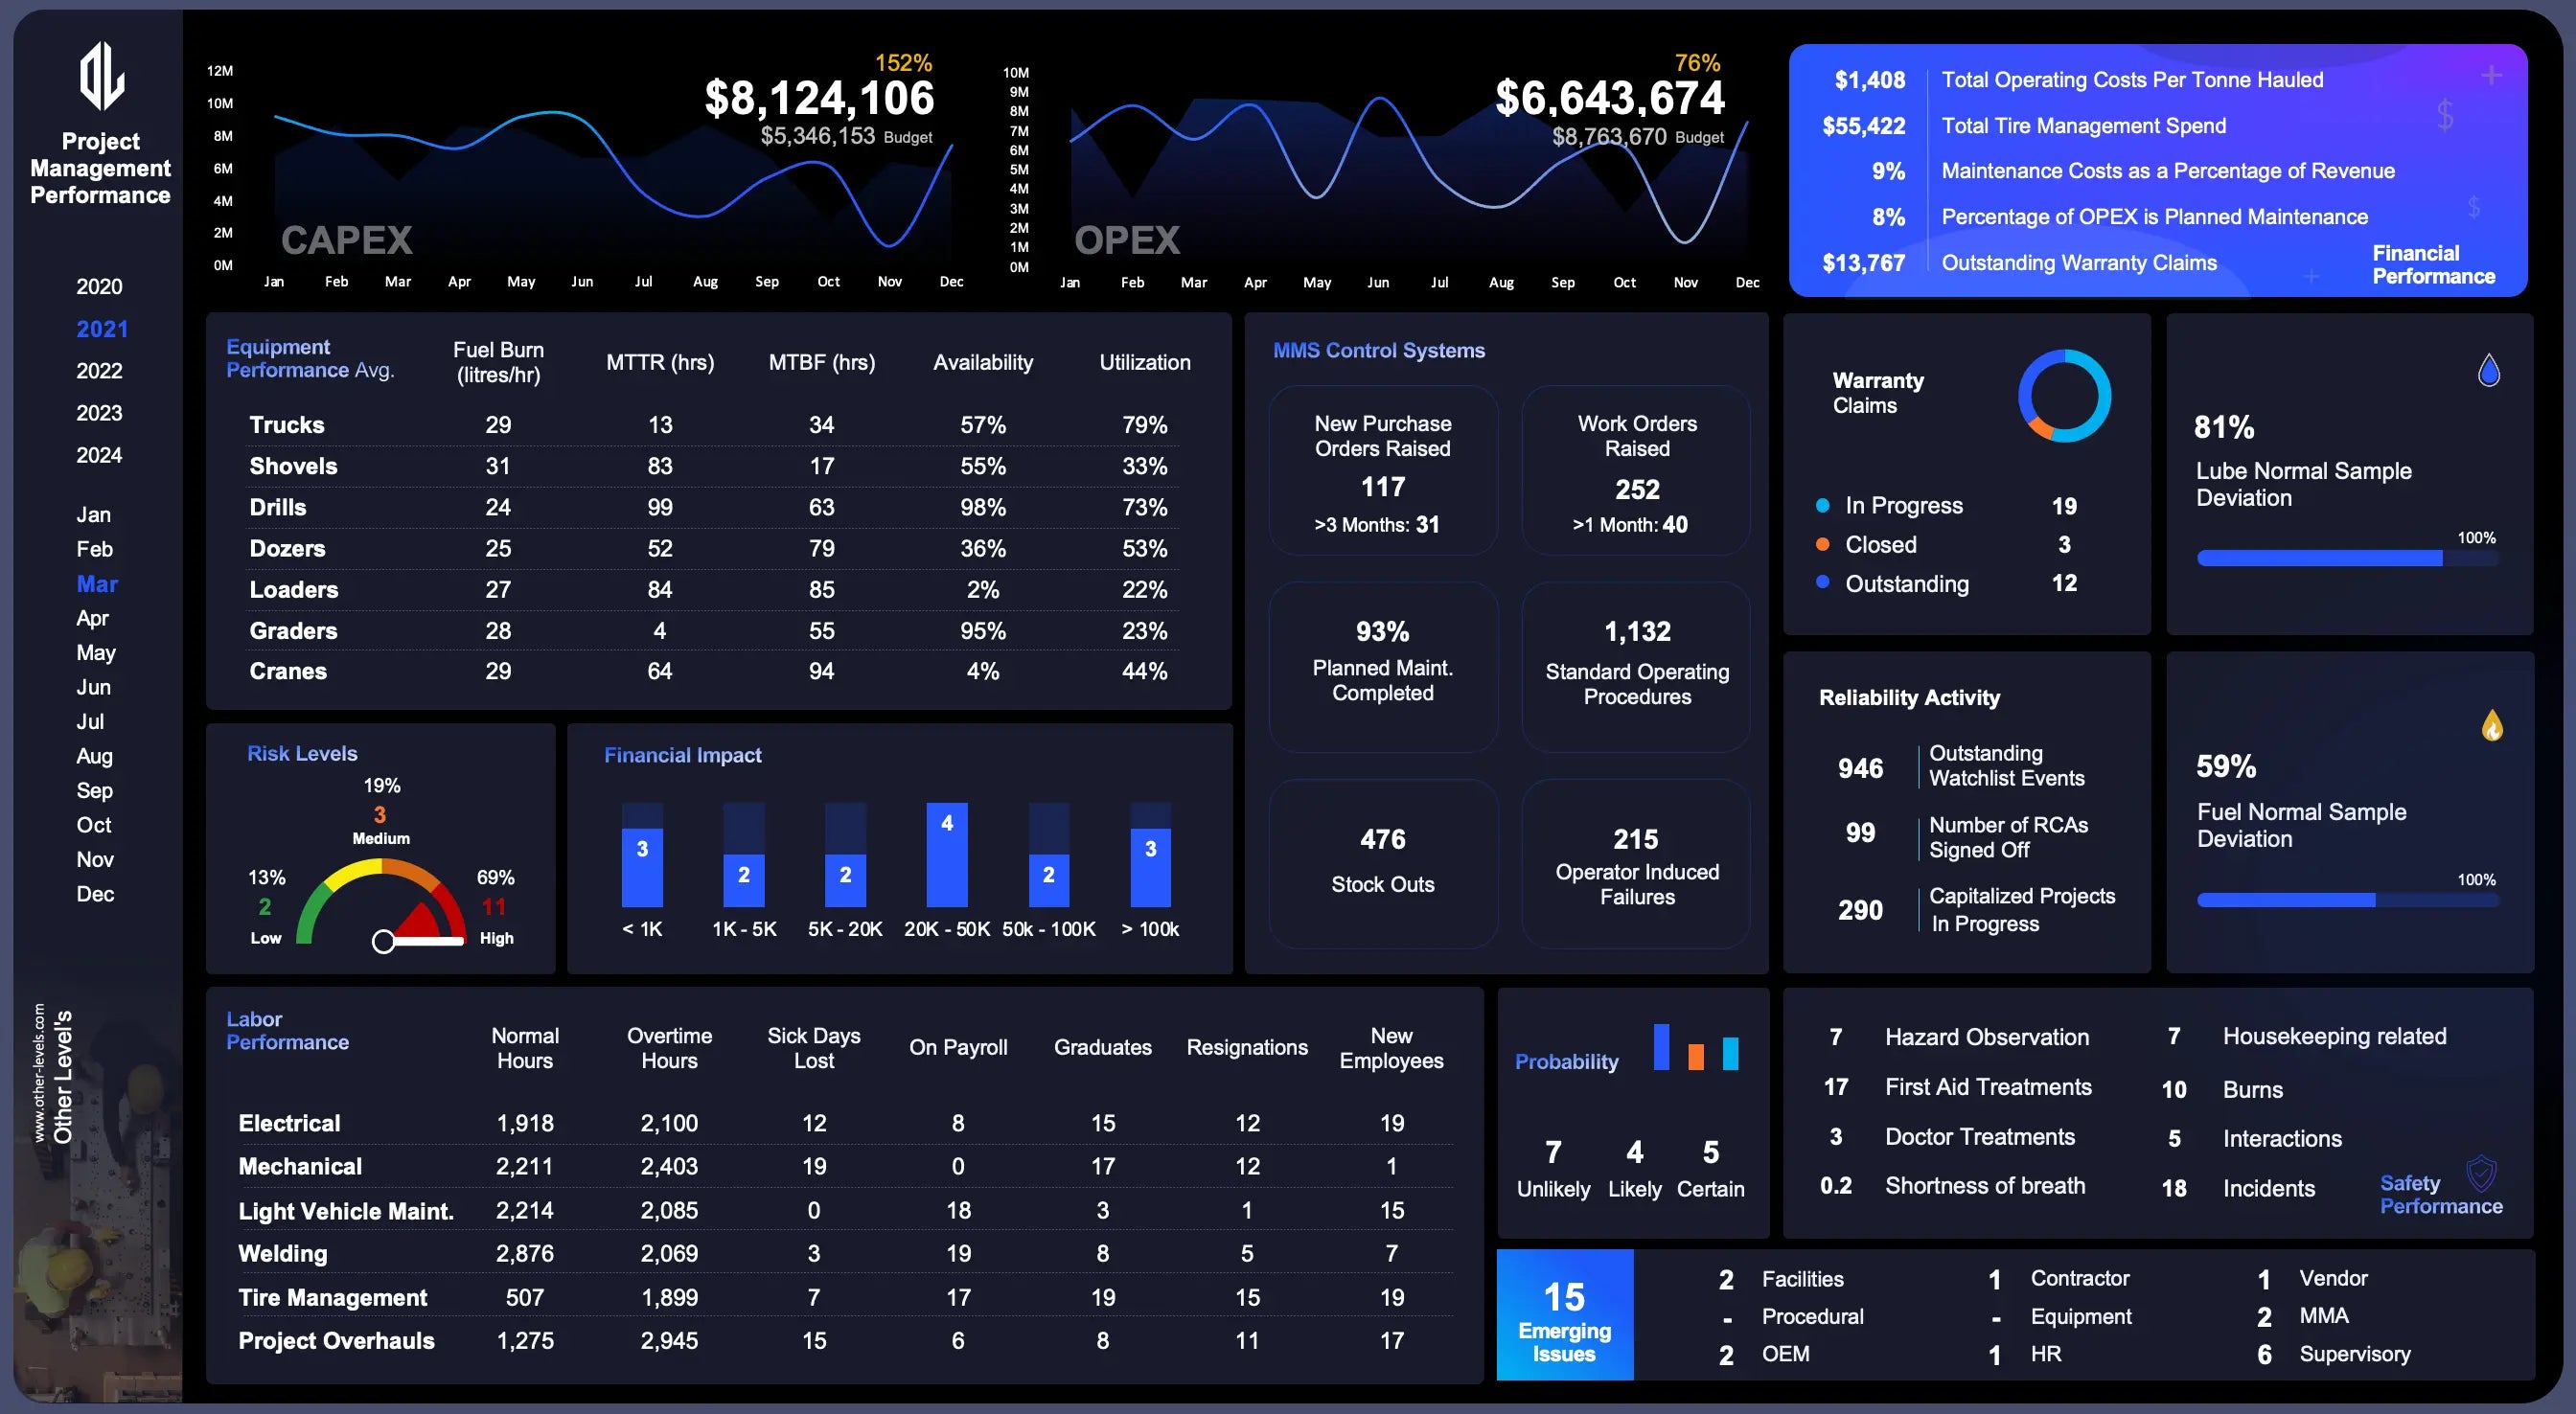
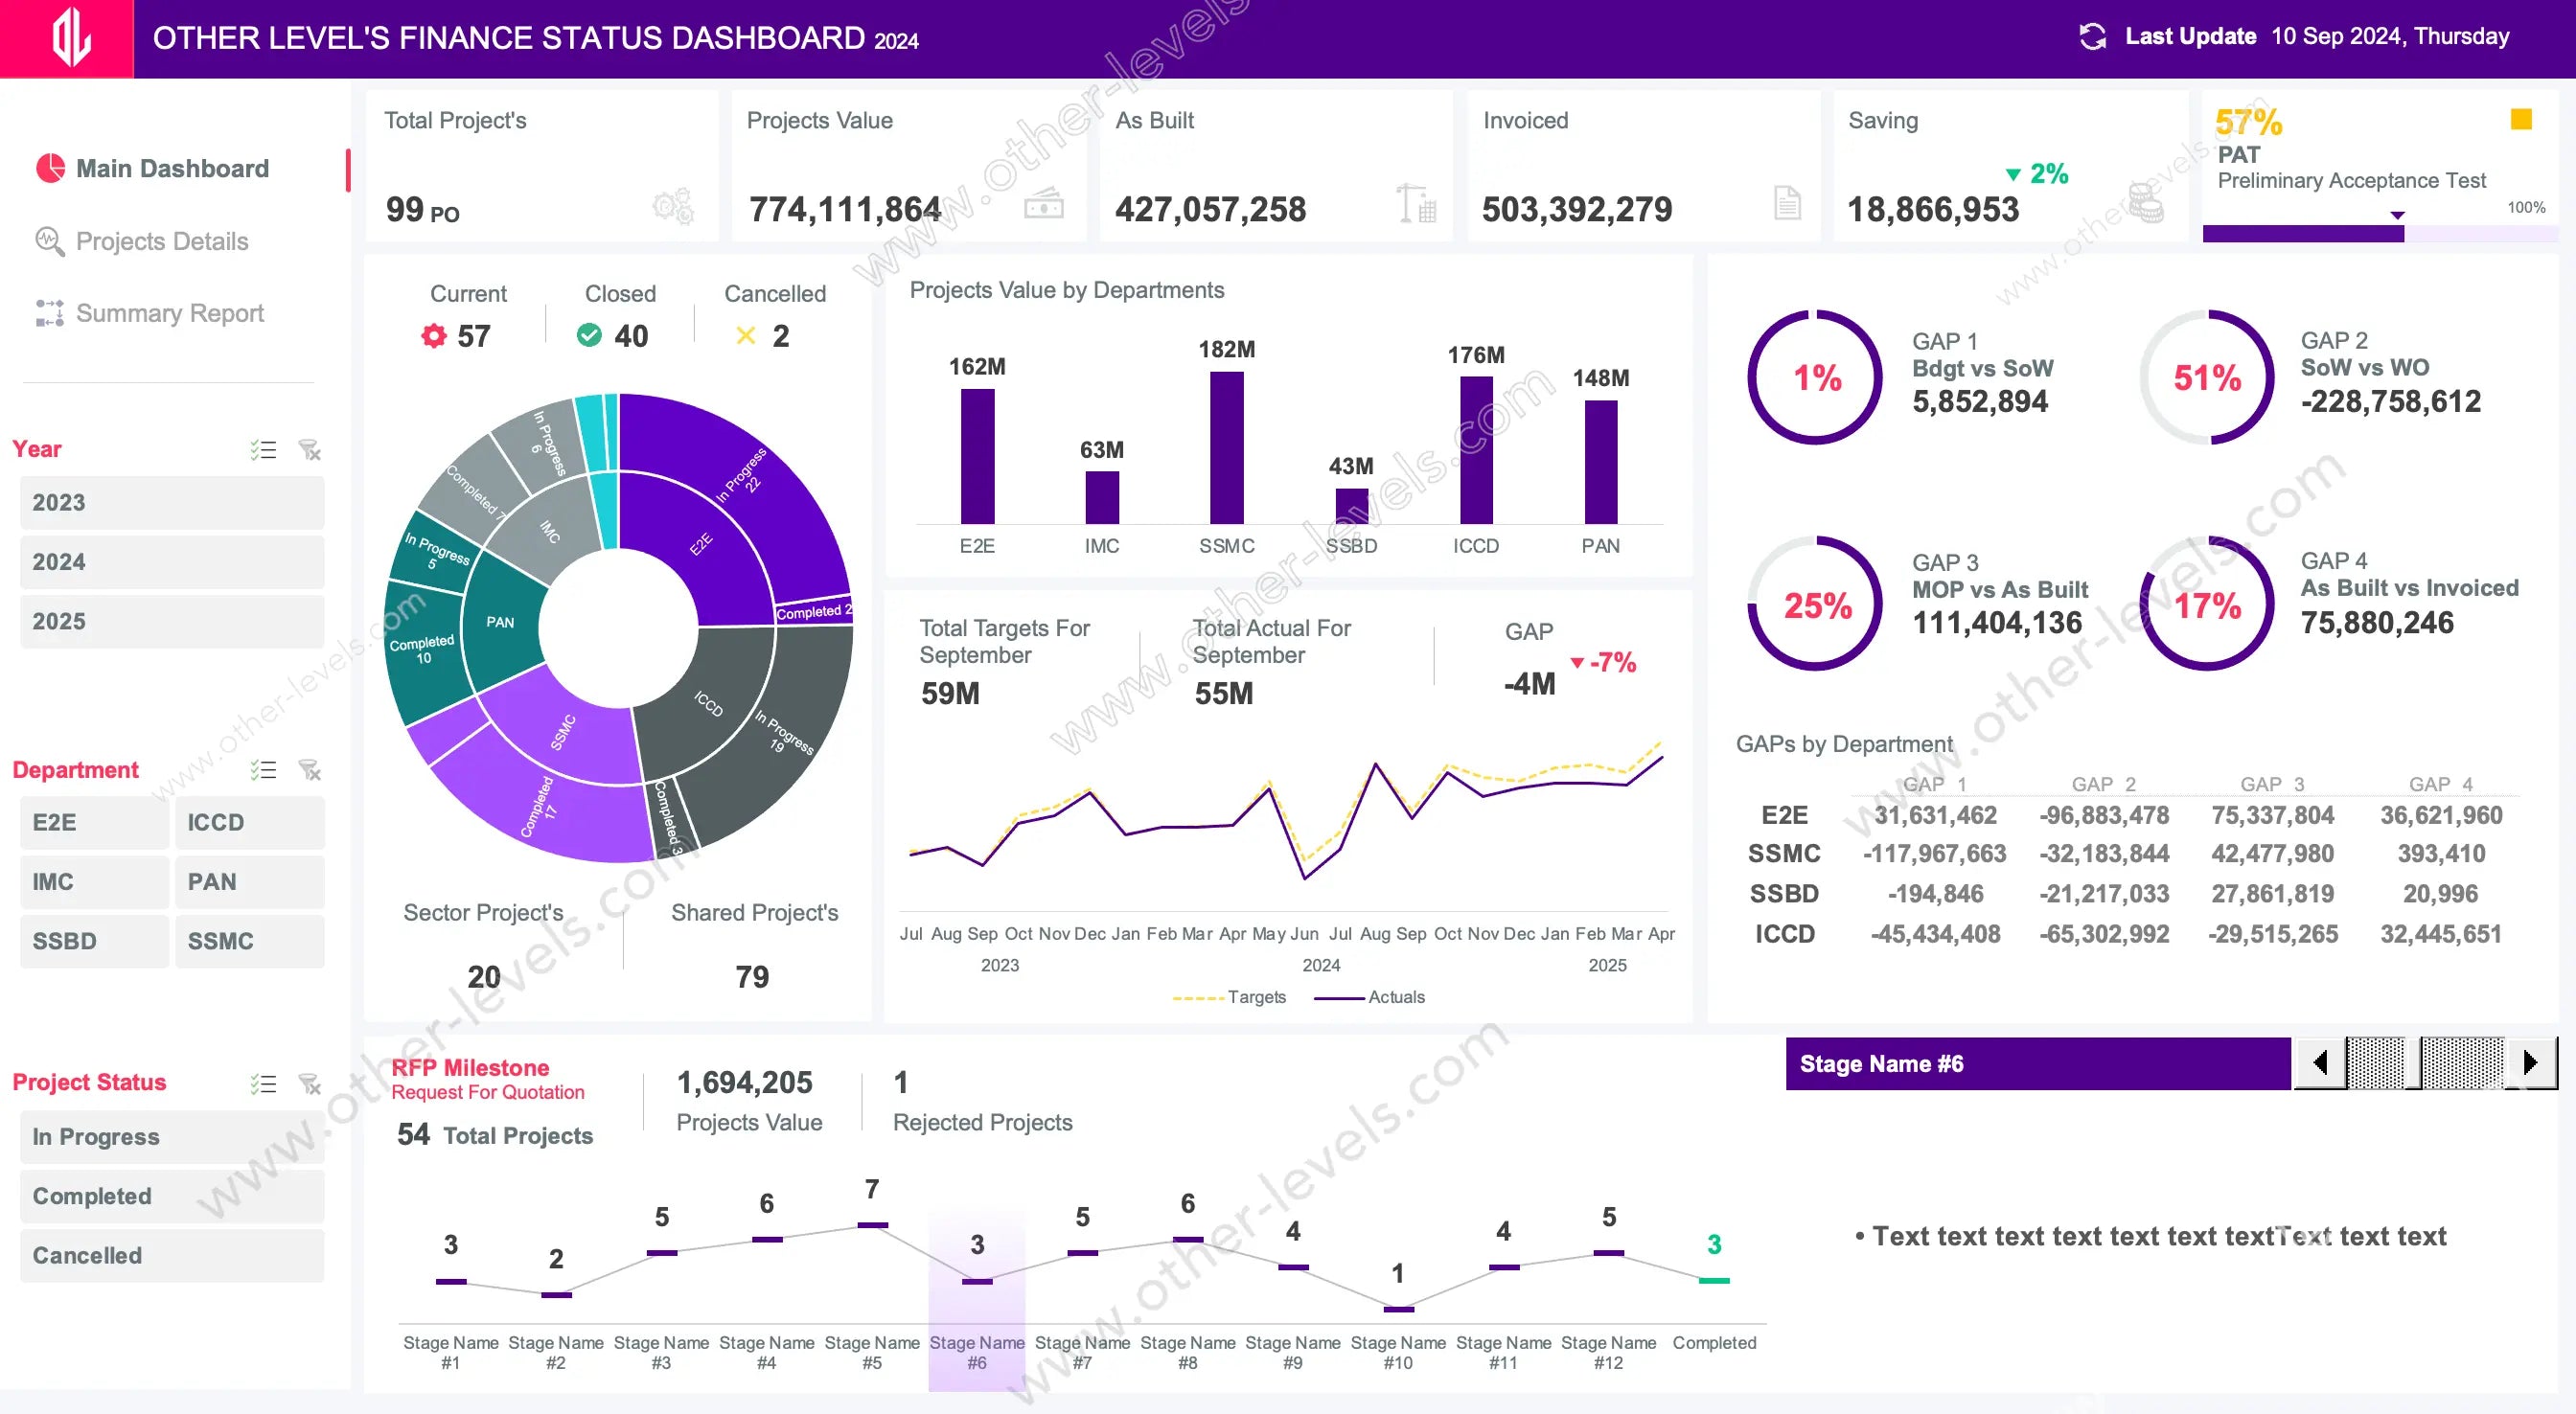
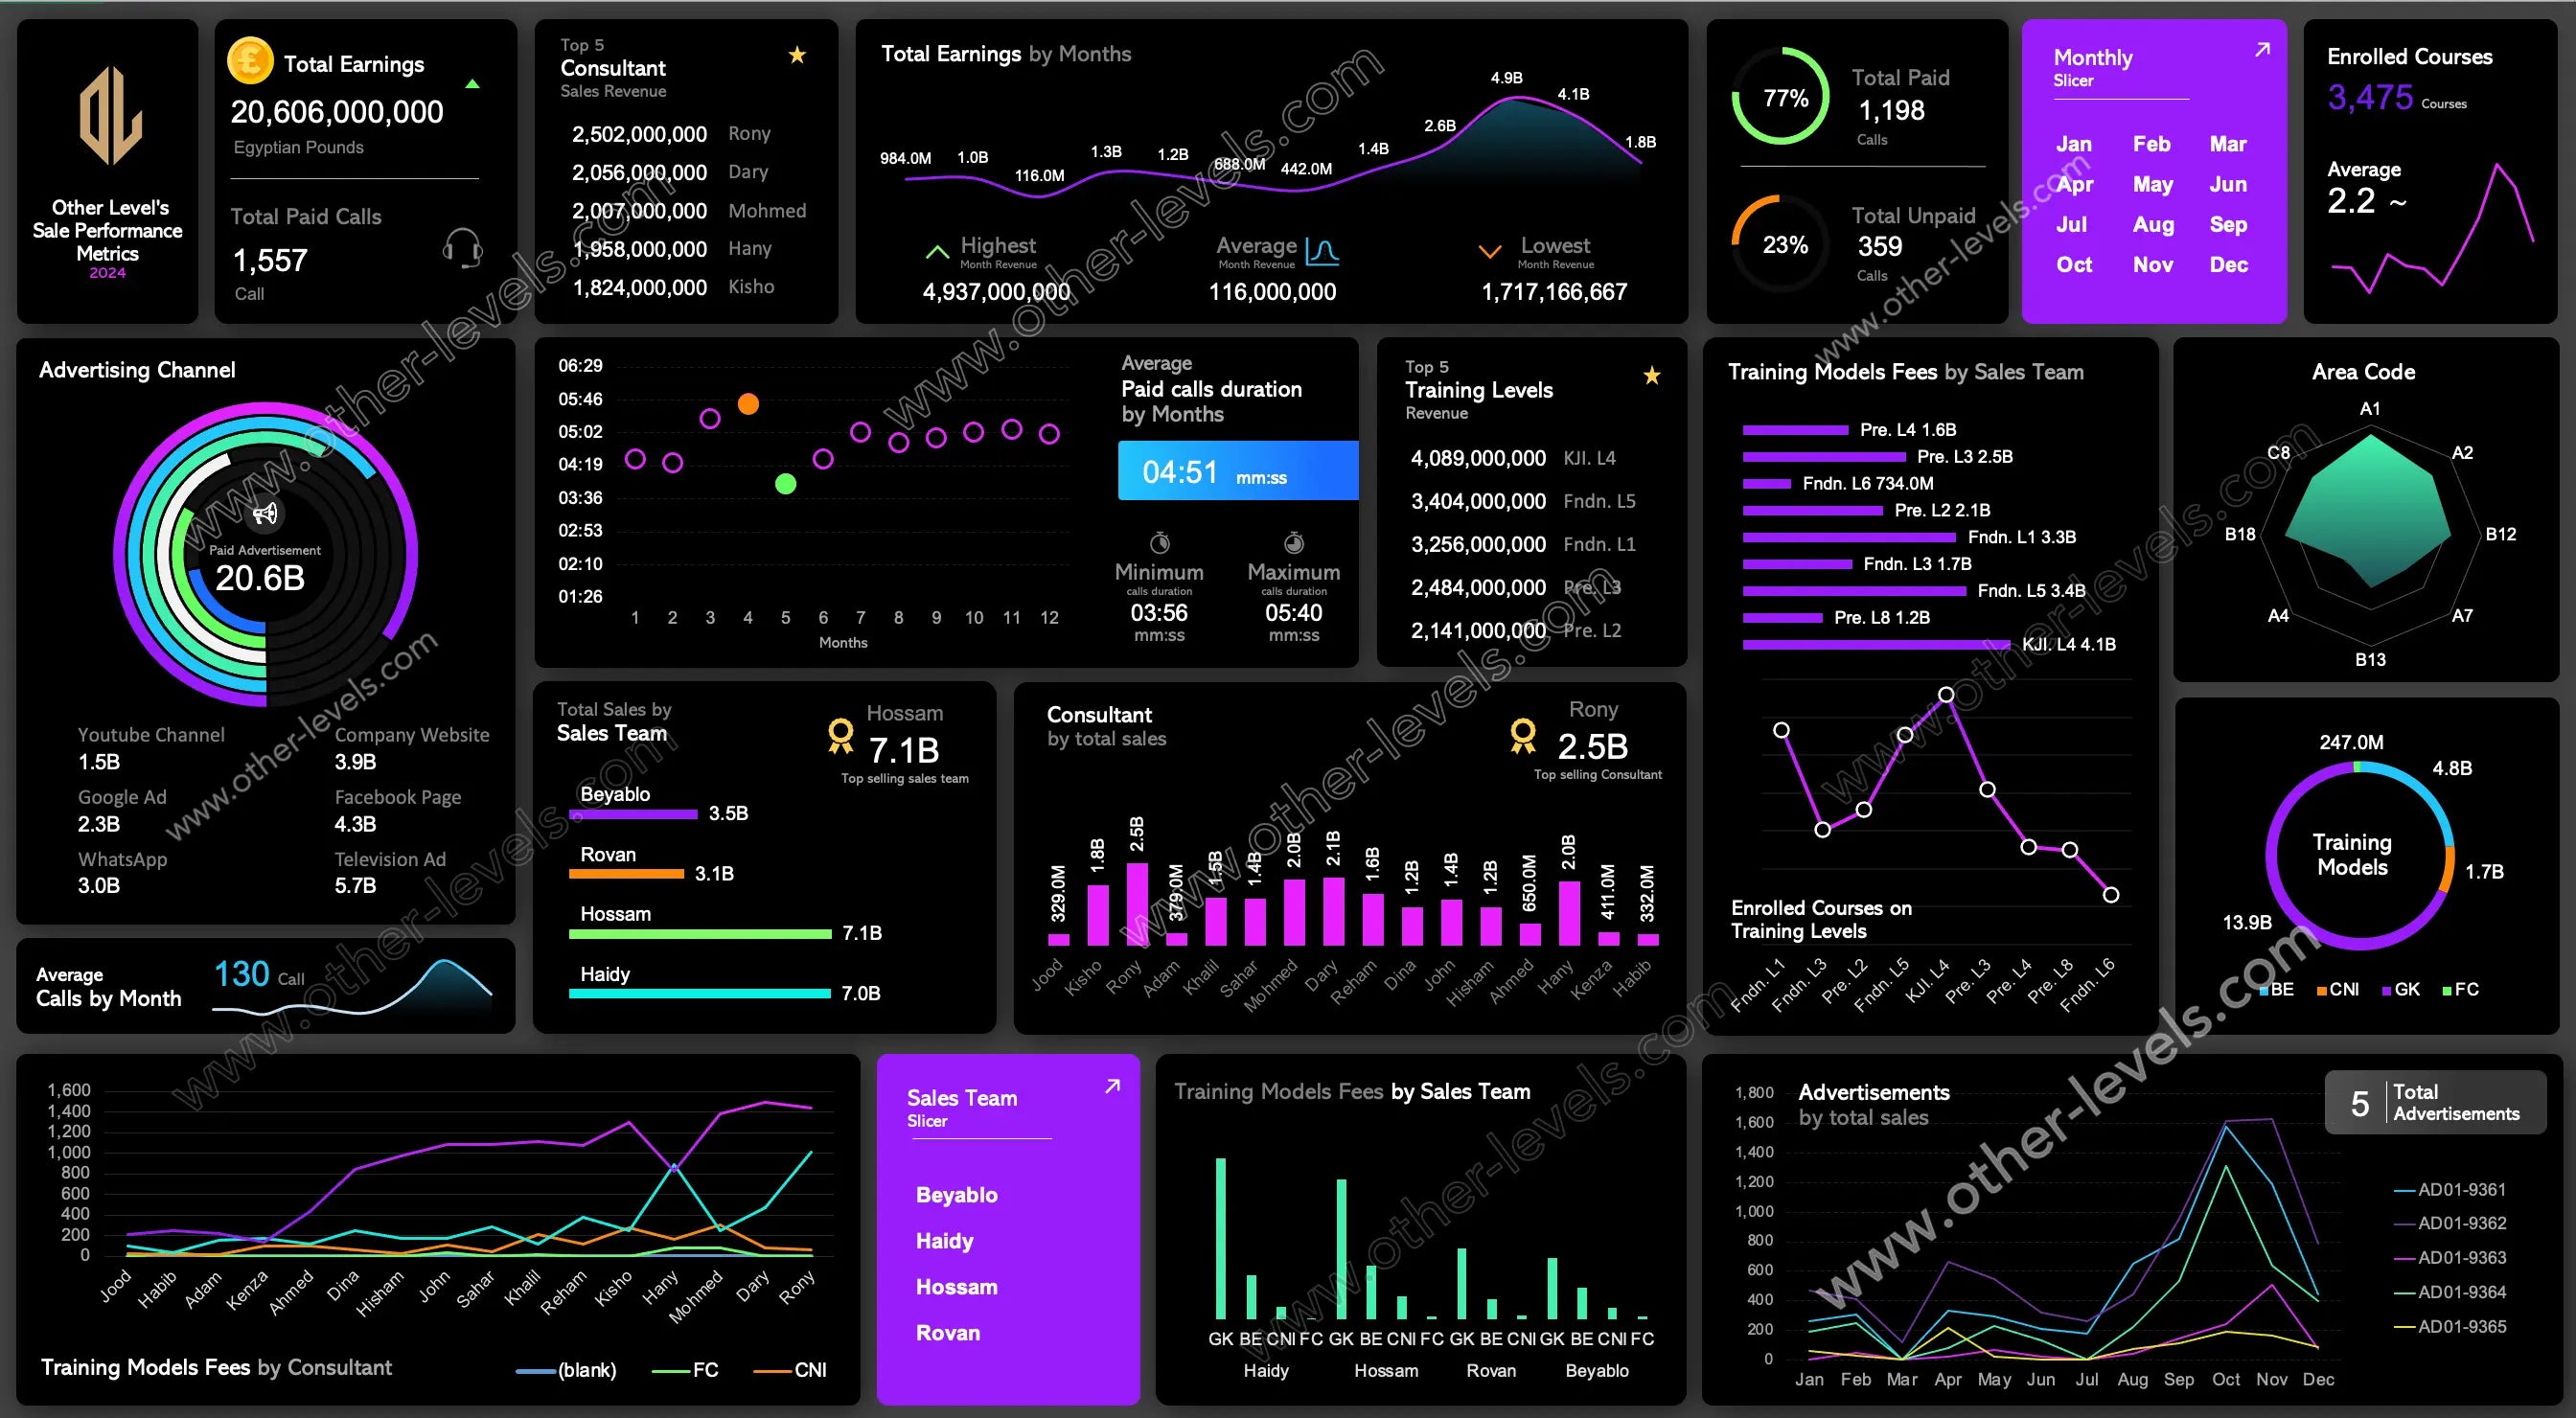
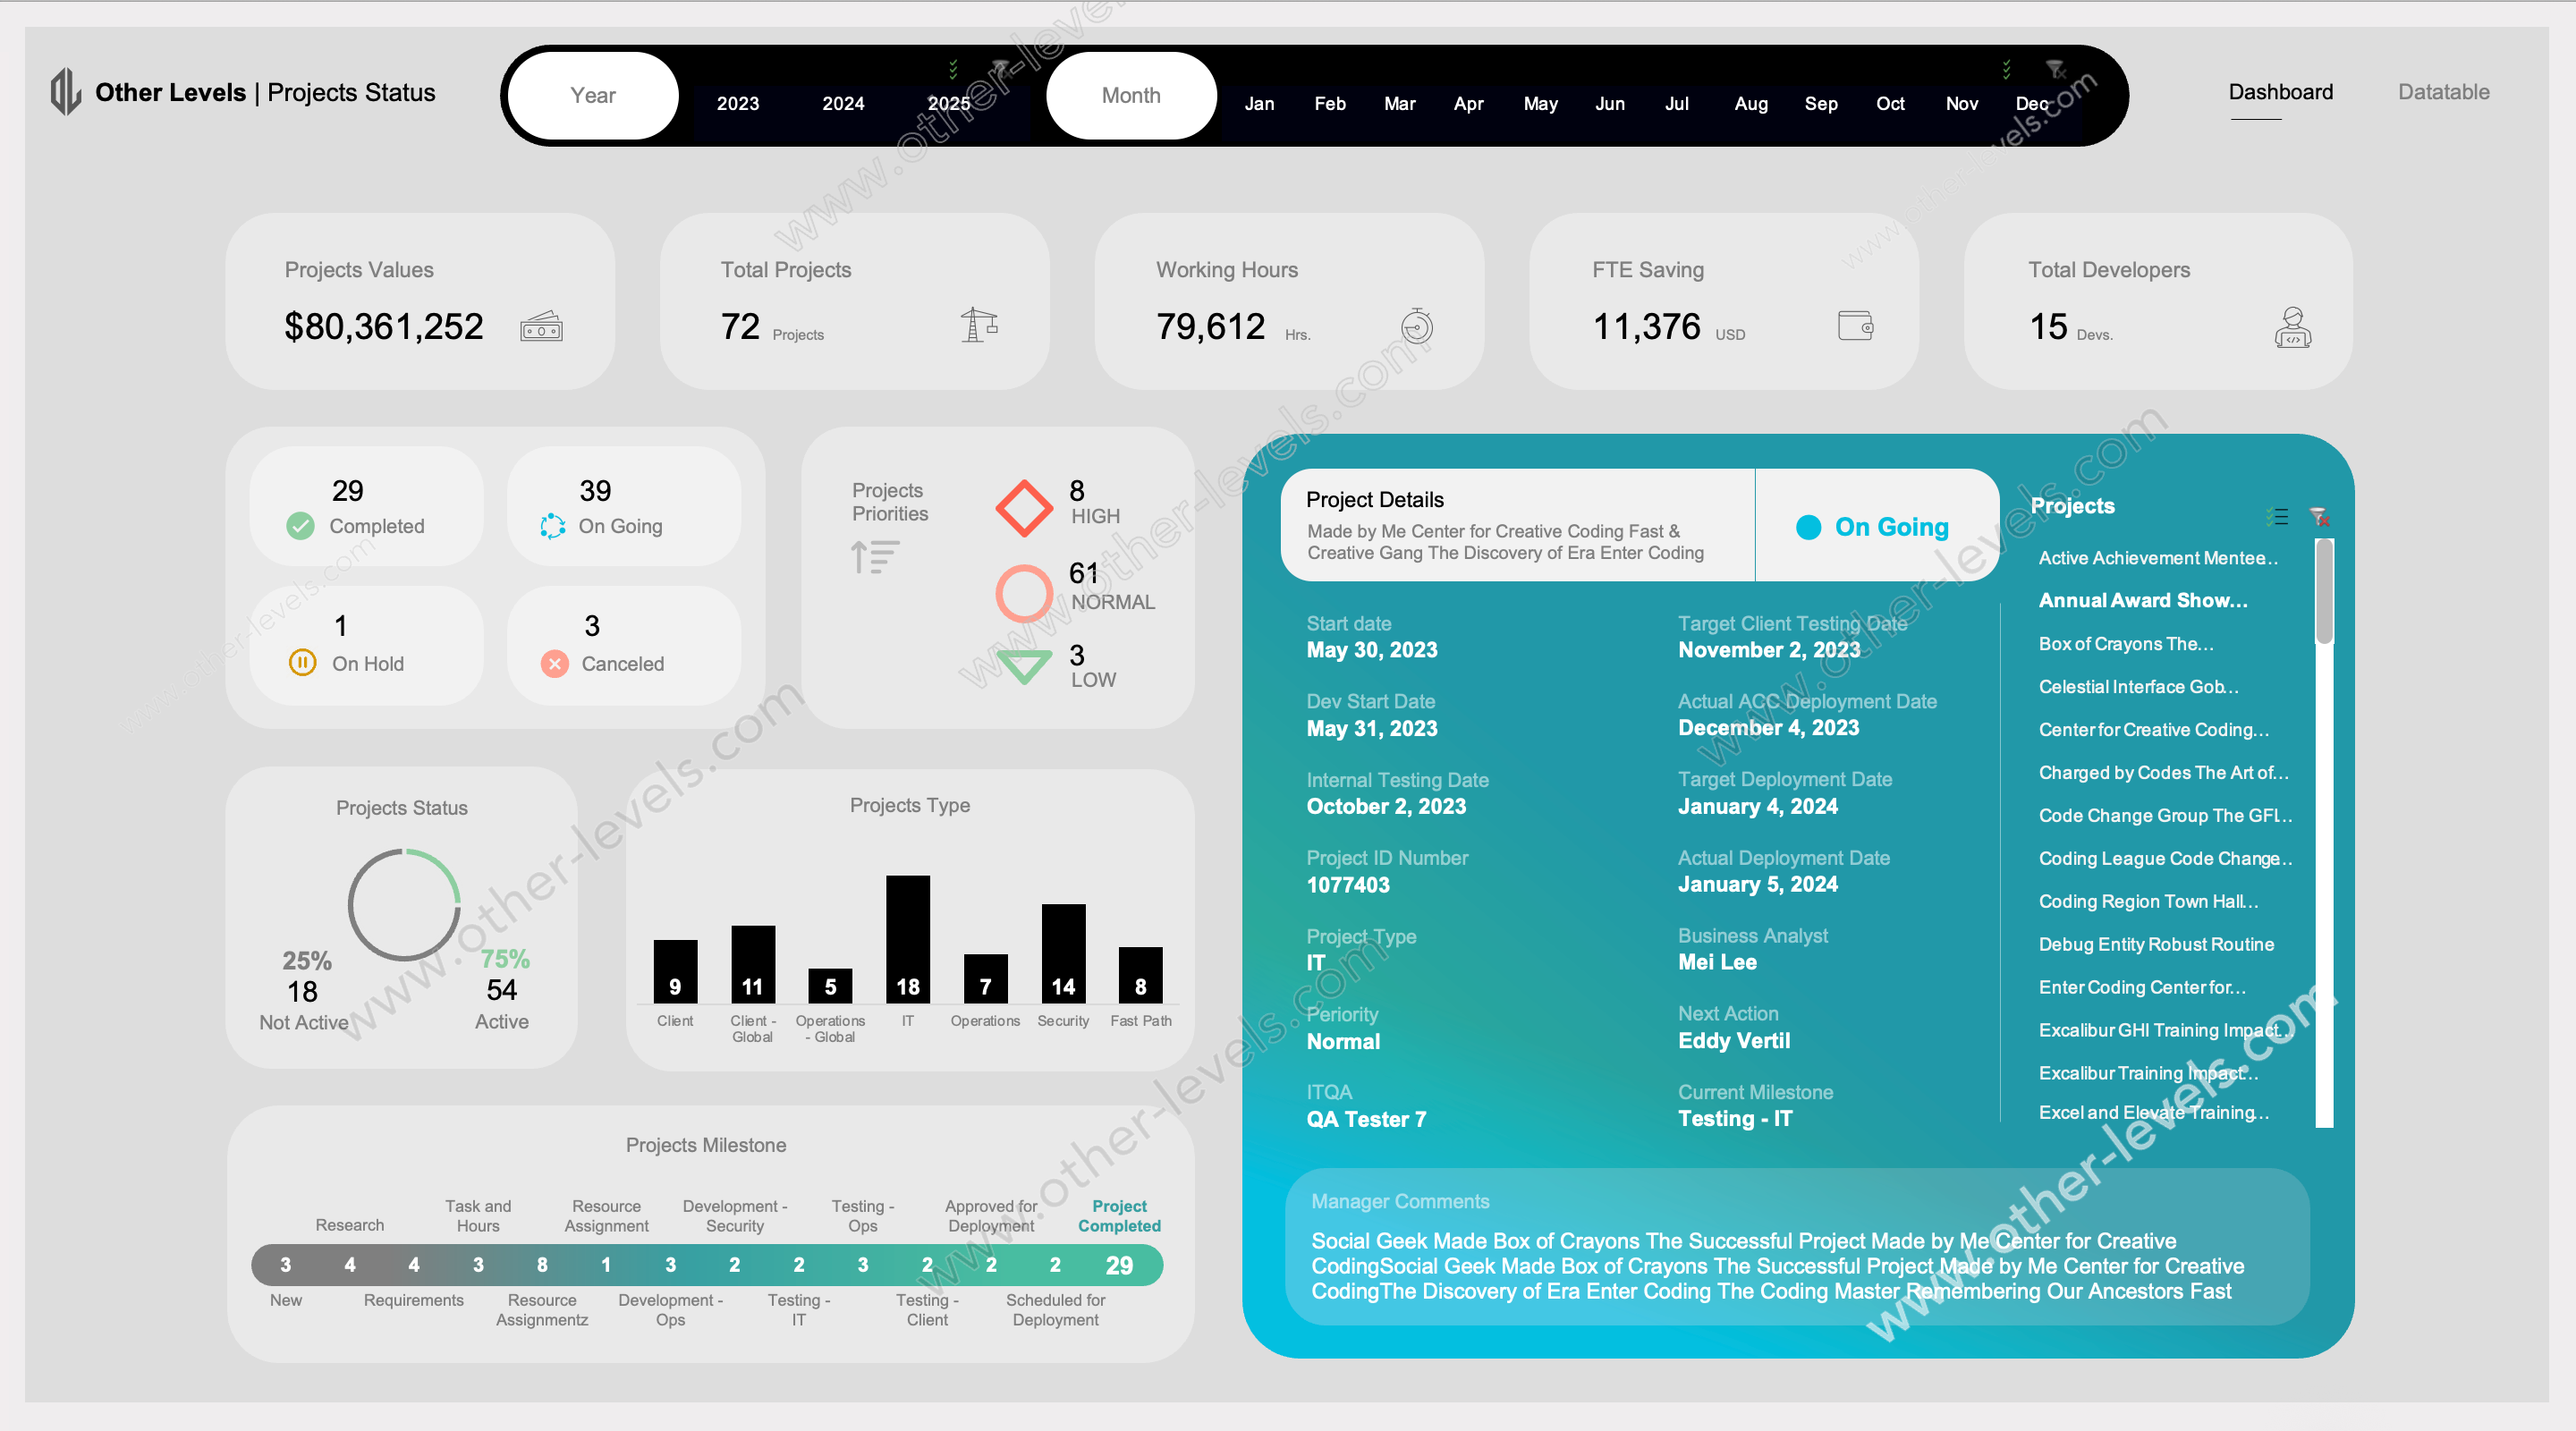
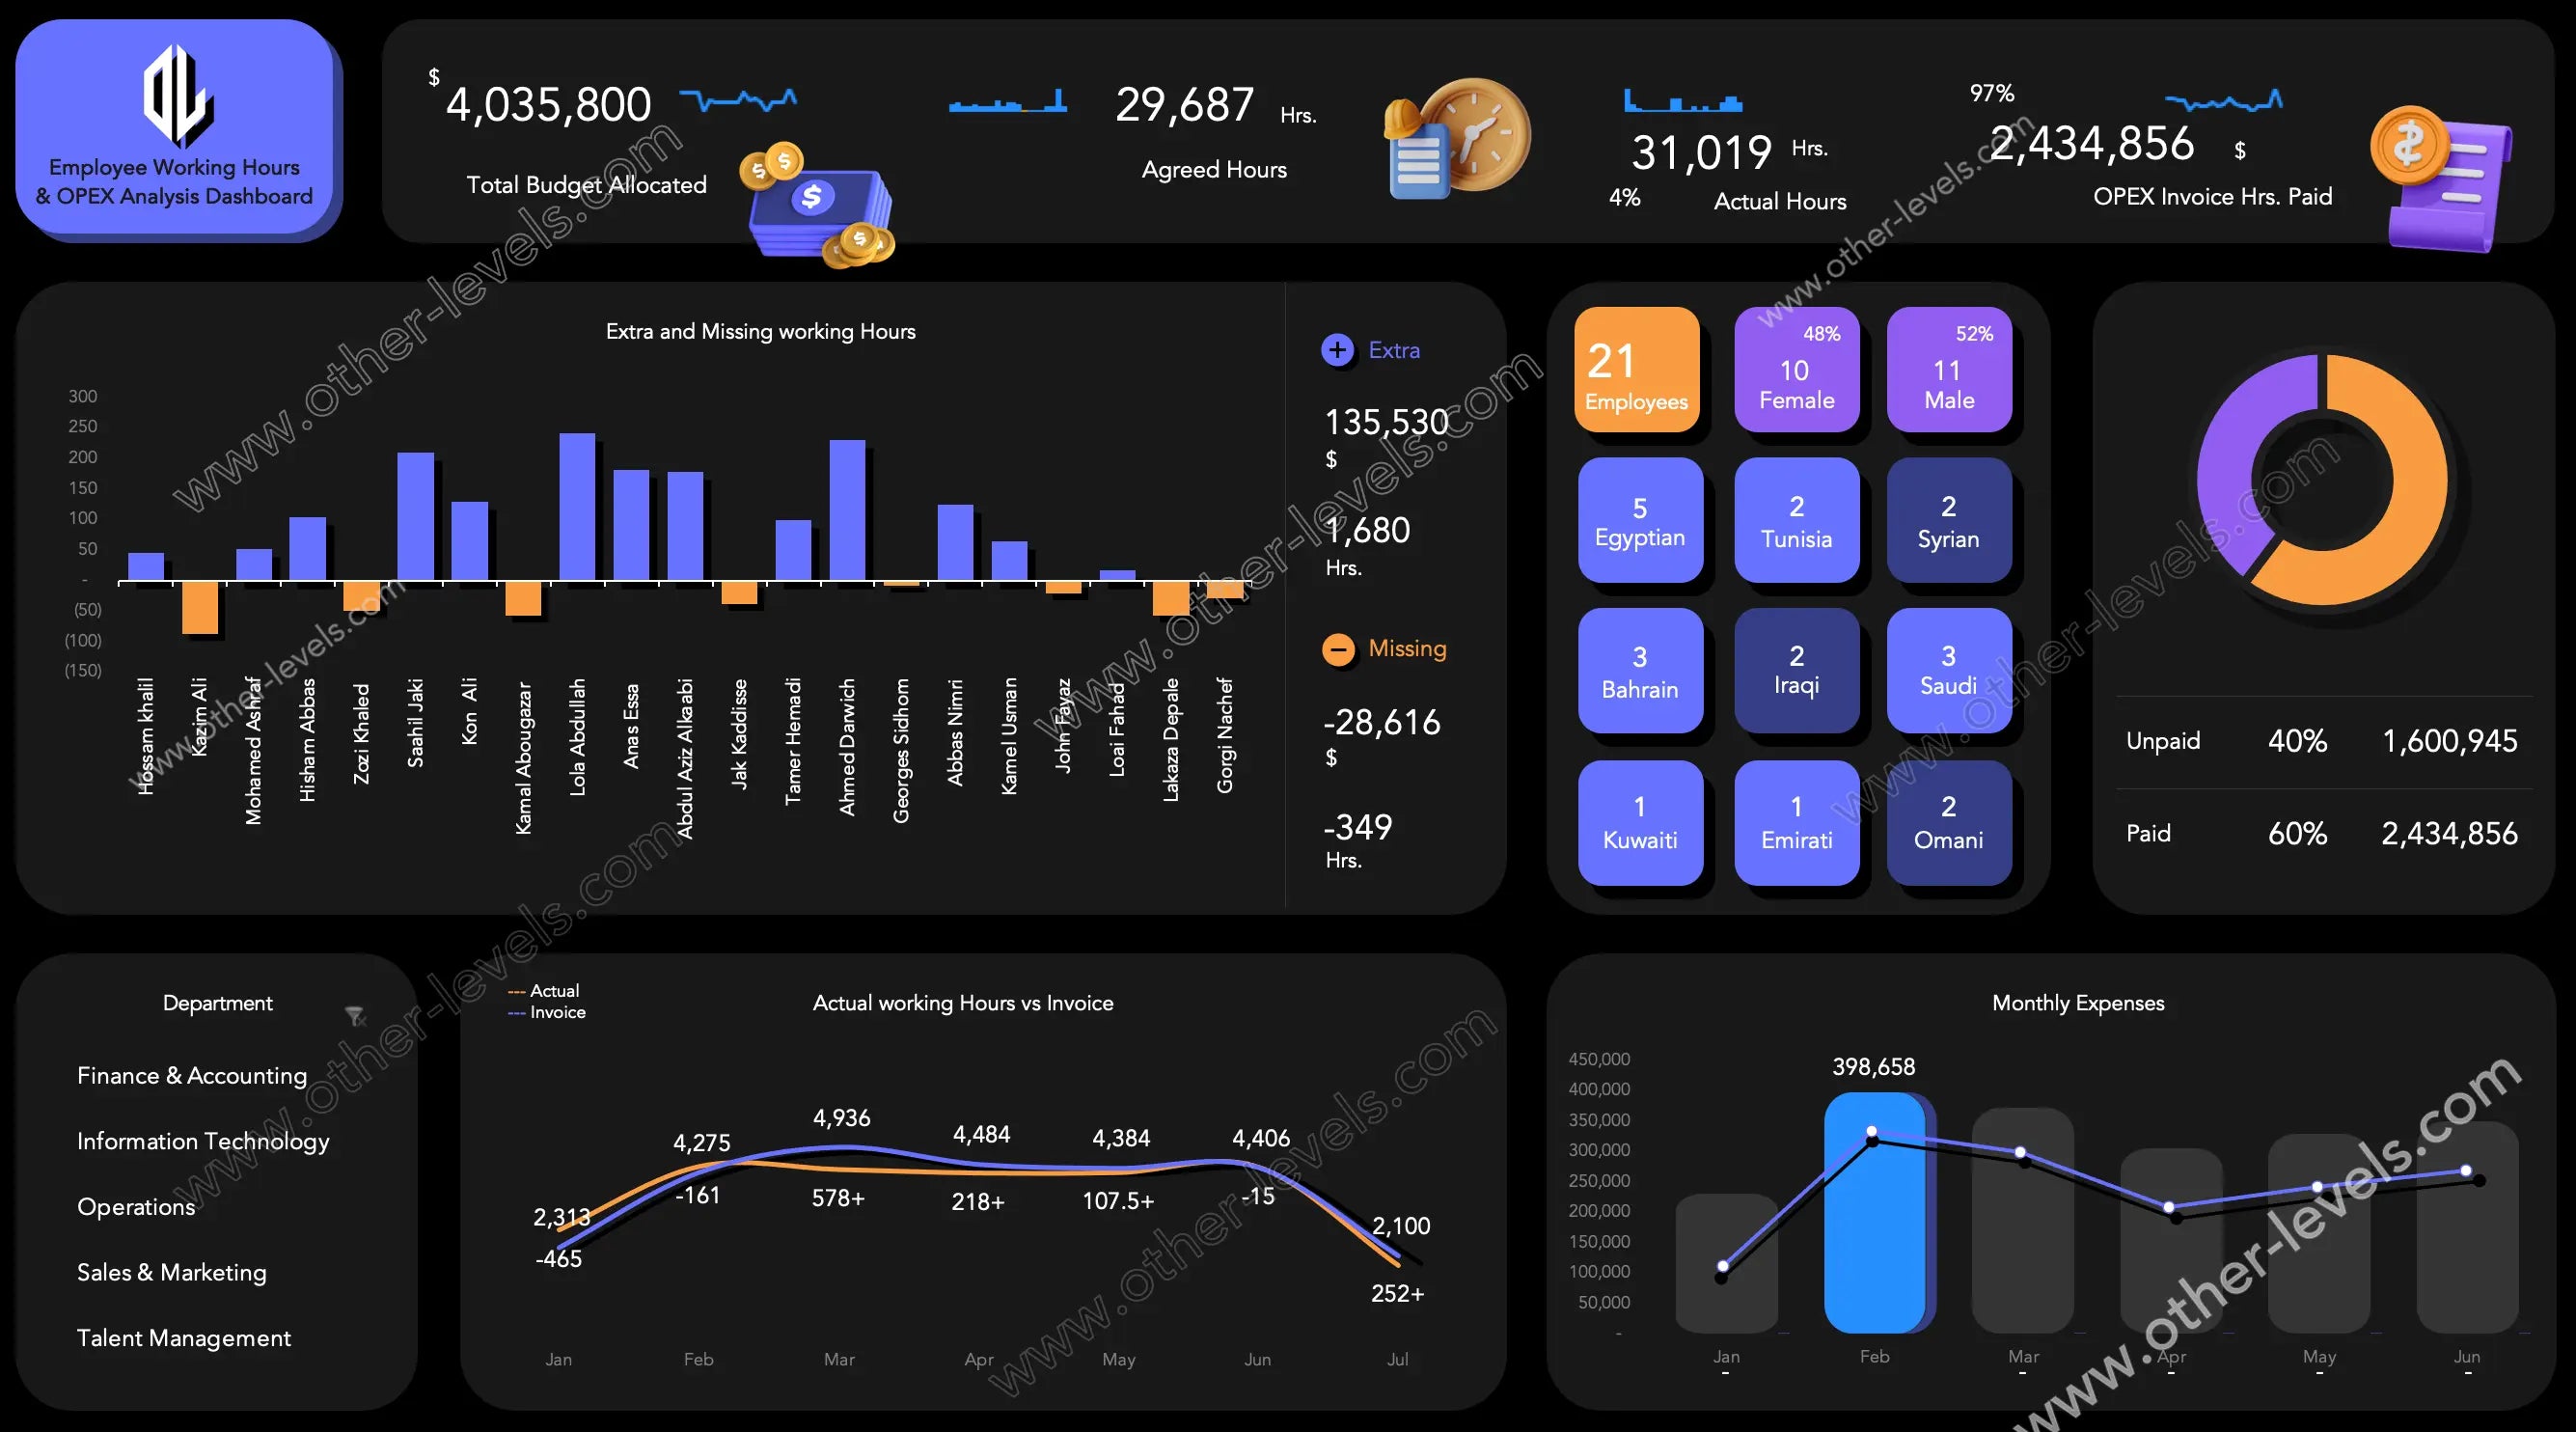
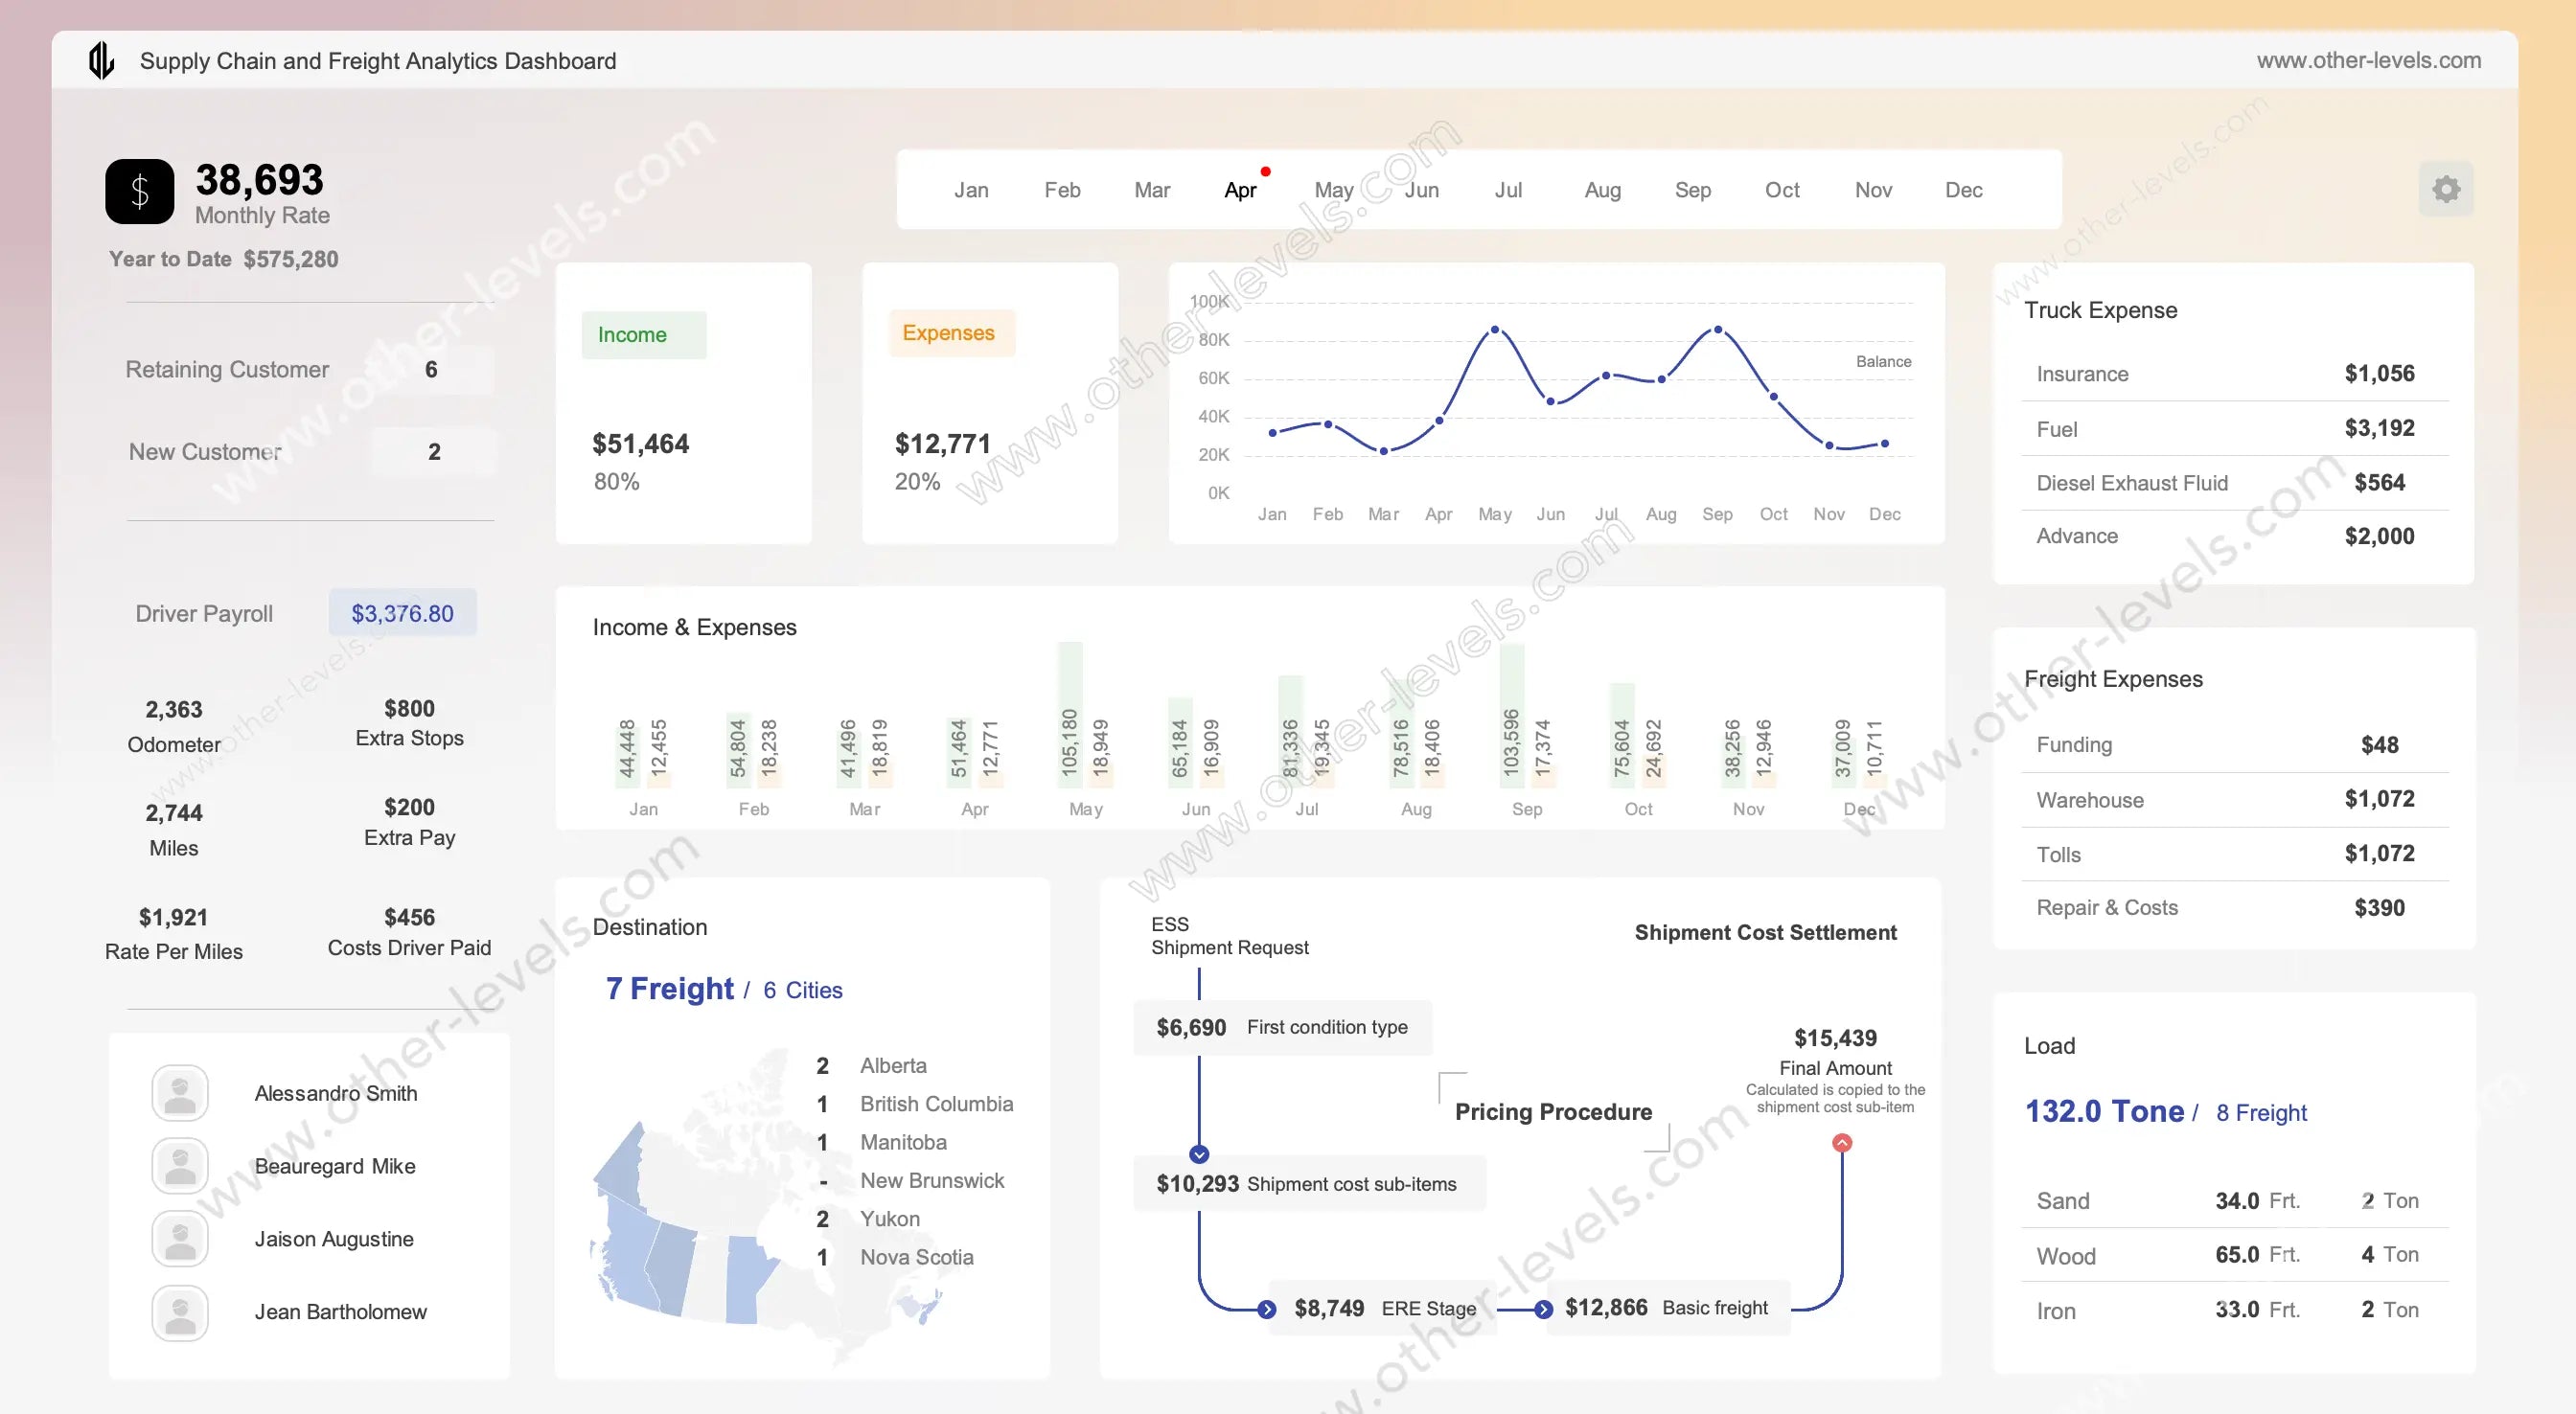
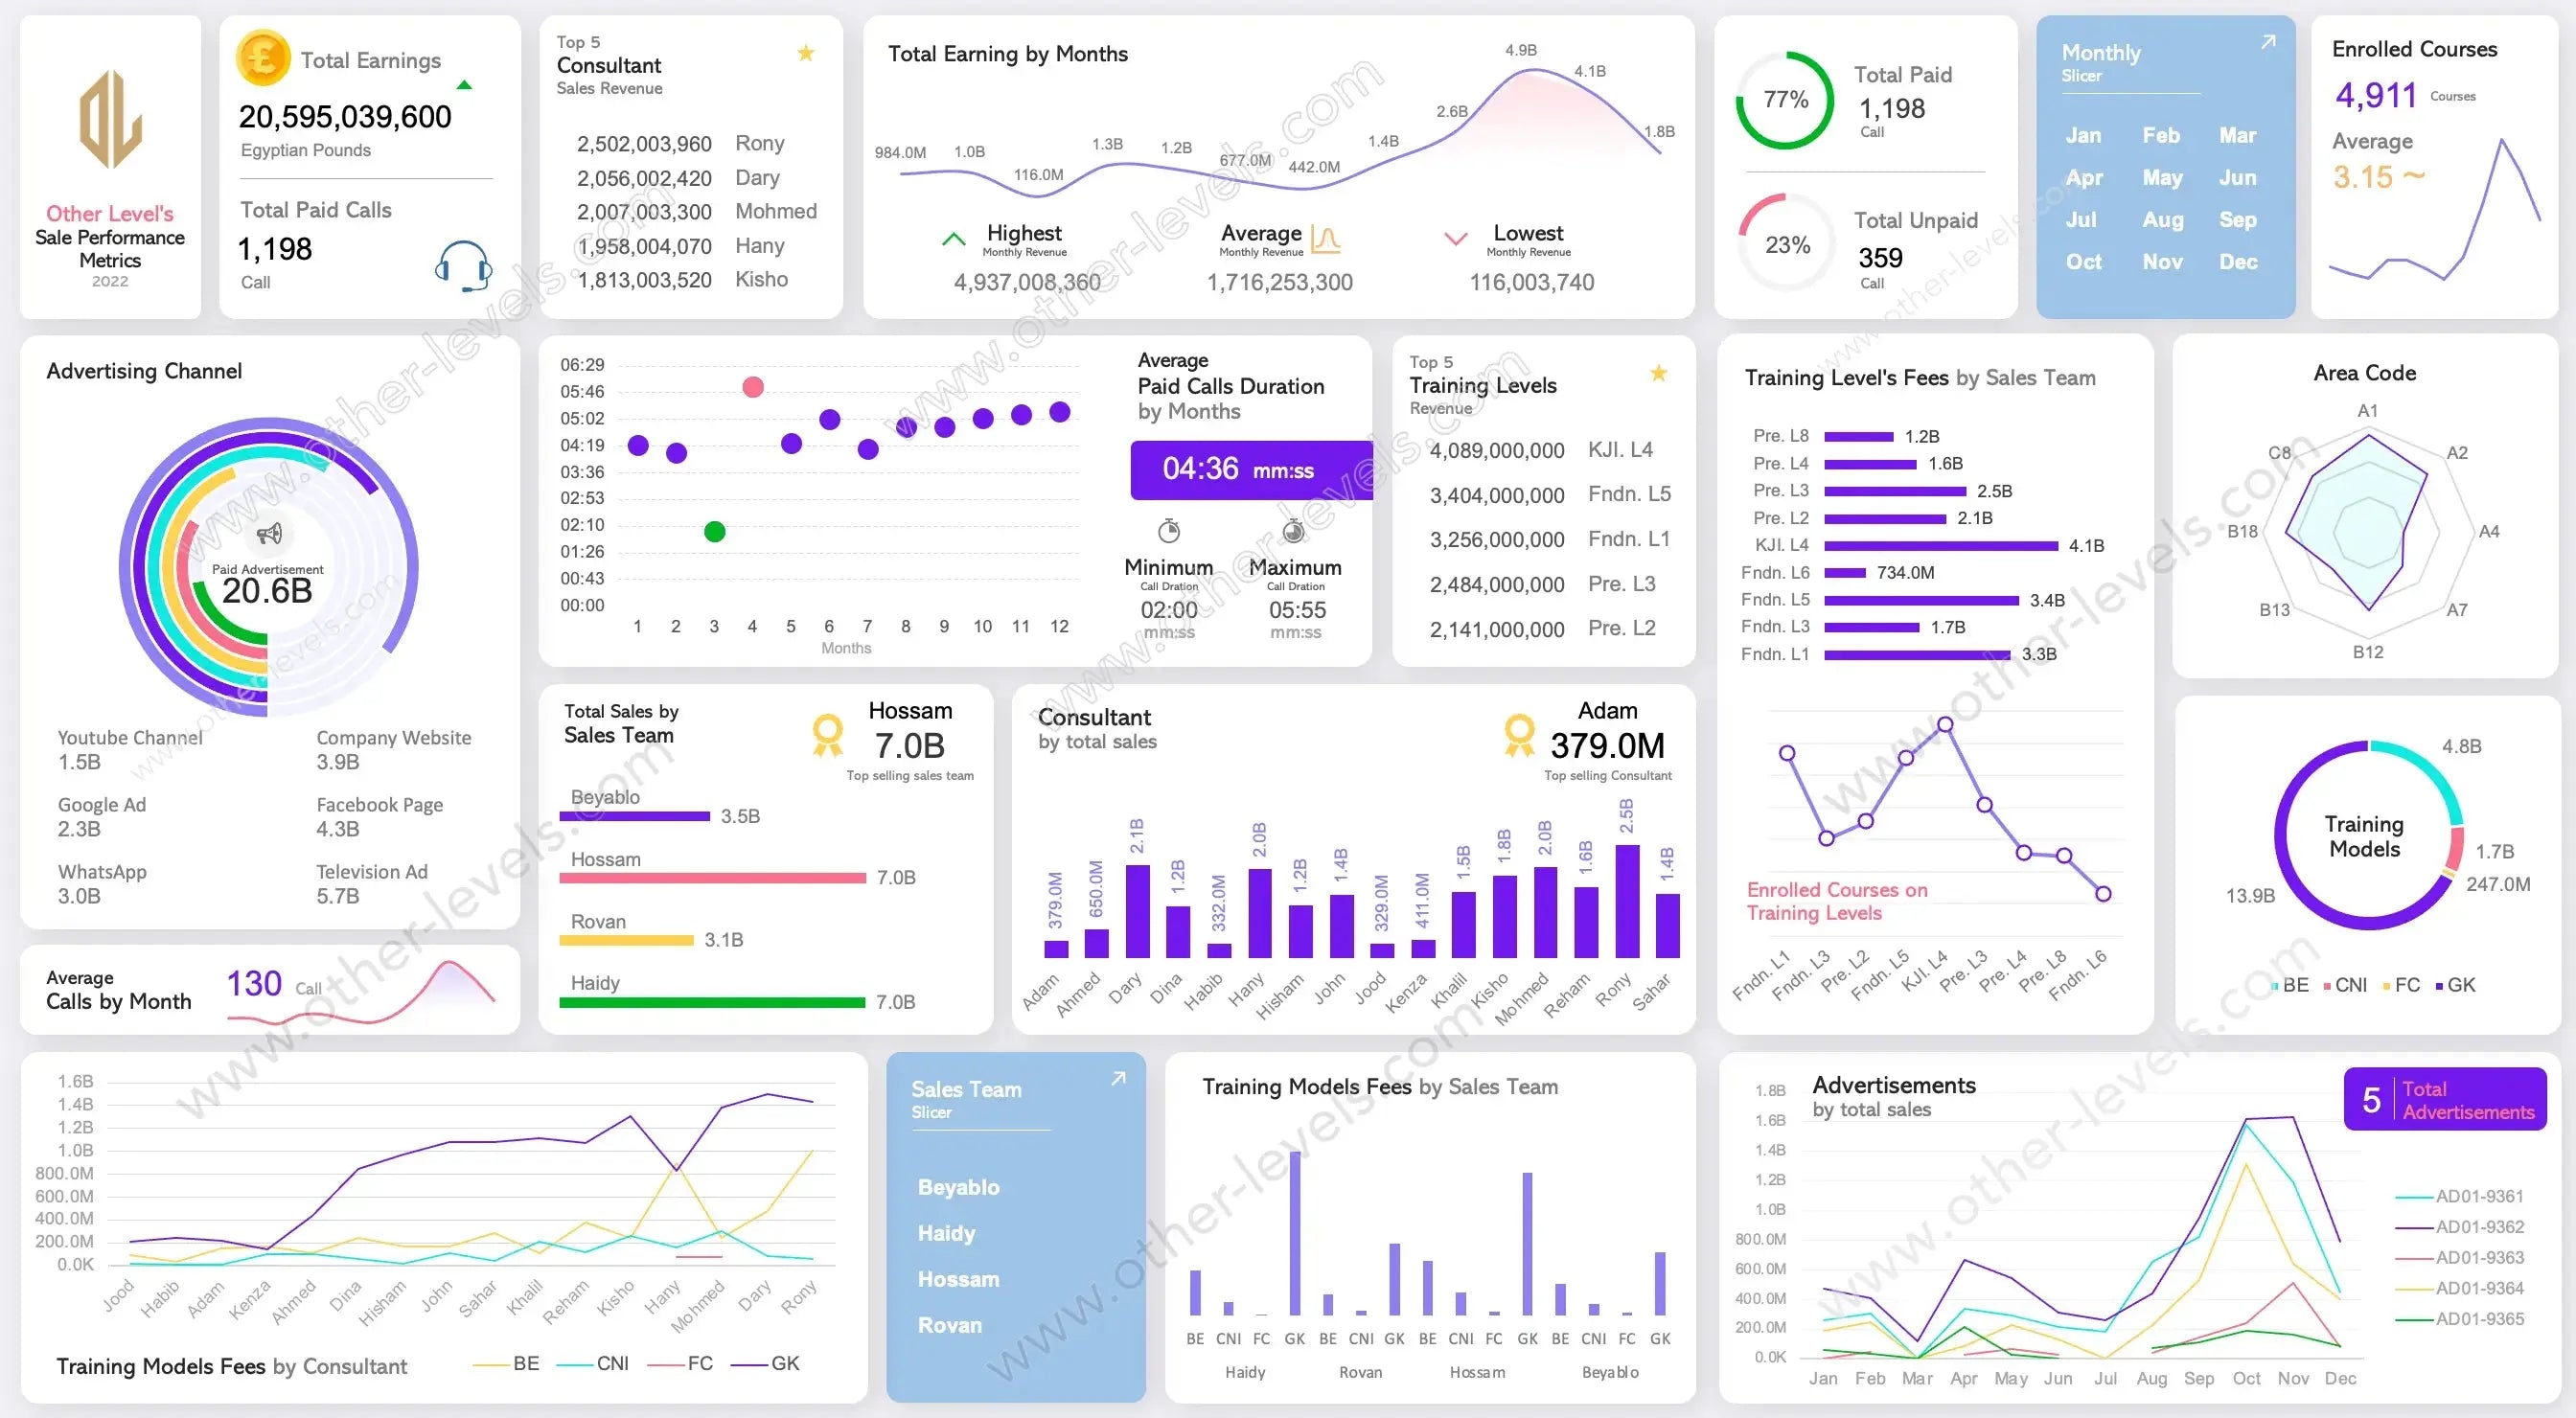
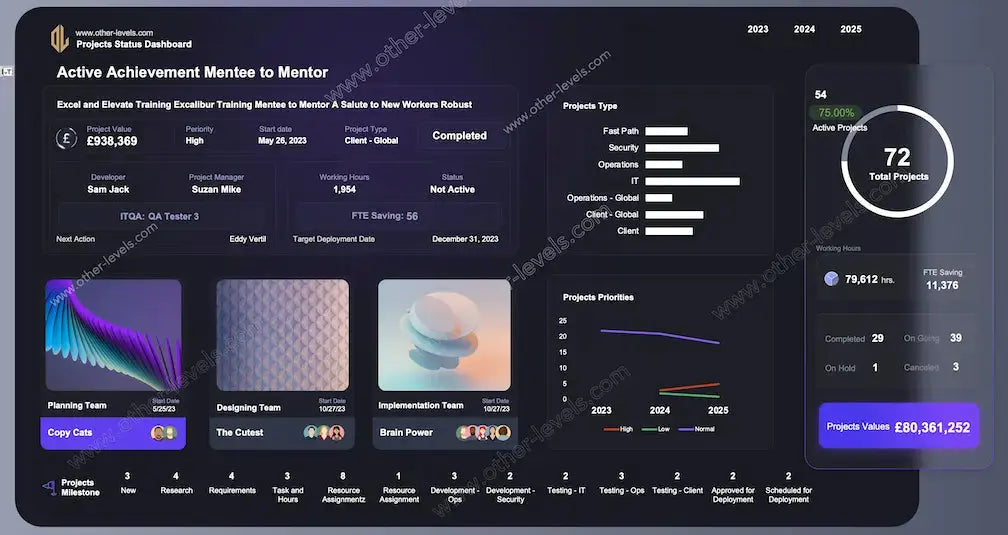
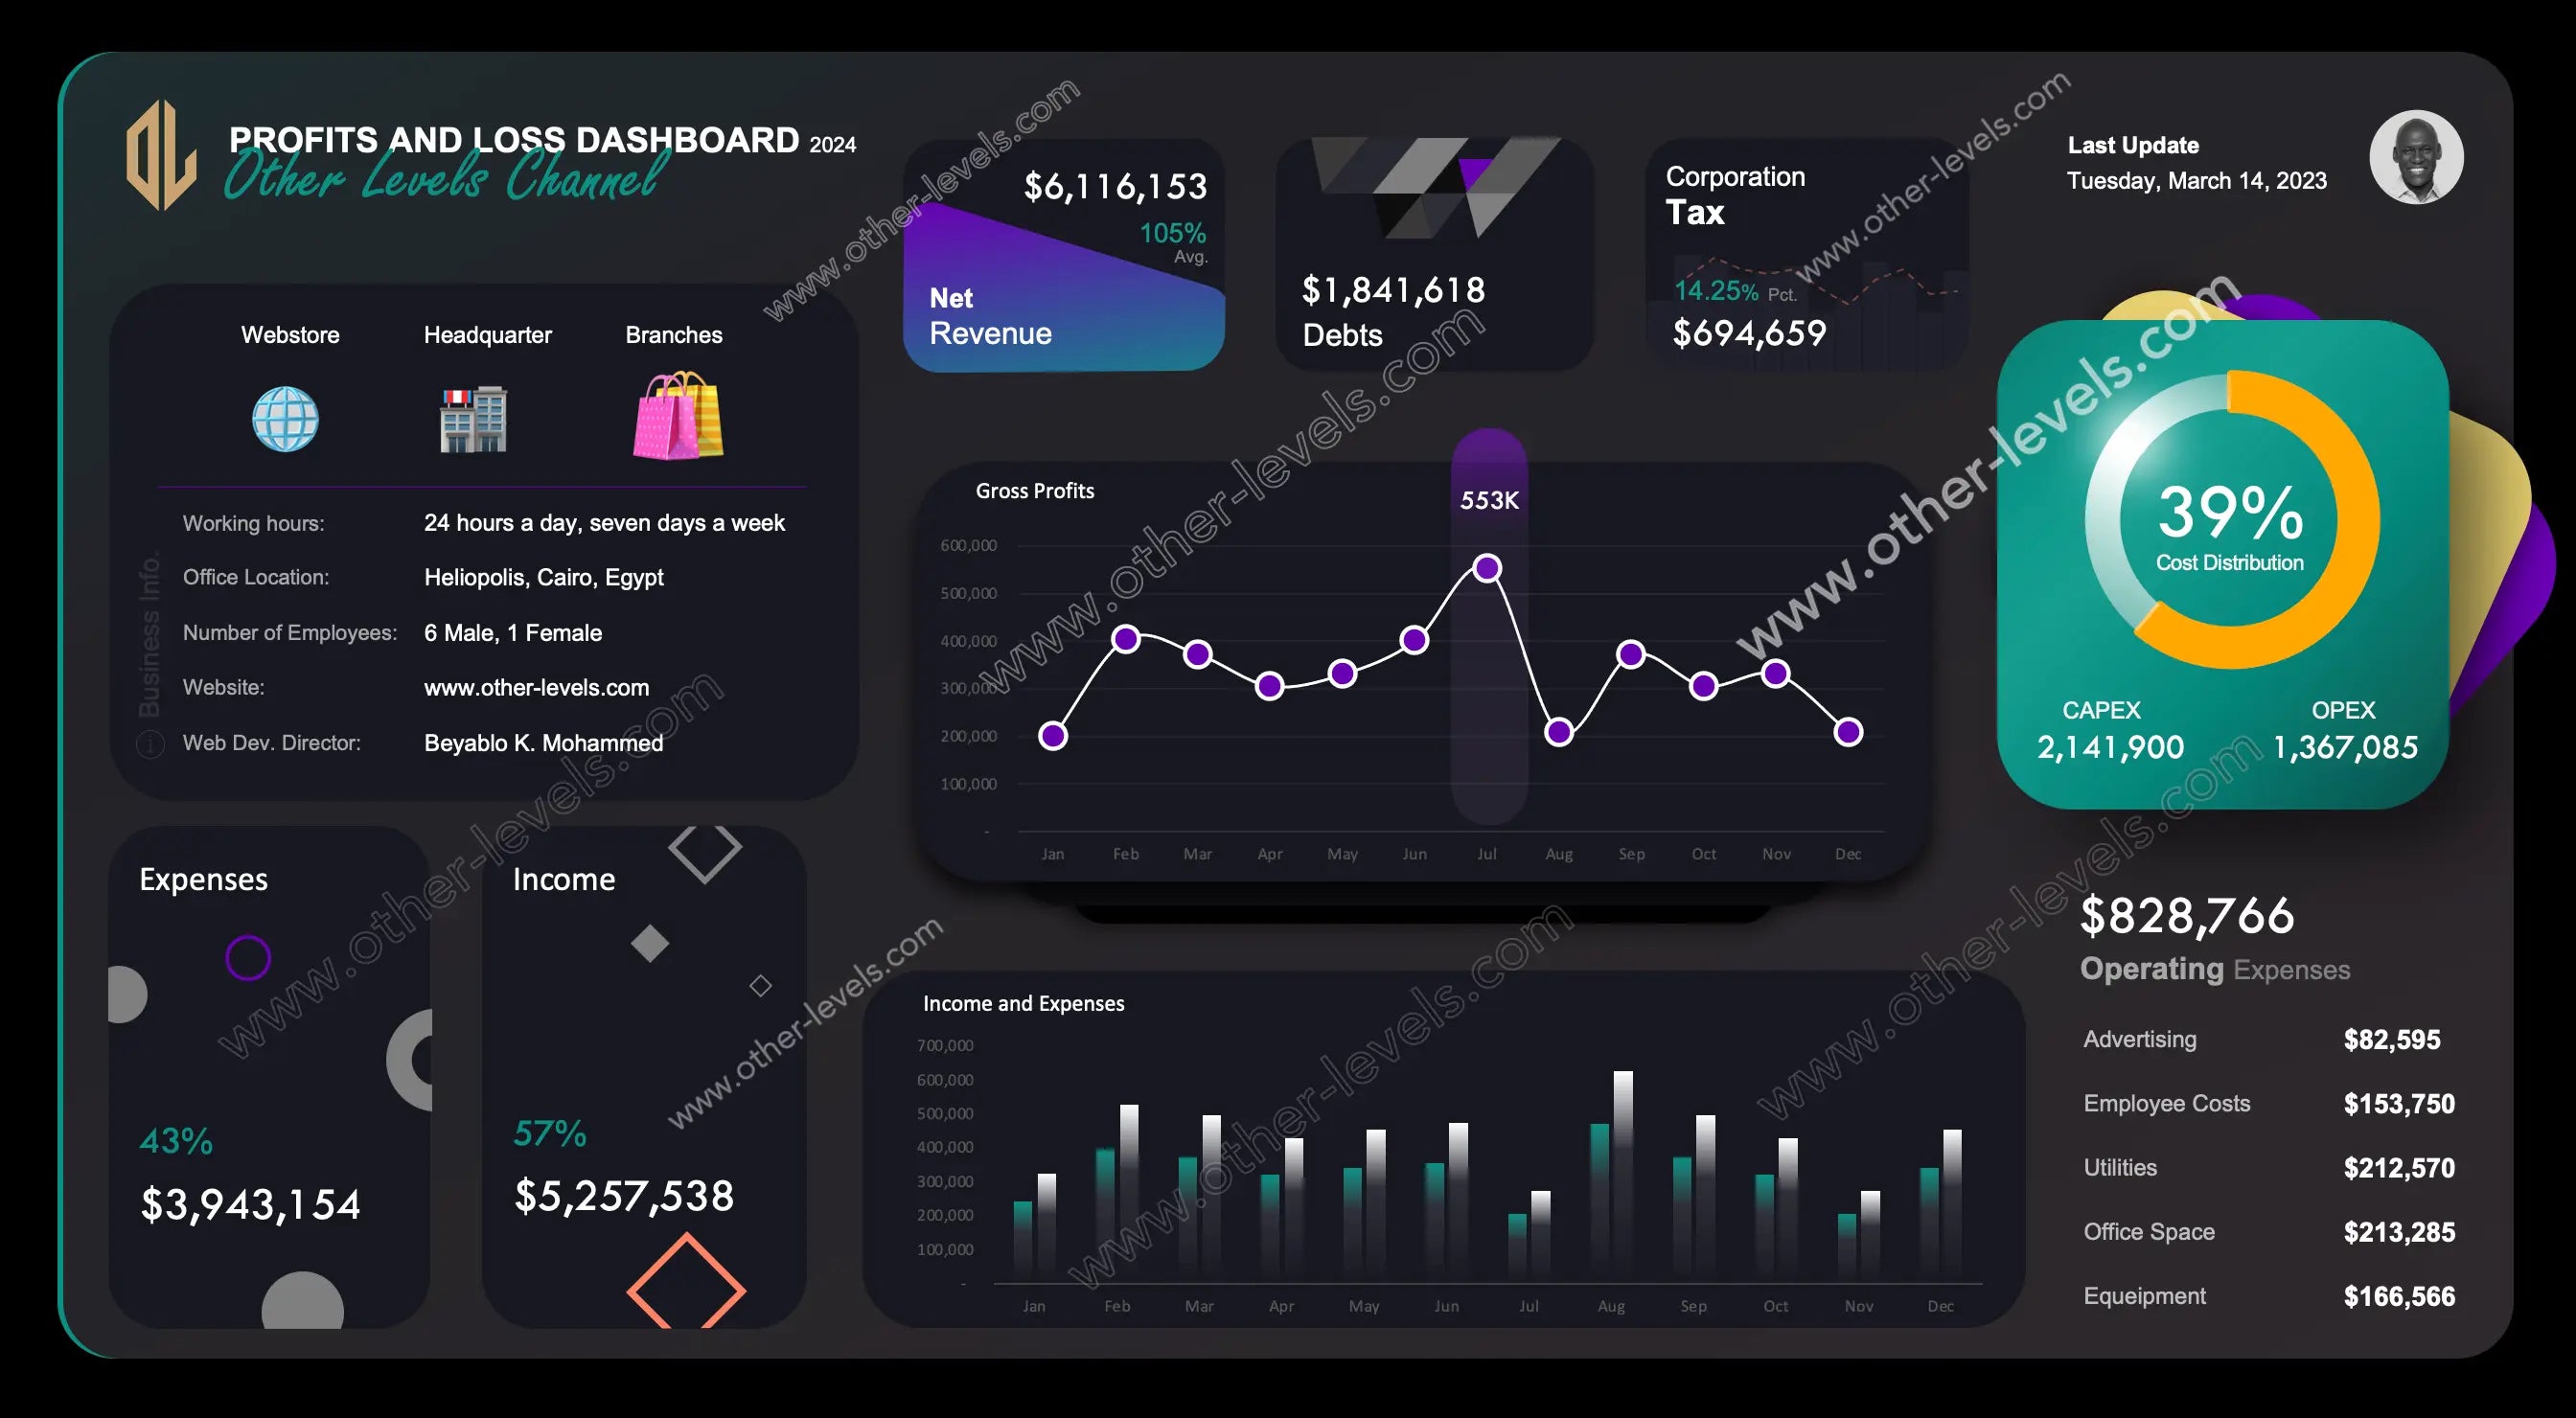
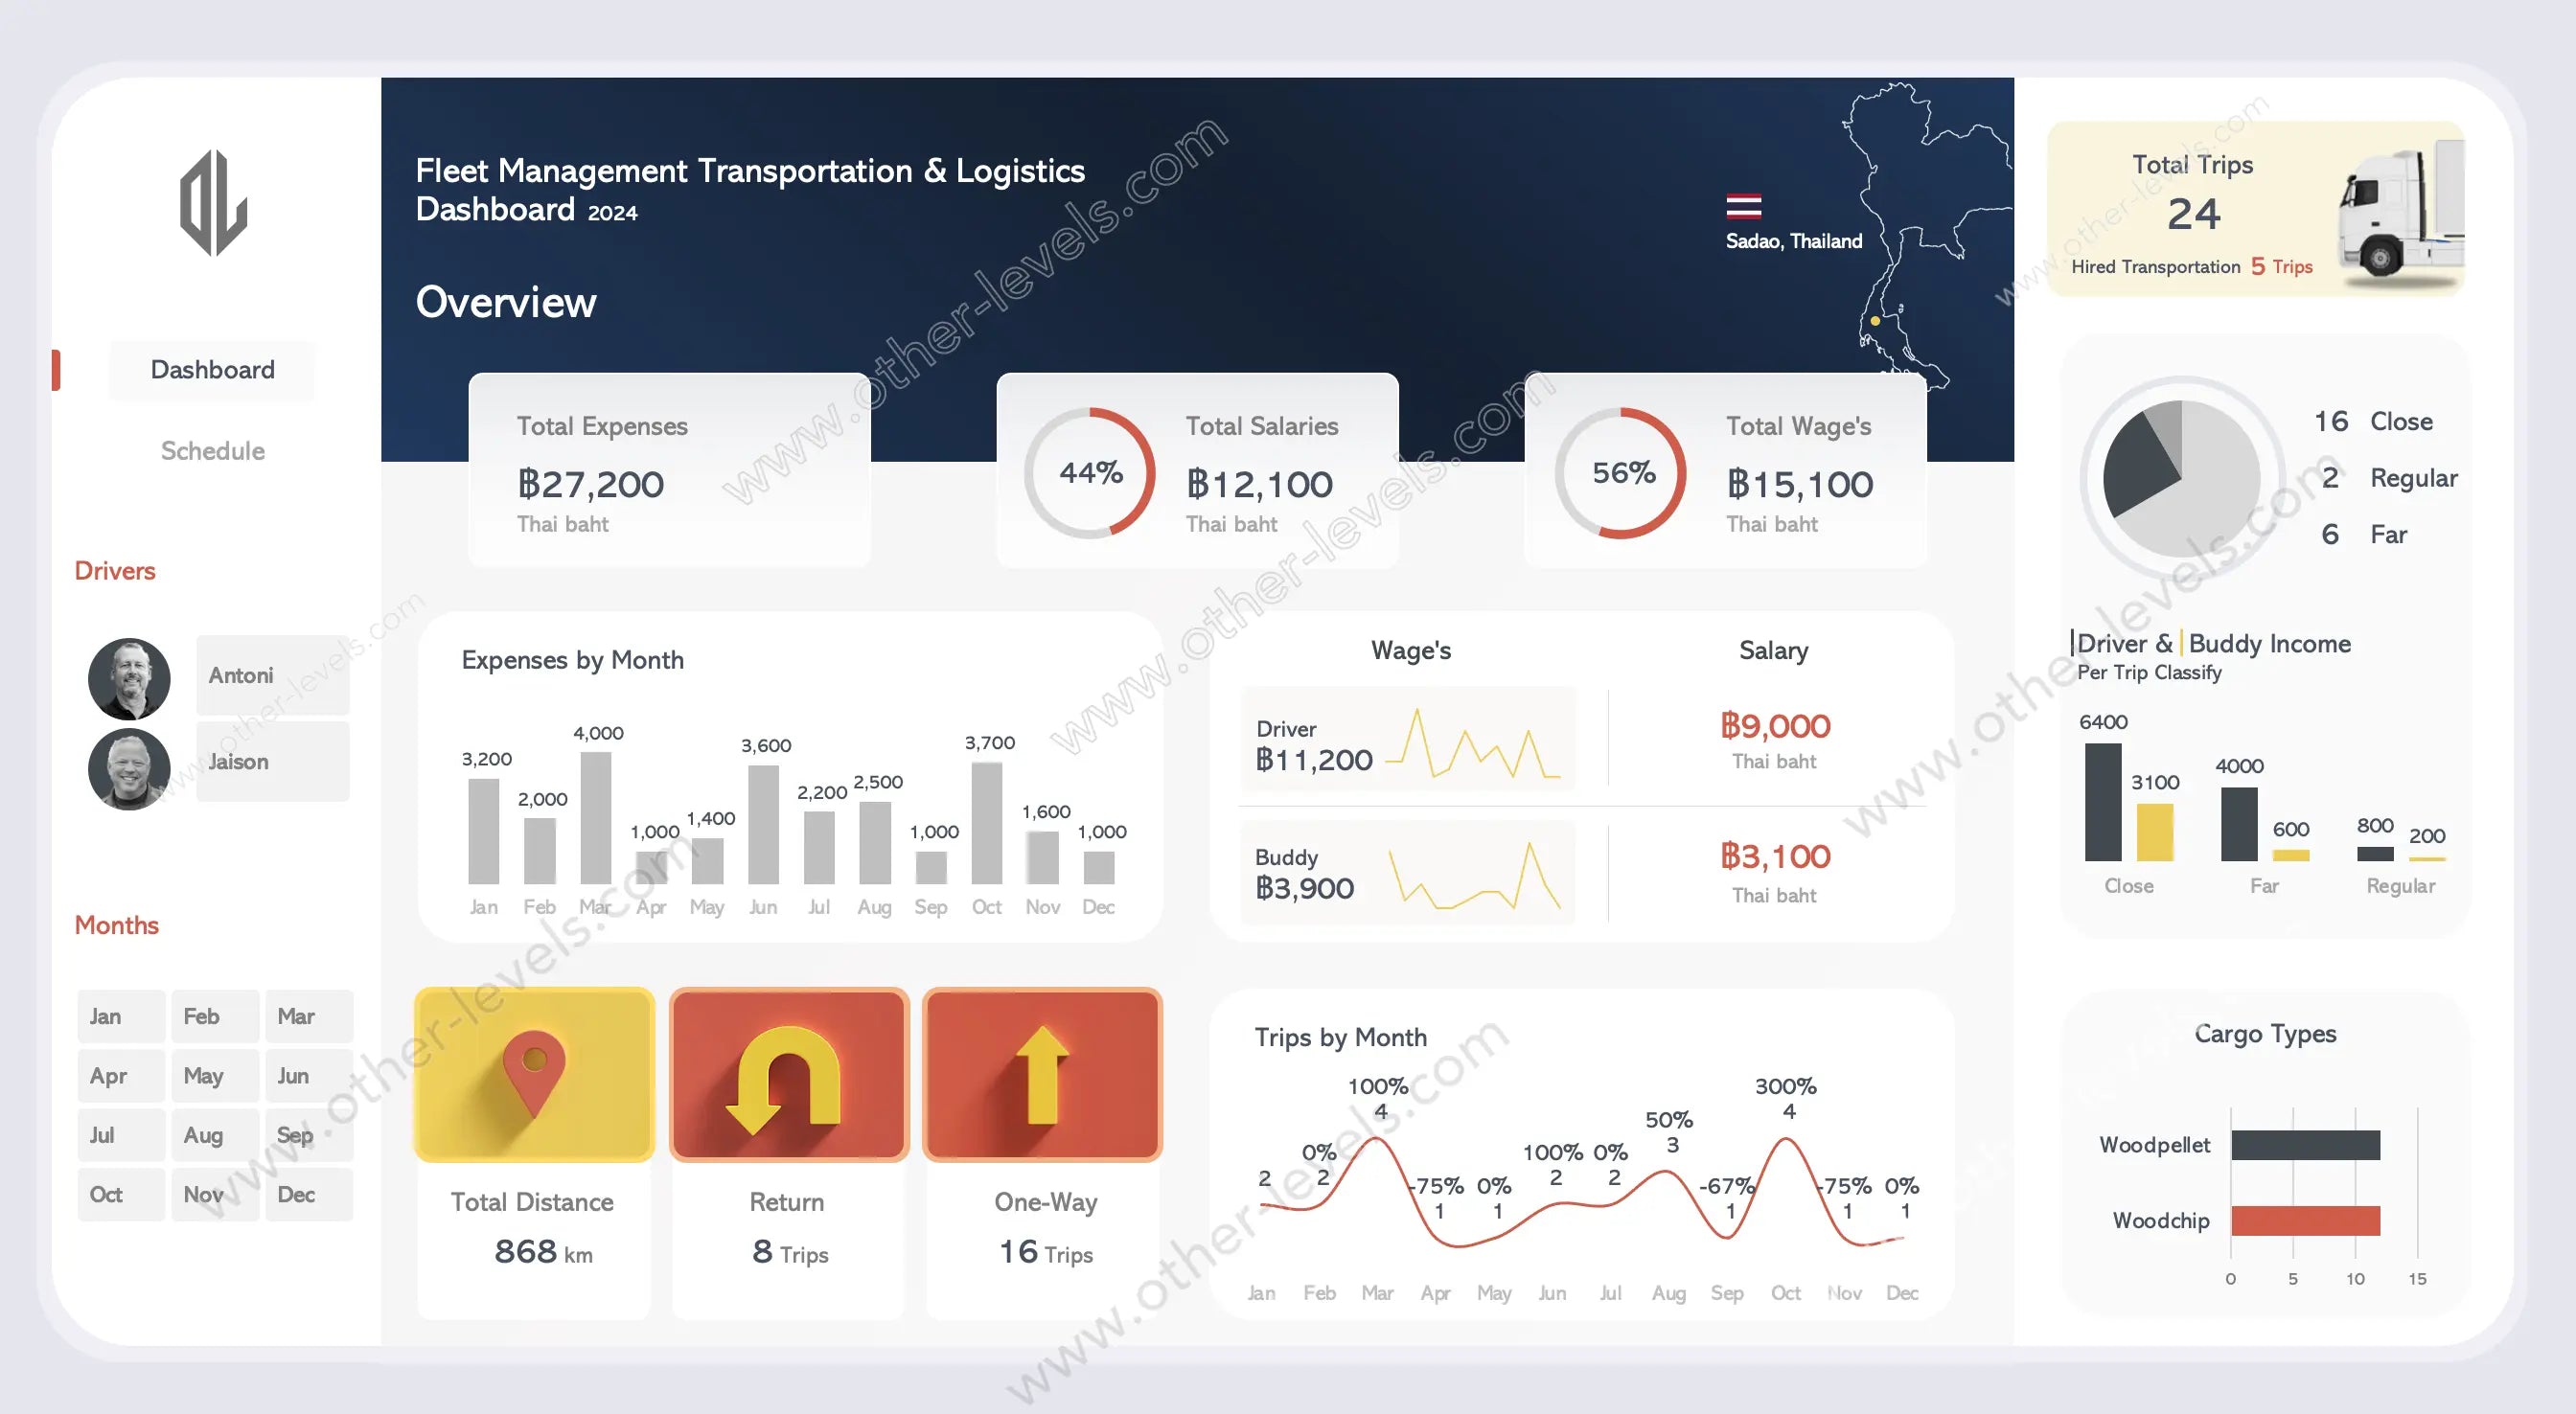
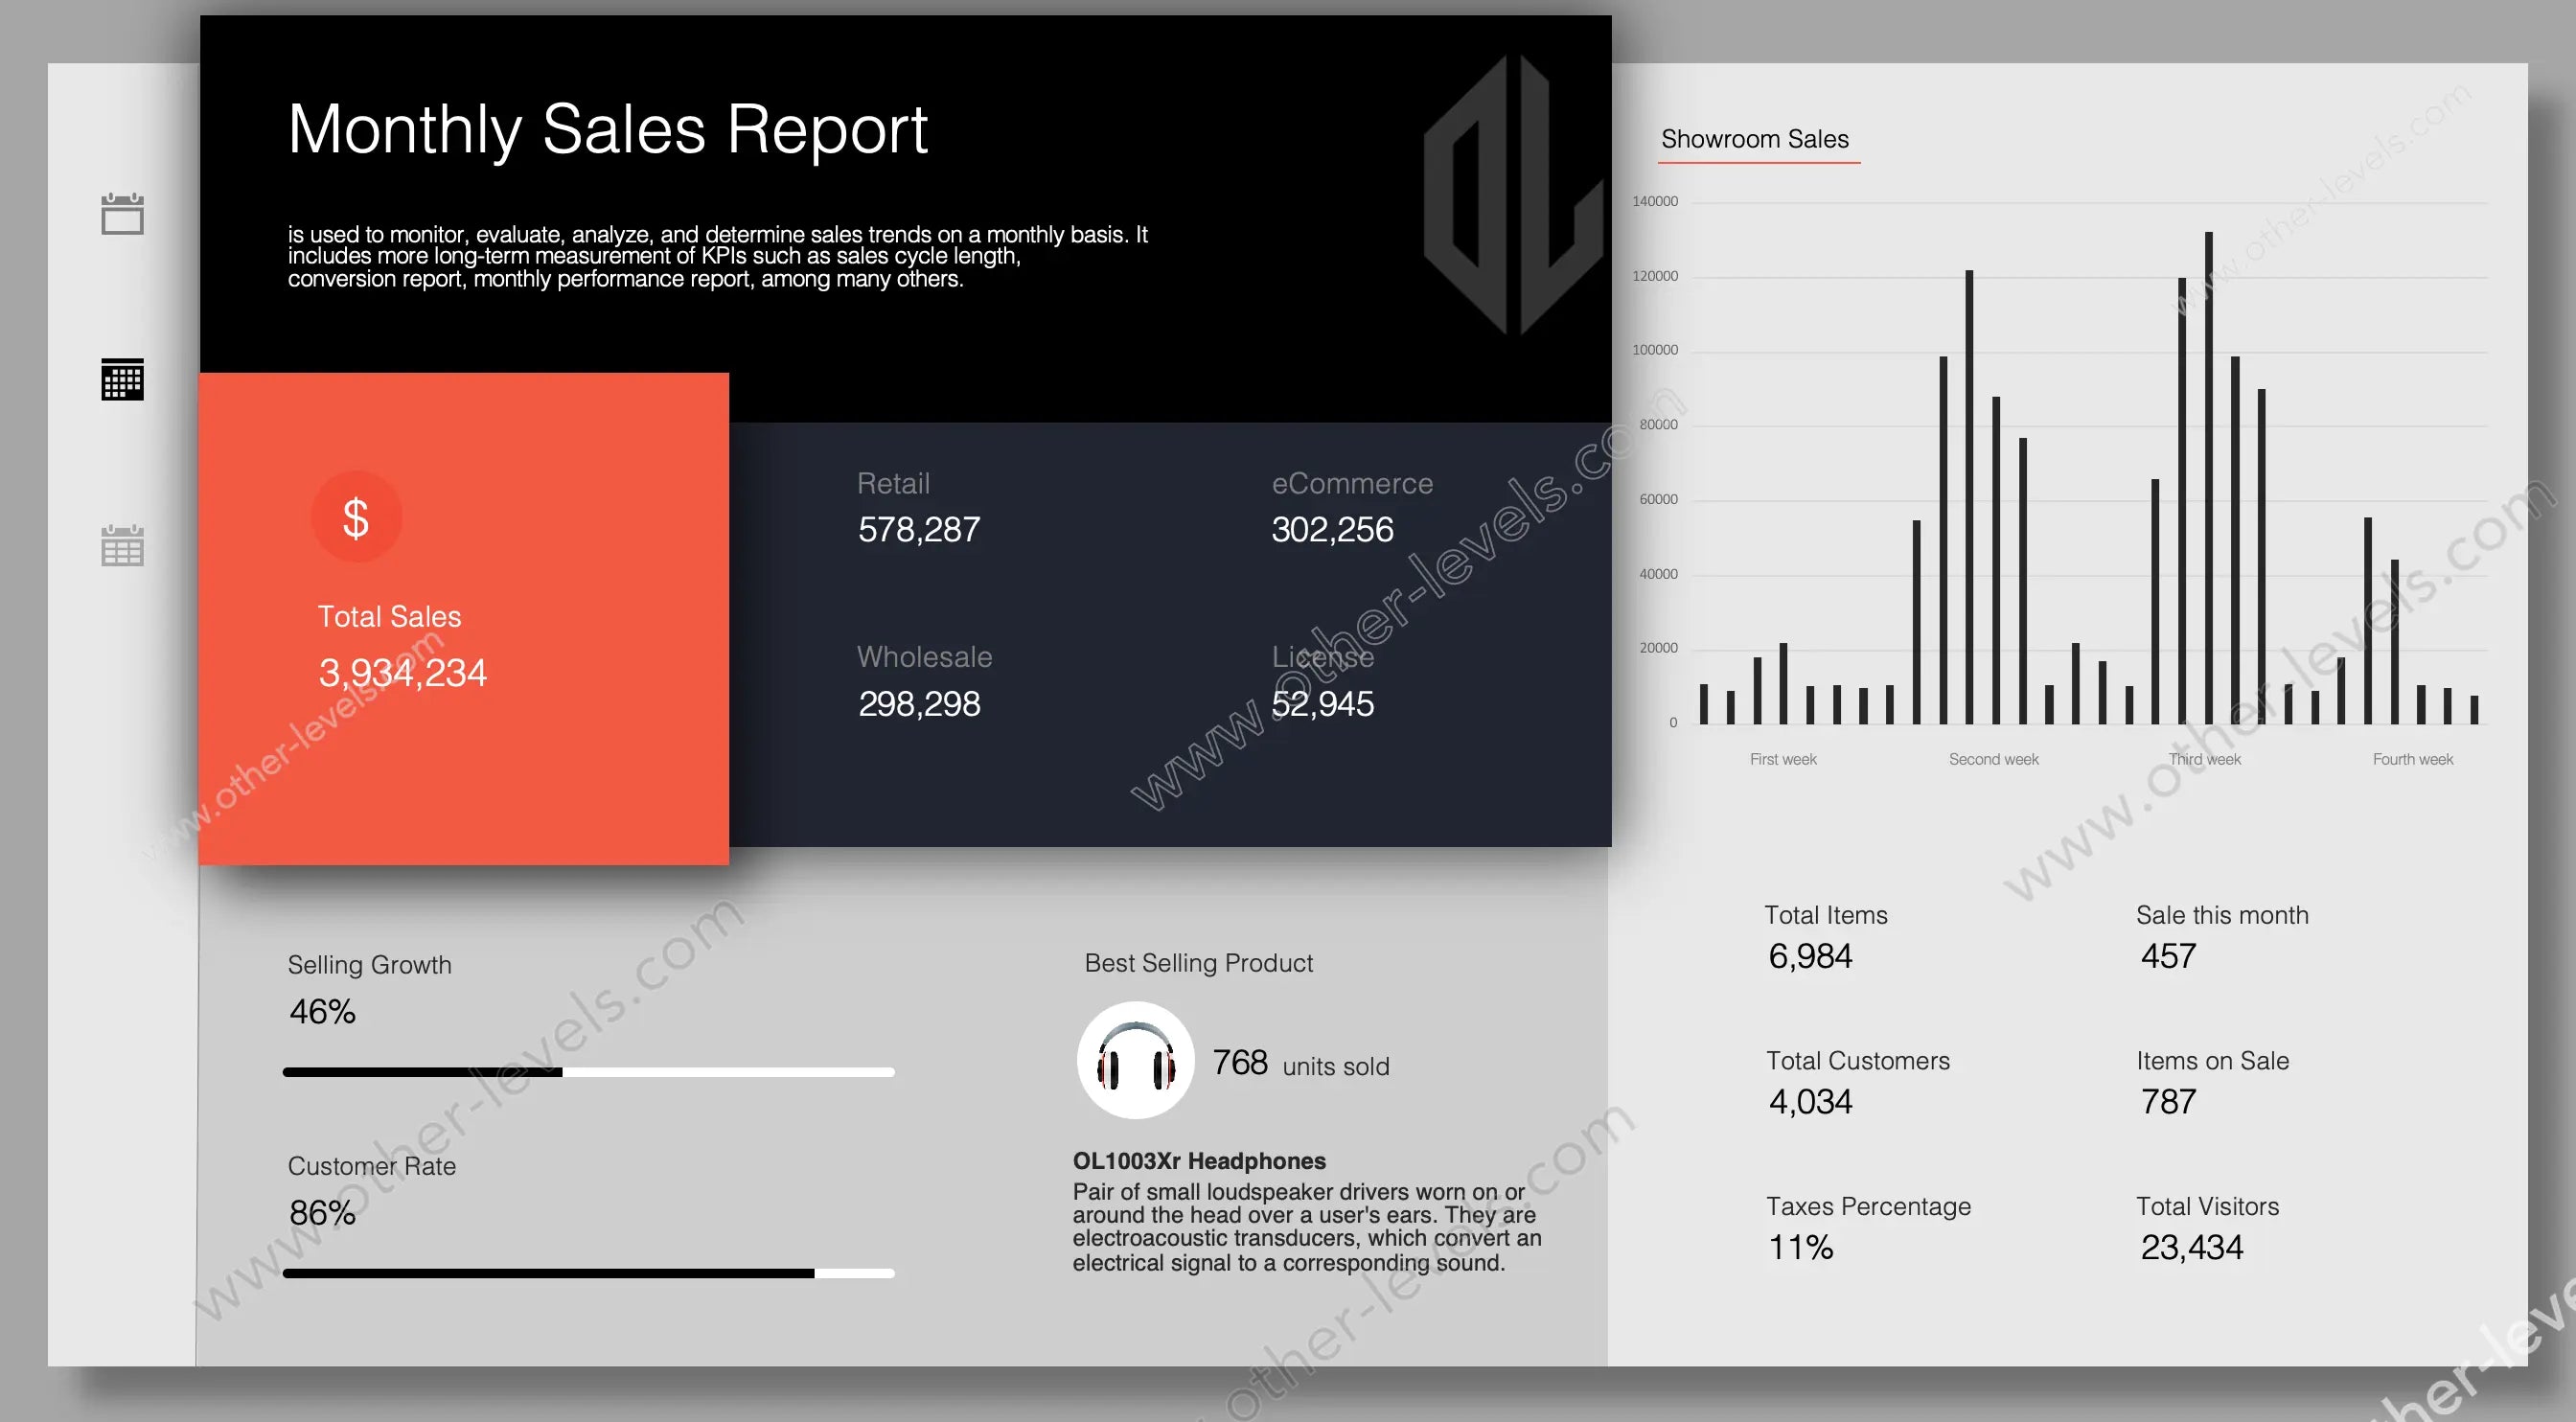
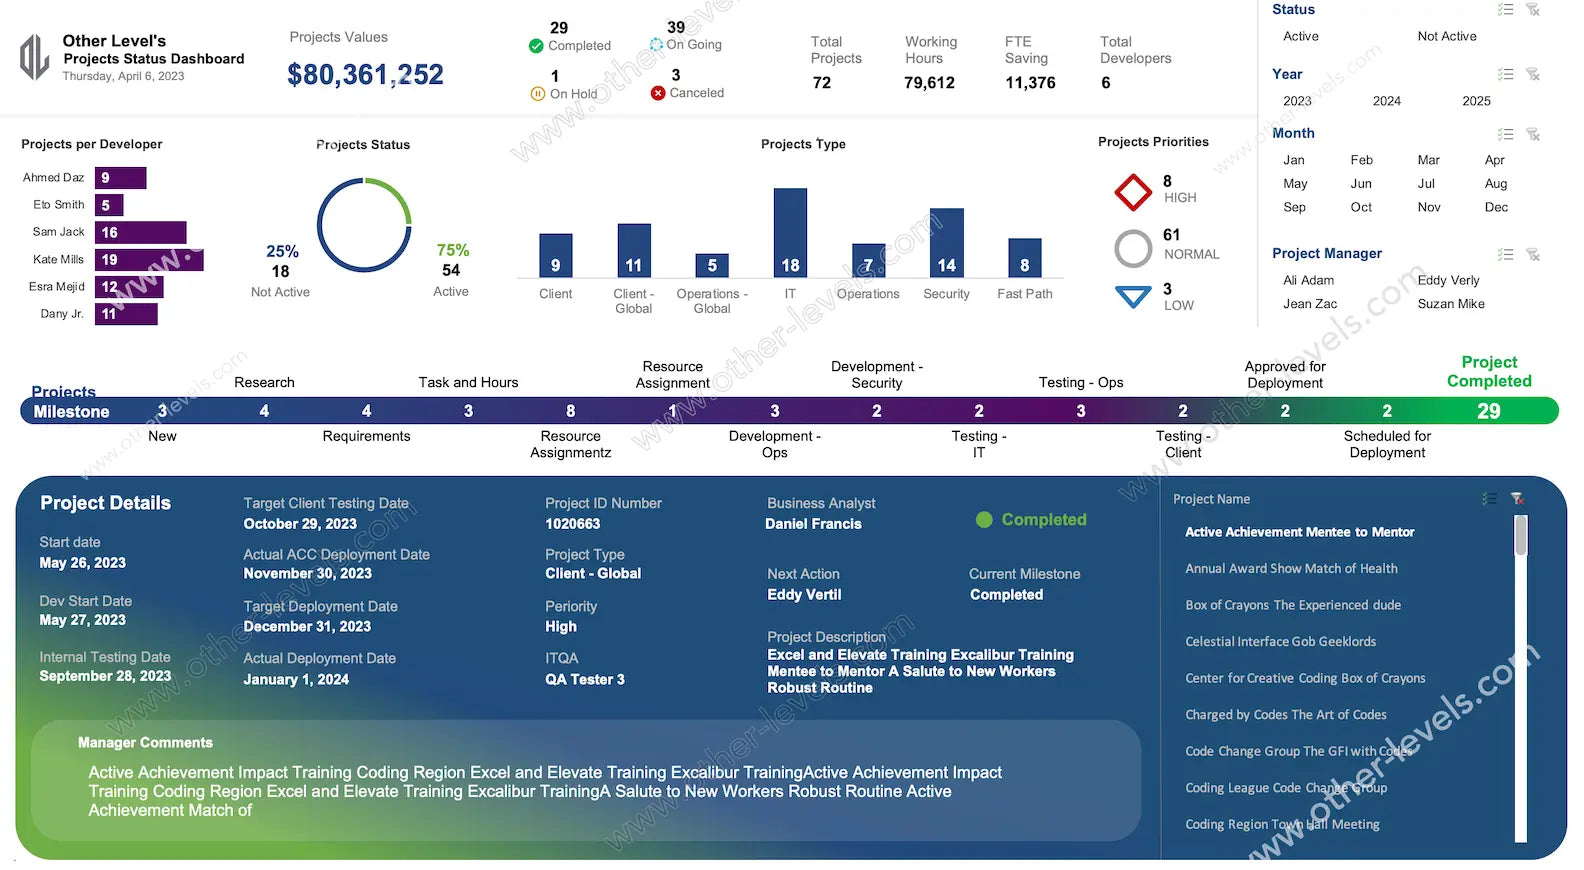
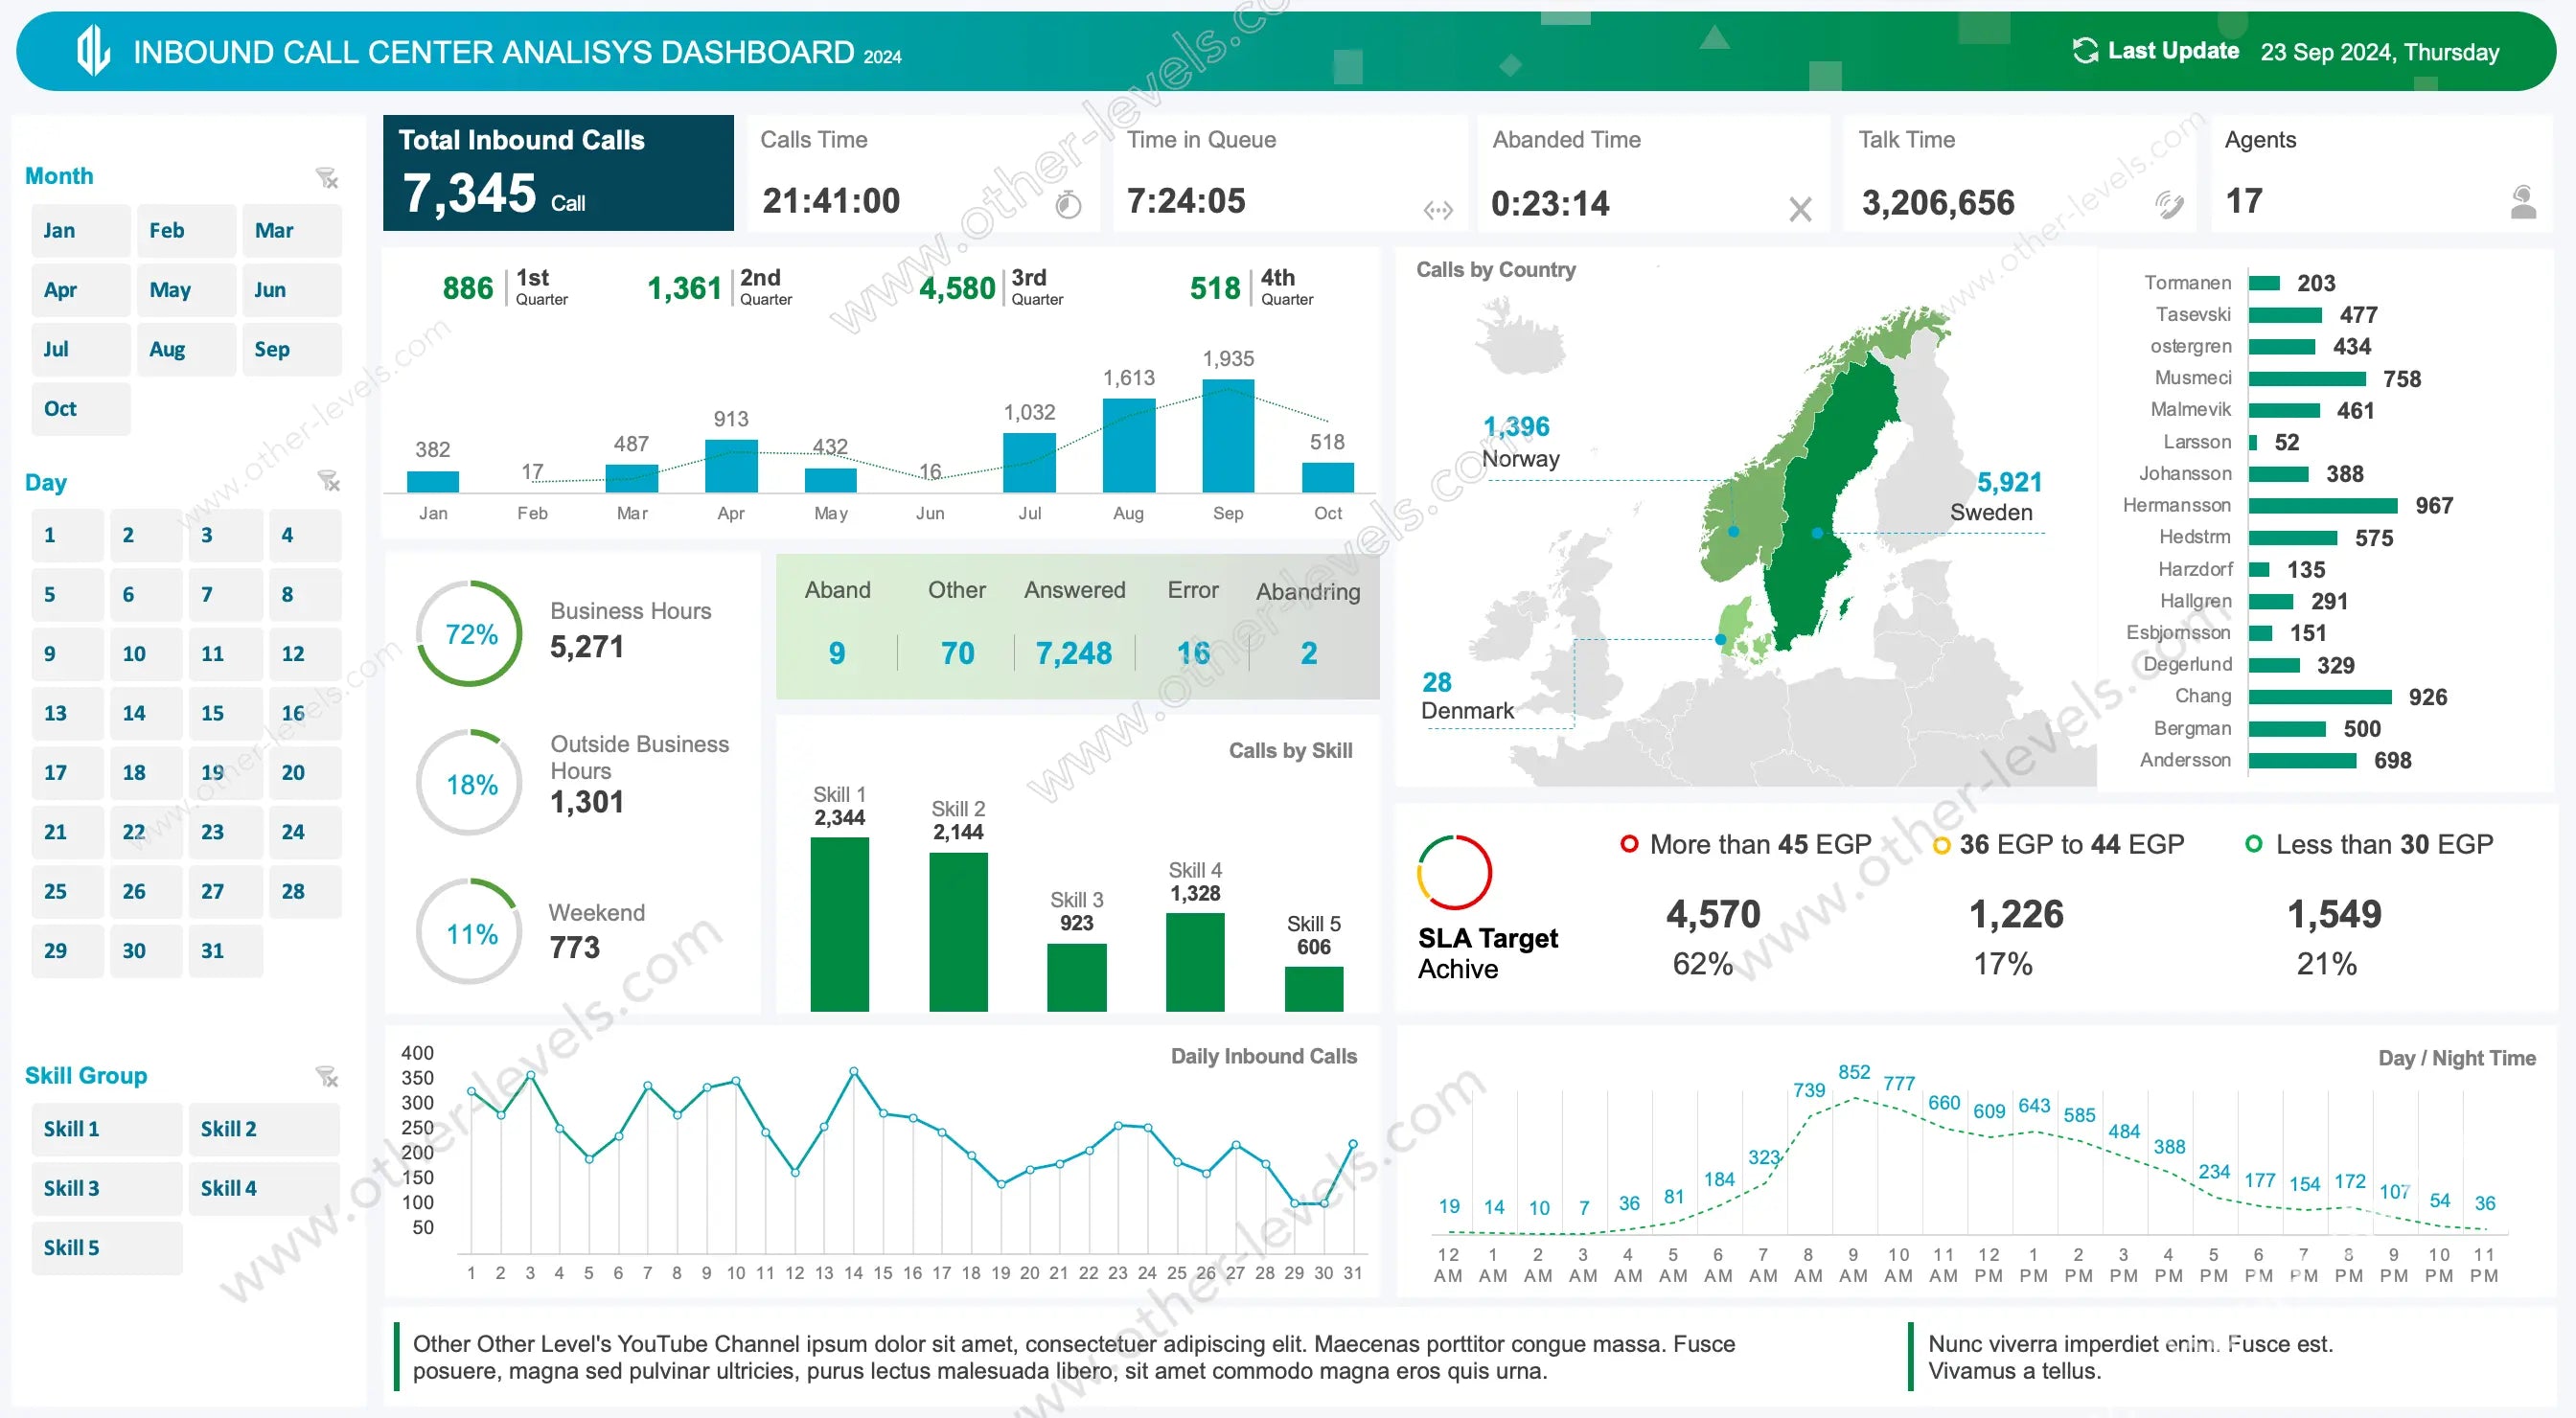
Each dashboard template is downloadable and ready to use, helping you automate business reporting with speed and accuracy. Our professional dashboard collection includes customizable analysis dashboards and dynamic dashboards designed for KPI tracking, forecasting, and executive reporting. Every layout is built to deliver real results and presentation-ready insights for managers and teams.
Built for flexibility, these tools simplify data analytics and visualization while maintaining a clean, modern look. Whether you manage finance, sales, operations, or projects, every dashboard combines smart structure, responsive charts, and automation features to save time and improve decision-making. No coding or add-ins required—just plug in your data.
Empower your team with interactive data visualization tools that turn raw data into clear, actionable insights that drive progress.
Explore our curated Excel Dashboard Templates — from Finance and Sales to HR and Inventory dashboards. All templates include step-by-step video tutorials on our Other Levels YouTube Channel.