✅ Instant Digital Delivery | 🔒 Secure Checkout | ⭐ Trusted by 1,000+ Professionals | 💬 24hr Support
Project Tracker Excel Dashboard – Business Analyst
Pairs well with
Excel Project Tracker Dashboard – Built for Business Analysts
This isn’t just another Project Tracker spreadsheet. It’s a dynamic project tracking dashboard in Excel that turns raw tasks and timelines into a clear visual story. No complicated setup, no extra software—just Excel doing what it does best.
Who should use it (and why it works)
Designed for business analysts, project managers, and even PMO teams, this template makes it easy to align on progress. Instead of chasing updates across files, everyone works from one version of the truth—always current, always reliable.
What’s included in the template
- A fully editable project status report template in Excel.
- Interactive charts, pivot tables, and slicers powering the tracking dashboard.
- Built-in dropdowns and validations to keep project data consistent.
- Support for teams migrating from Excel project trackers or manual reports.
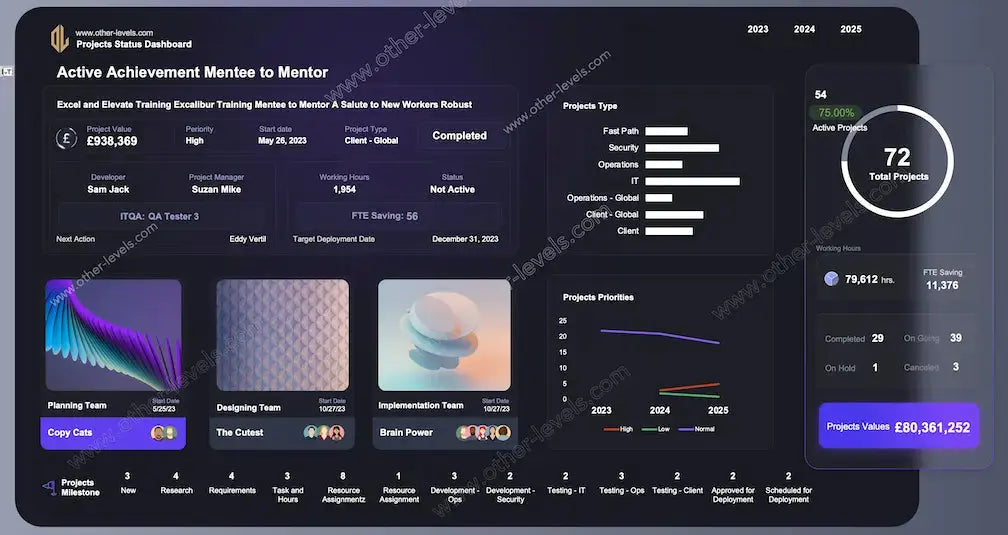
Dashboard layout at a glance
Compact header with status updates
See owners, deadlines, and current project status at the top—no digging required. Upcoming actions are automatically highlighted so the next step is always clear.
Workload balance and priority
An Excel bar chart instantly compares project categories. A small badge highlights project priority so decision-making becomes faster and more transparent.
Portfolio health donut
At a glance, track completed projects versus in-progress work with a clean doughnut chart. It’s designed to be simple yet powerful—ideal for portfolio reviews.
Effort and efficiency tracking
Hours roll up from task level to project level. Whether you’re checking total working hours per year or forecasting demand, the numbers stay consistent across the board.
Trend lines for future planning
With annual trend views, this dashboard doubles as a project 2025 tracker. Spot shifts in workload early and act before bottlenecks grow.
Ownership and accountability
Visual cards make it easy to see who owns what, when they started, and what’s next. Handoffs and follow-ups become seamless.
Milestone pipeline
A stage bar shows the flow—intake, build, test, deploy—making milestones and bottlenecks crystal clear.
Filters and quick insights
Interactive slicers let you filter by year, region, or case type. Every chart, KPI, and count updates instantly, turning Excel into a fast, interactive project tracker.
Data tables powering the dashboard
- Projects — one row per project with IDs, owners, dates, and values.
- Tasks — planned vs. actual hours, stages, and deadlines for project progress.
- Time/Hours — optional detailed timesheets for audits and deep tracking.
- Lookups — rules and lists aligned with organizational goals.
Why teams love it
- It’s Excel—no new tools to learn, no barriers.
- Eliminates PowerPoint decks by keeping a live dashboard in one file.
- Scales from a single project team to enterprise-level reporting.
Quick setup
- Add your Projects and Tasks—keep IDs consistent for tracking.
- Confirm stages for accurate pipeline counts.
- Set working hours for planning and forecasting.
- Refresh once, then let Excel do the updates automatically.
Why not just software?
Searching for the best project tracking software? This Excel dashboard gives you speed, flexibility, and no lock-in. You stay in control and can always upgrade later with automation or integrations.
Pair it with related templates
- Projects Status & Details Dashboard - Comprehensive Excel Dashboard — great for deeper portfolio health analysis and expanded project status reporting.
- Animated Workflow, Timeline, and Milestones PowerPoint Template — ideal for stakeholder updates and executive presentations.
Video guide
Watch the full Excel Project Tracker Dashboard tutorial on our Other Levels YouTube Channel
A day-one story
It’s Monday morning. You open the Excel file. The header shows project status, the donut highlights completion, and the trend line reveals shifts. One click on a milestone stage and you’re looking directly at tasks that matter. By stand-up, the team is aligned—no wasted effort, no guessing.
Specifications
Get all essential details in one place. From features and package contents to software compatibility and skill level required, this section gives you a clear overview so you know exactly what to expect before download.
Template Features
Package Details
Software Compatibility
Skill Level Required
Intermediate
FAQs
Please read our FAQs page to find out more.
Are the templates fully customizable?
Yes, all our templates are fully customizable. You can adjust the layout, data, and design elements to fit your specific needs. Our templates are designed to be flexible, allowing you to easily tailor them to your preferences.
Can I order a product in any language?
Yes, we provide products in any language. Simply select the "Dashboard language change" Service and once your order is placed, you will receive it within 48 hours.
What happens if I choose the wrong monitor screen size for my dashboard?
If you choose the wrong screen size, the dashboard may not display correctly on your monitor. Elements could appear too large, too small, or misaligned, affecting the readability and usability of the dashboard. We recommend selecting the appropriate screen size to ensure optimal viewing and performance.
Do I need specific skills to use the advanced Excel dashboard templates?
Our advanced Excel dashboards are easy to use, the only thing you need to know is how to work with PivotTables. With basic knowledge of PivotTables, you'll be able to customize and fully utilize these templates effortlessly. "Please check the skill level required"
All dashboards are 100% editable Excel files. Learn how to use them through our video tutorials, included datasets, and lifetime access program.