✅ Instant Digital Delivery | 🔒 Secure Checkout | ⭐ Trusted by 1,000+ Professionals | 💬 24hr Support
Project Milestones and Status Excel Dashboard – KPI Tracker
Pairs well with
Excel Dashboard for Real Project Control
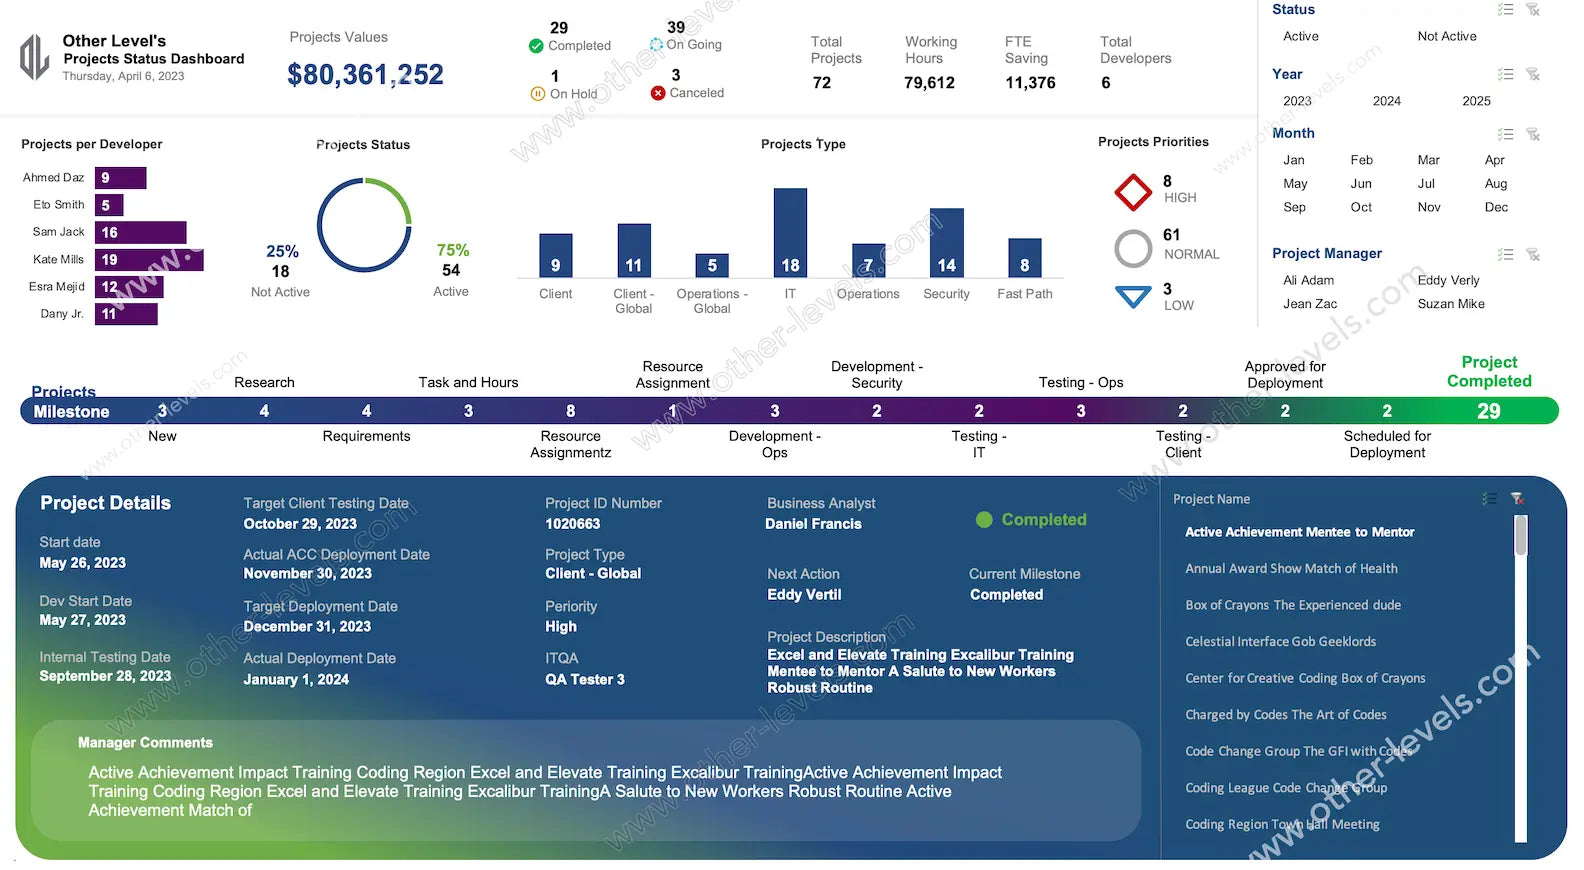
This Excel Dashboard gives managers a clear, fast view of work in motion. It turns raw tables into a living summary of project status, project milestones, and team capacity. Open it, filter by date or manager, and the page updates instantly—perfect for quick stand-ups, reviews, and decision checkpoints.
What you can see at a glance
- KPI tiles for totals, working hours, and capacity savings with kpi tracking.
- Status split: active vs not active to monitor overall project status.
- Workload balance by developer to support tracking team performance.
- Priority profile to spot risks before they escalate.
- Milestone timeline to follow every phase from idea to deployment.
Visuals and chart types used
- Projects Values — KPI cards.
- Projects per Developer — horizontal bar chart.
- Projects Status — donut chart.
- Projects Type — column chart.
- Projects Priorities — KPI badges.
- Projects Milestone — stacked timeline/progress bar.
- Project Details — drill-down card with lifecycle dates and notes.
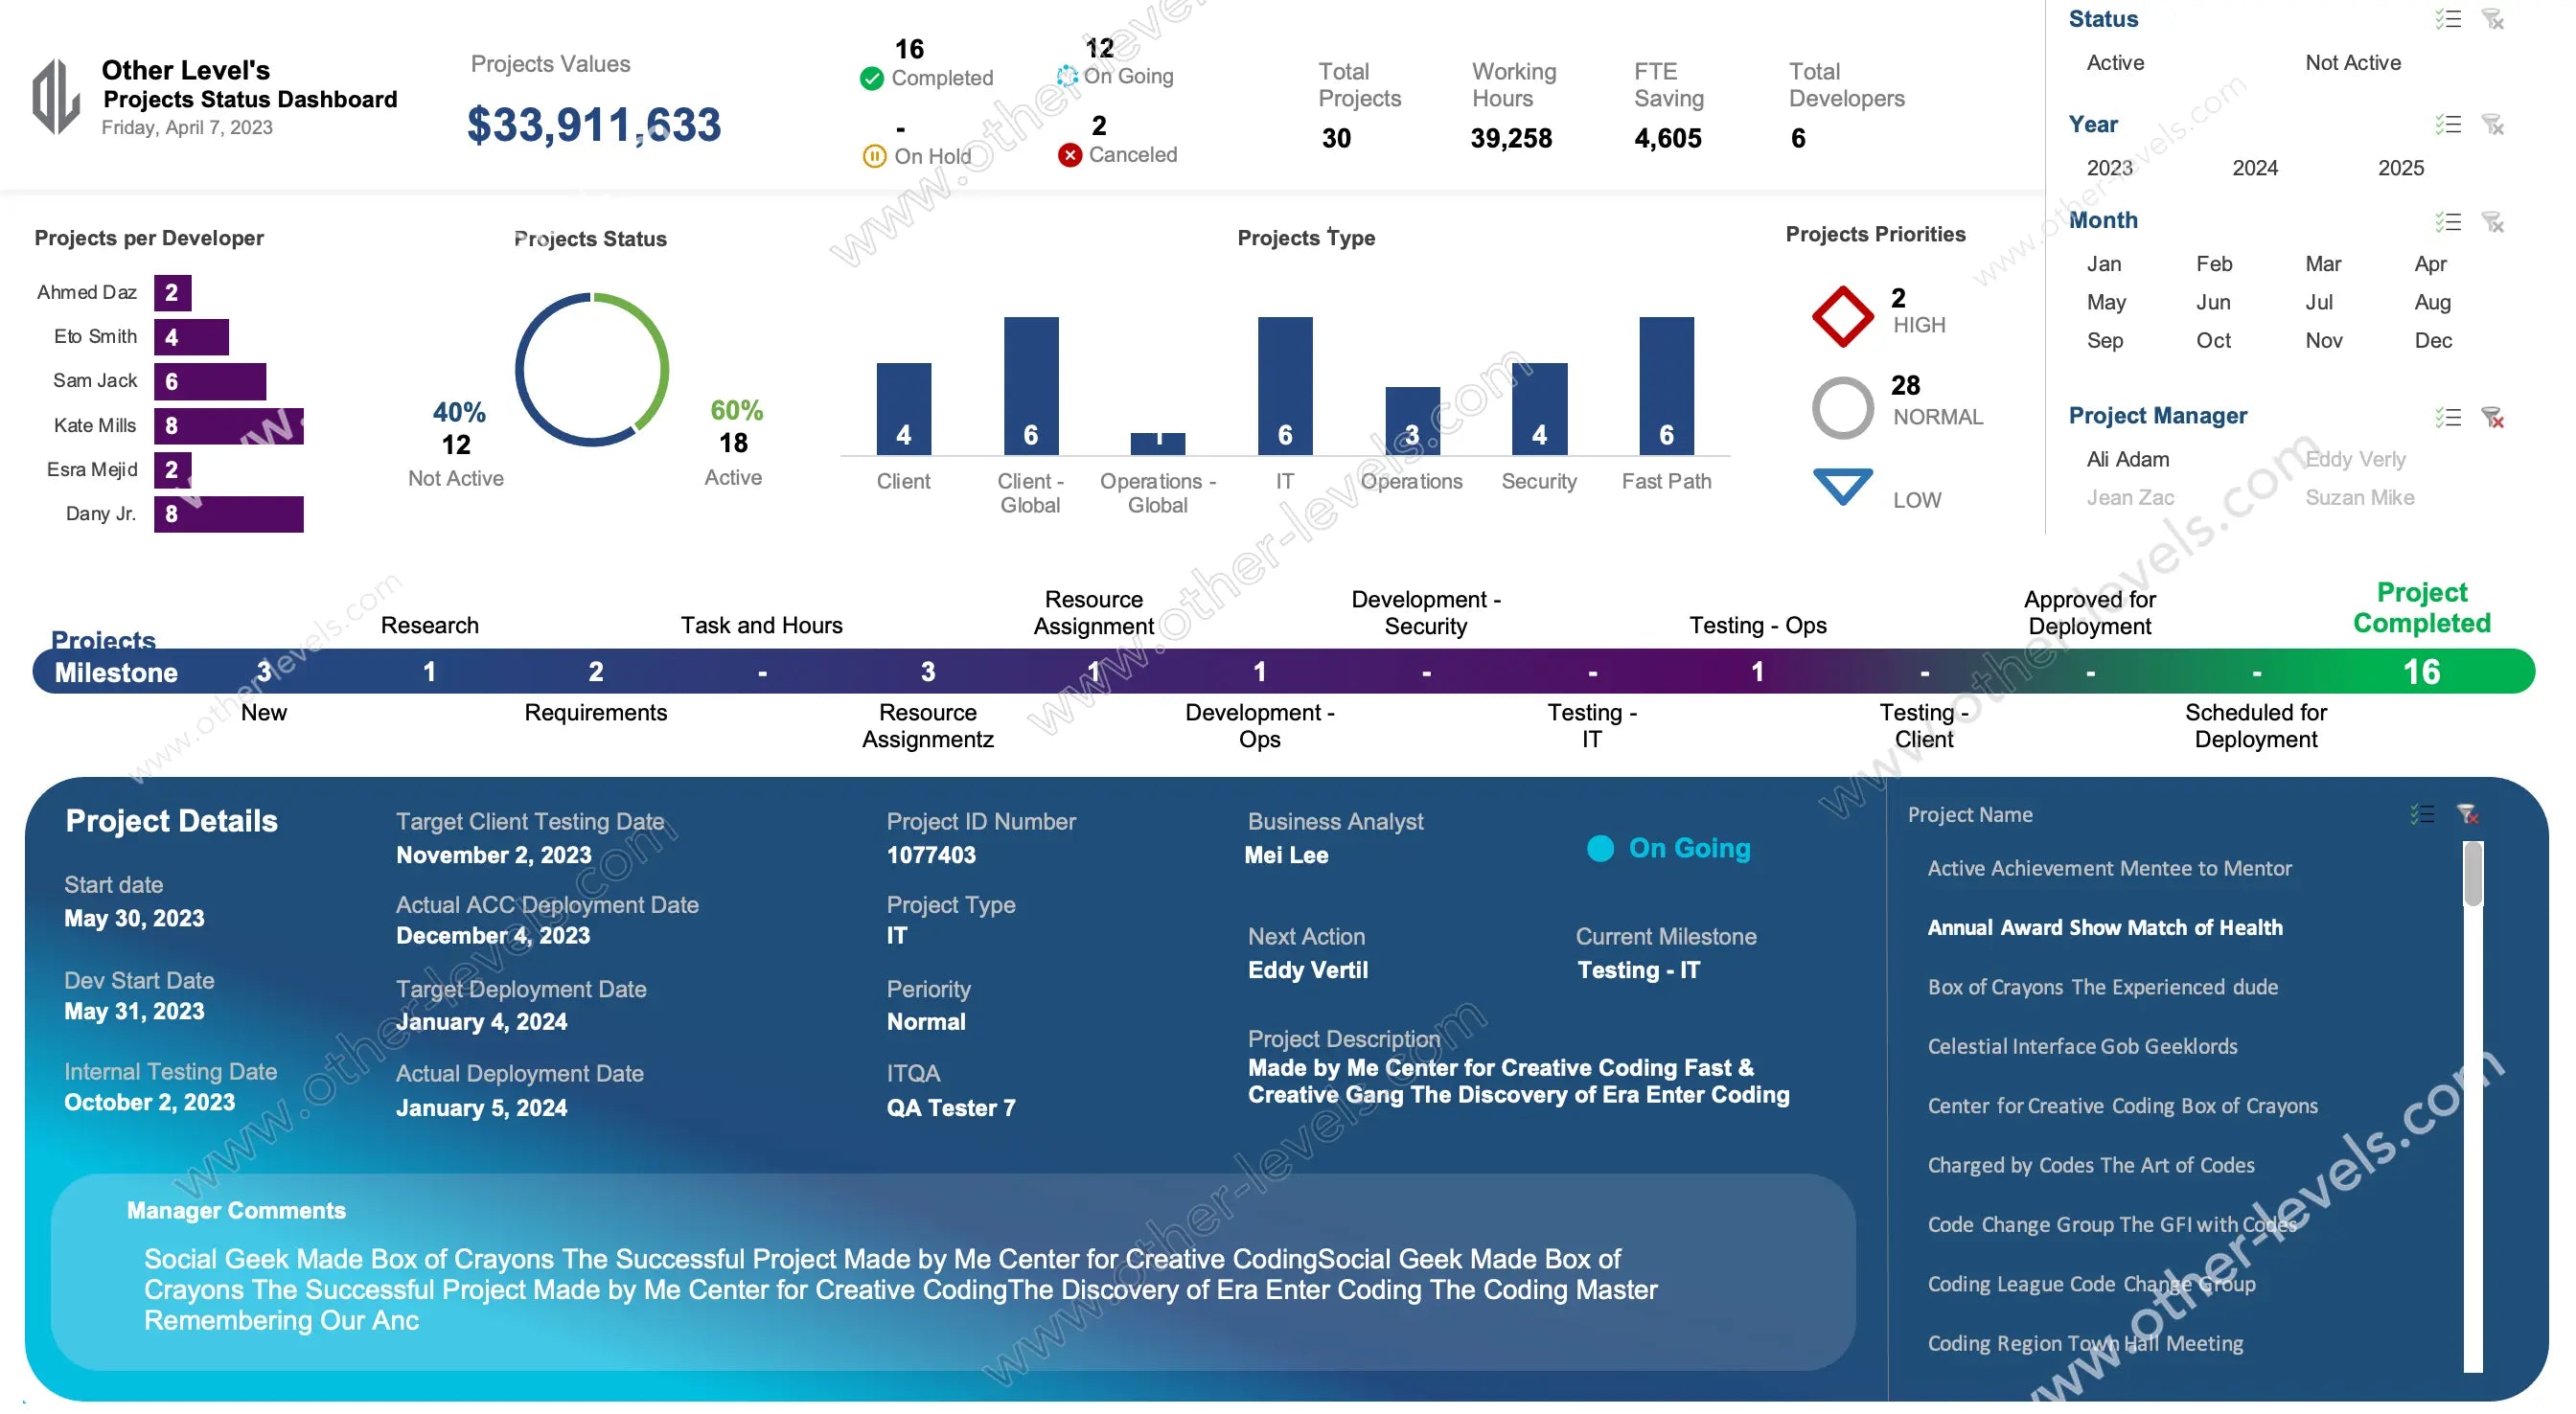
Filters and interactivity
- Status, Year, and Month slicers for fast zoom-in by period.
- Project Manager filter to compare workload and outcomes.
- Scrollable project list; selecting an item refreshes the details card.
- Cross-filtering updates all charts and KPI tiles together.
How teams use it
- Daily ops: a quick pulse on project management KPIs and blockers.
- Planning: use the milestone tracker to balance resources across phases.
- Reviews: drill into a single initiative and confirm next actions.
- Finance: align effort, time, and basic financial performance signals.
What’s inside the template
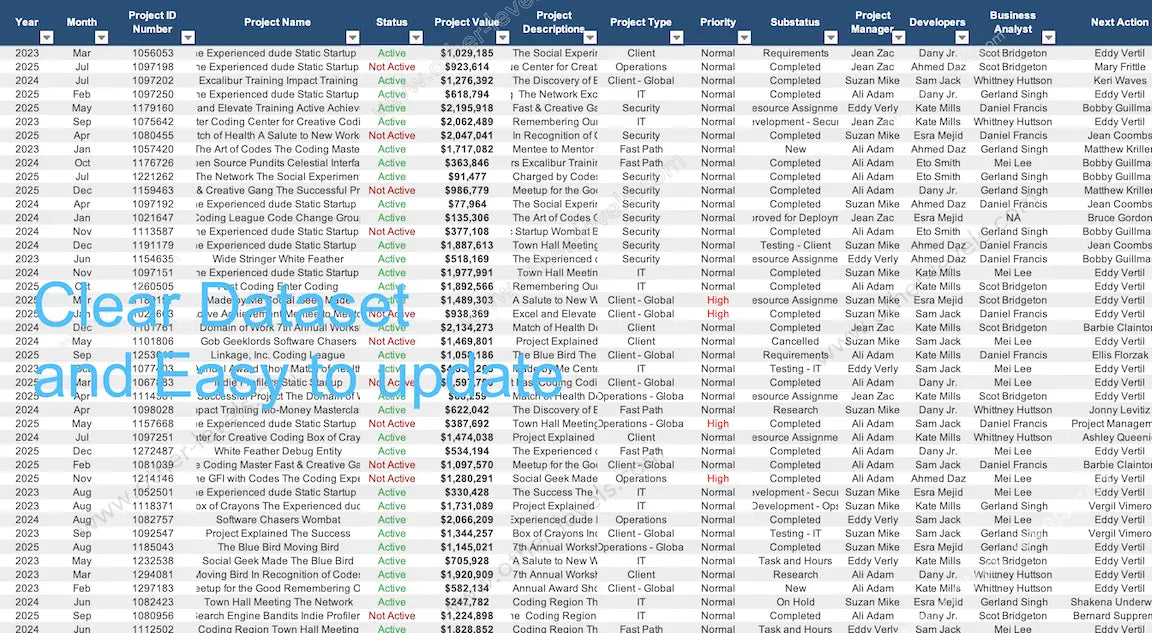
- Clean data model for project type, priority, analysts, and phases.
- Lifecycle fields for planned vs actual dates across key gates.
- Calculated summaries for project milestones and capacity effects.
- Clear labels so a performance team can onboard in minutes.
Related dashboards to explore
For teams working in Google’s ecosystem, see the Project Status Tracking Google Sheets Dashboard for similar project status visuals and KPI tracking.
If you need deeper portfolio detail in Excel, try the Projects Status & Details Dashboard – Comprehensive Excel Dashboard to expand milestones, priorities, and manager-level analysis.
Video tutorial
Watch the full Projects Status & Details Excel tutorial on our Other Levels YouTube channel
Specifications
Get all essential details in one place. From features and package contents to software compatibility and skill level required, this section gives you a clear overview so you know exactly what to expect before download.
Template Features
Package Details
Software Compatibility
Skill Level Required
Intermediate
FAQs
Please read our FAQs page to find out more.
Are the templates fully customizable?
Yes, all our templates are fully customizable. You can adjust the layout, data, and design elements to fit your specific needs. Our templates are designed to be flexible, allowing you to easily tailor them to your preferences.
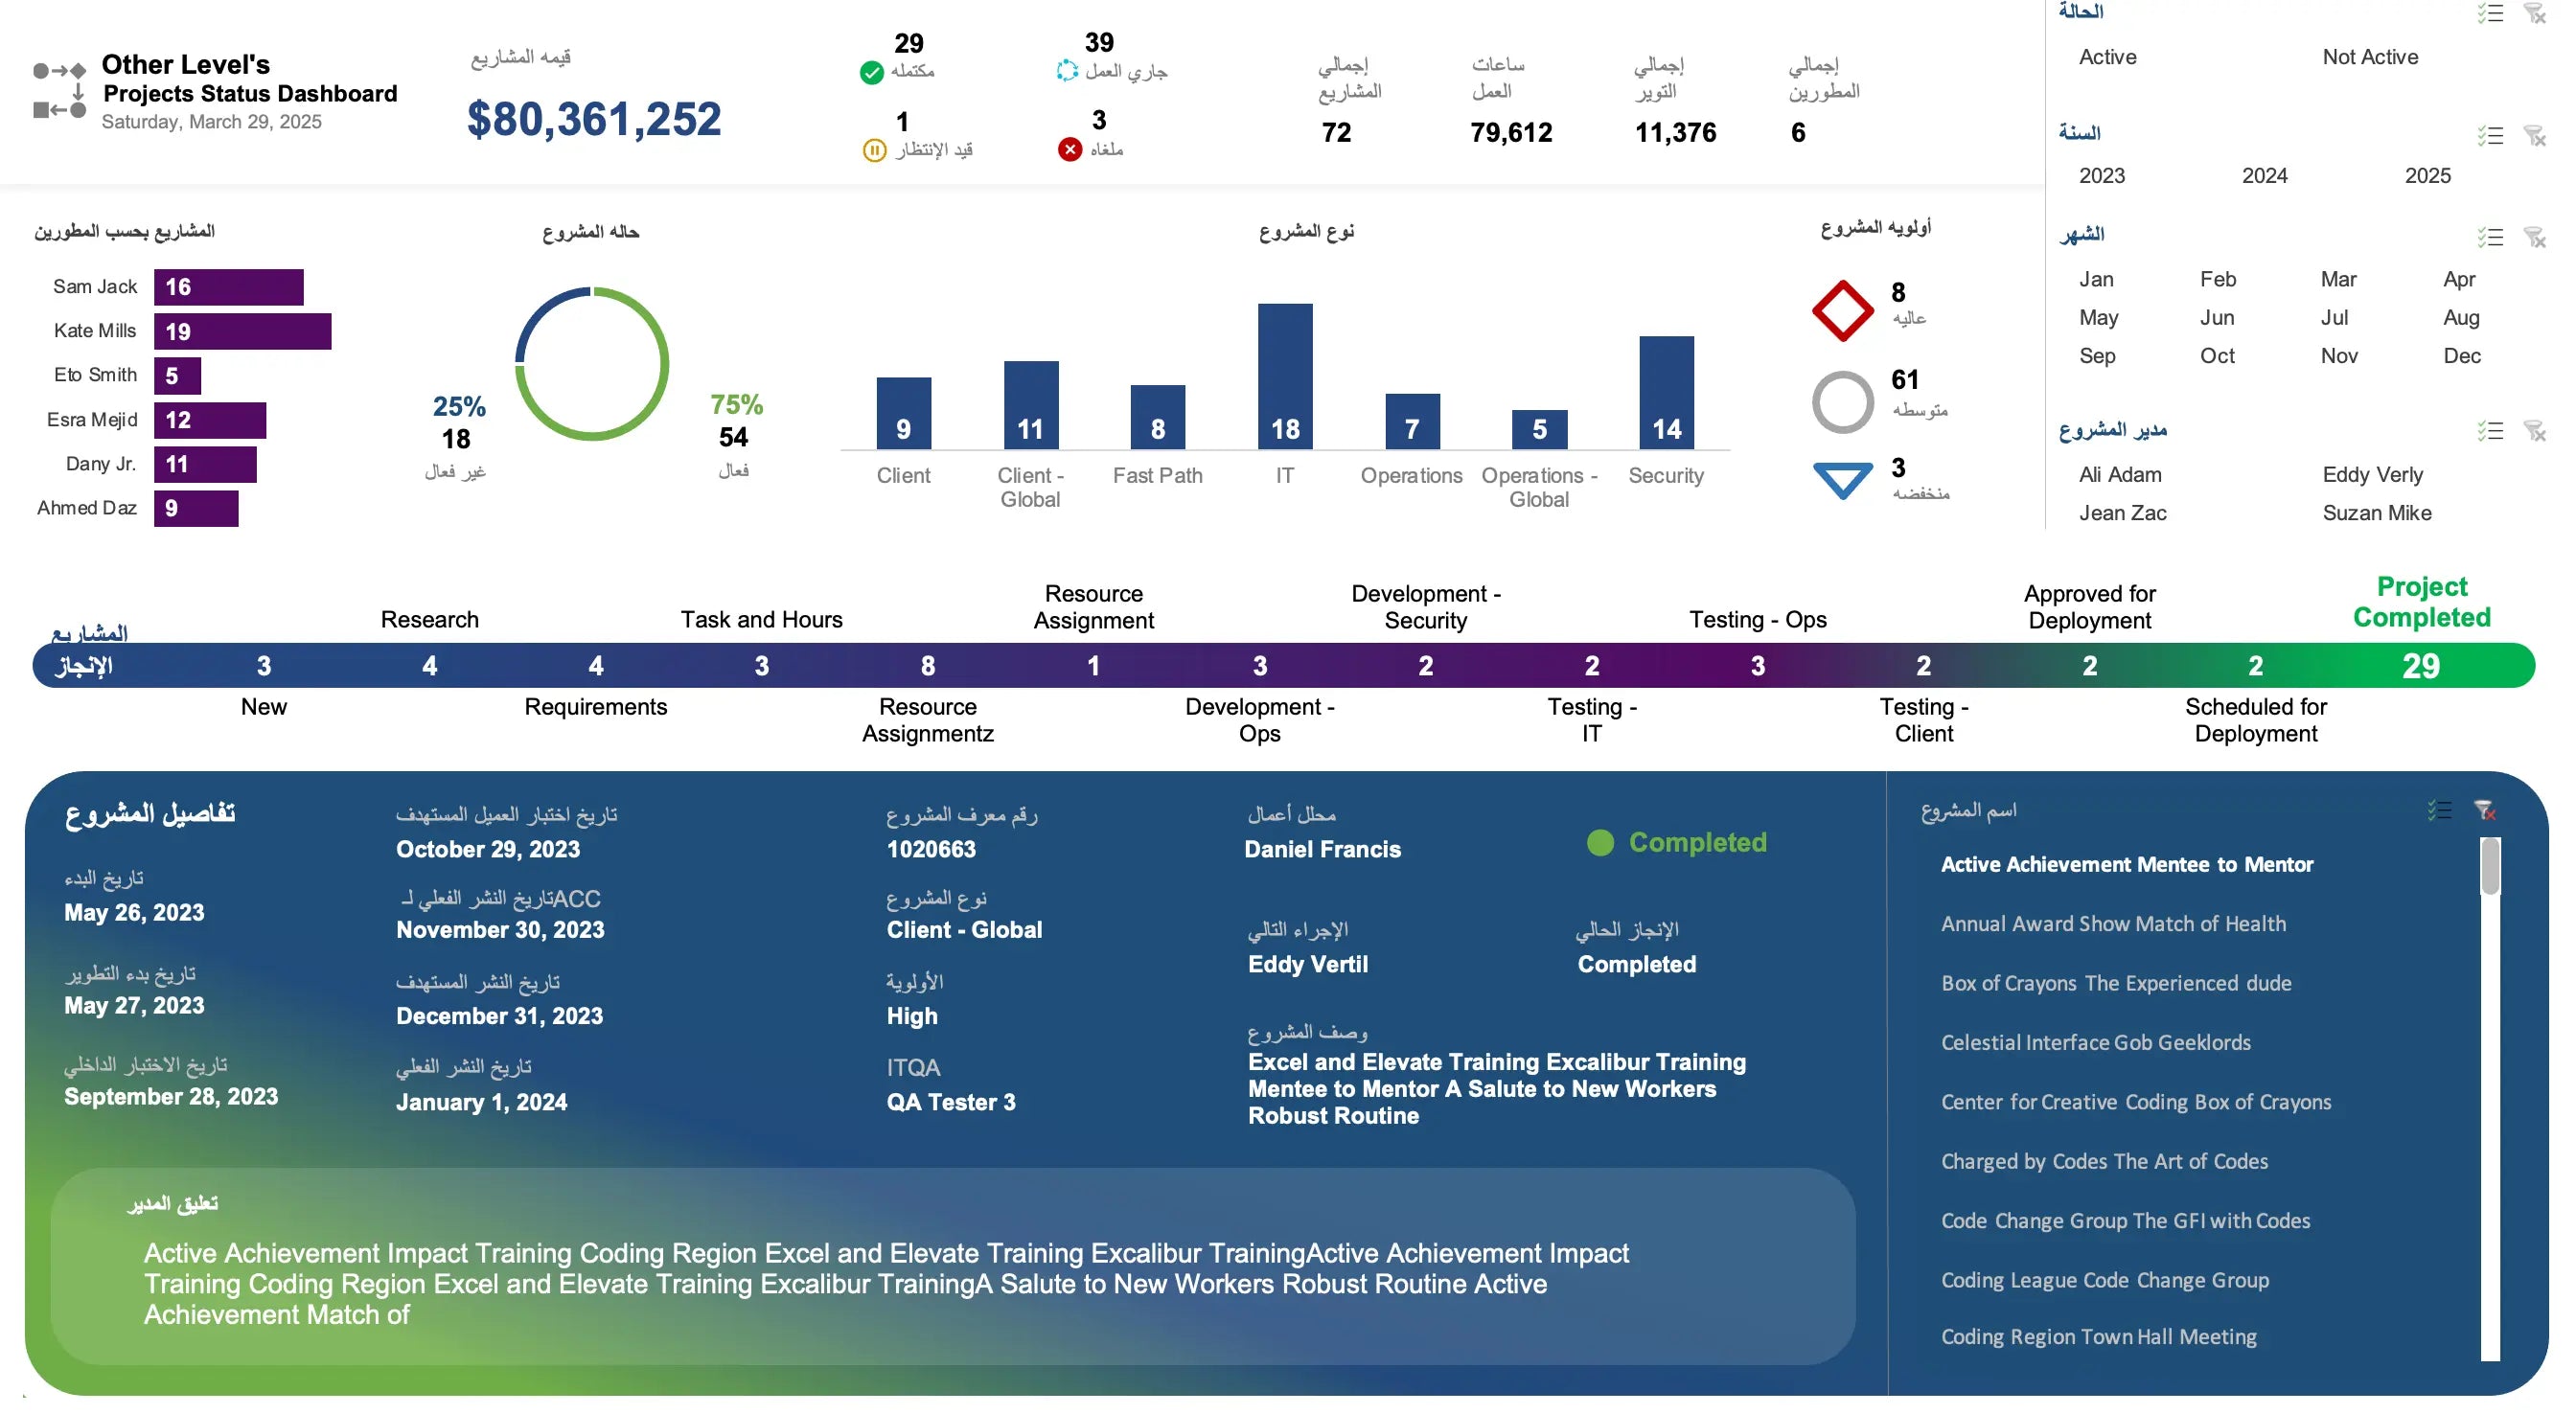
Can I order a product in any language?
Yes, we provide products in any language. Simply select the "Dashboard language change" Service and once your order is placed, you will receive it within 48 hours.
What happens if I choose the wrong monitor screen size for my dashboard?
If you choose the wrong screen size, the dashboard may not display correctly on your monitor. Elements could appear too large, too small, or misaligned, affecting the readability and usability of the dashboard. We recommend selecting the appropriate screen size to ensure optimal viewing and performance.
Do I need specific skills to use the advanced Excel dashboard templates?
Our advanced Excel dashboards are easy to use, the only thing you need to know is how to work with PivotTables. With basic knowledge of PivotTables, you'll be able to customize and fully utilize these templates effortlessly. "Please check the skill level required"
All dashboards are 100% editable Excel files. Learn how to use them through our video tutorials, included datasets, and lifetime access program.