✅ Instant Digital Delivery | 🔒 Secure Checkout | ⭐ Trusted by 1,000+ Professionals | 💬 24hr Support
Financial Statistics Excel Dashboard – Geographies and KPIs
Pairs well with
Financial Statistics Dashboard Overview
The Financial Statistics Dashboards System is a dynamic, modern solution that turns raw data into clear decisions. It’s built for analysts and managers who want fast insight without complexity. Open the file, connect your tables, and review trends, funnels, and portfolio flows in minutes with a polished Excel Dashboard.
What This Excel Dashboard Includes
Interactive reporting areas
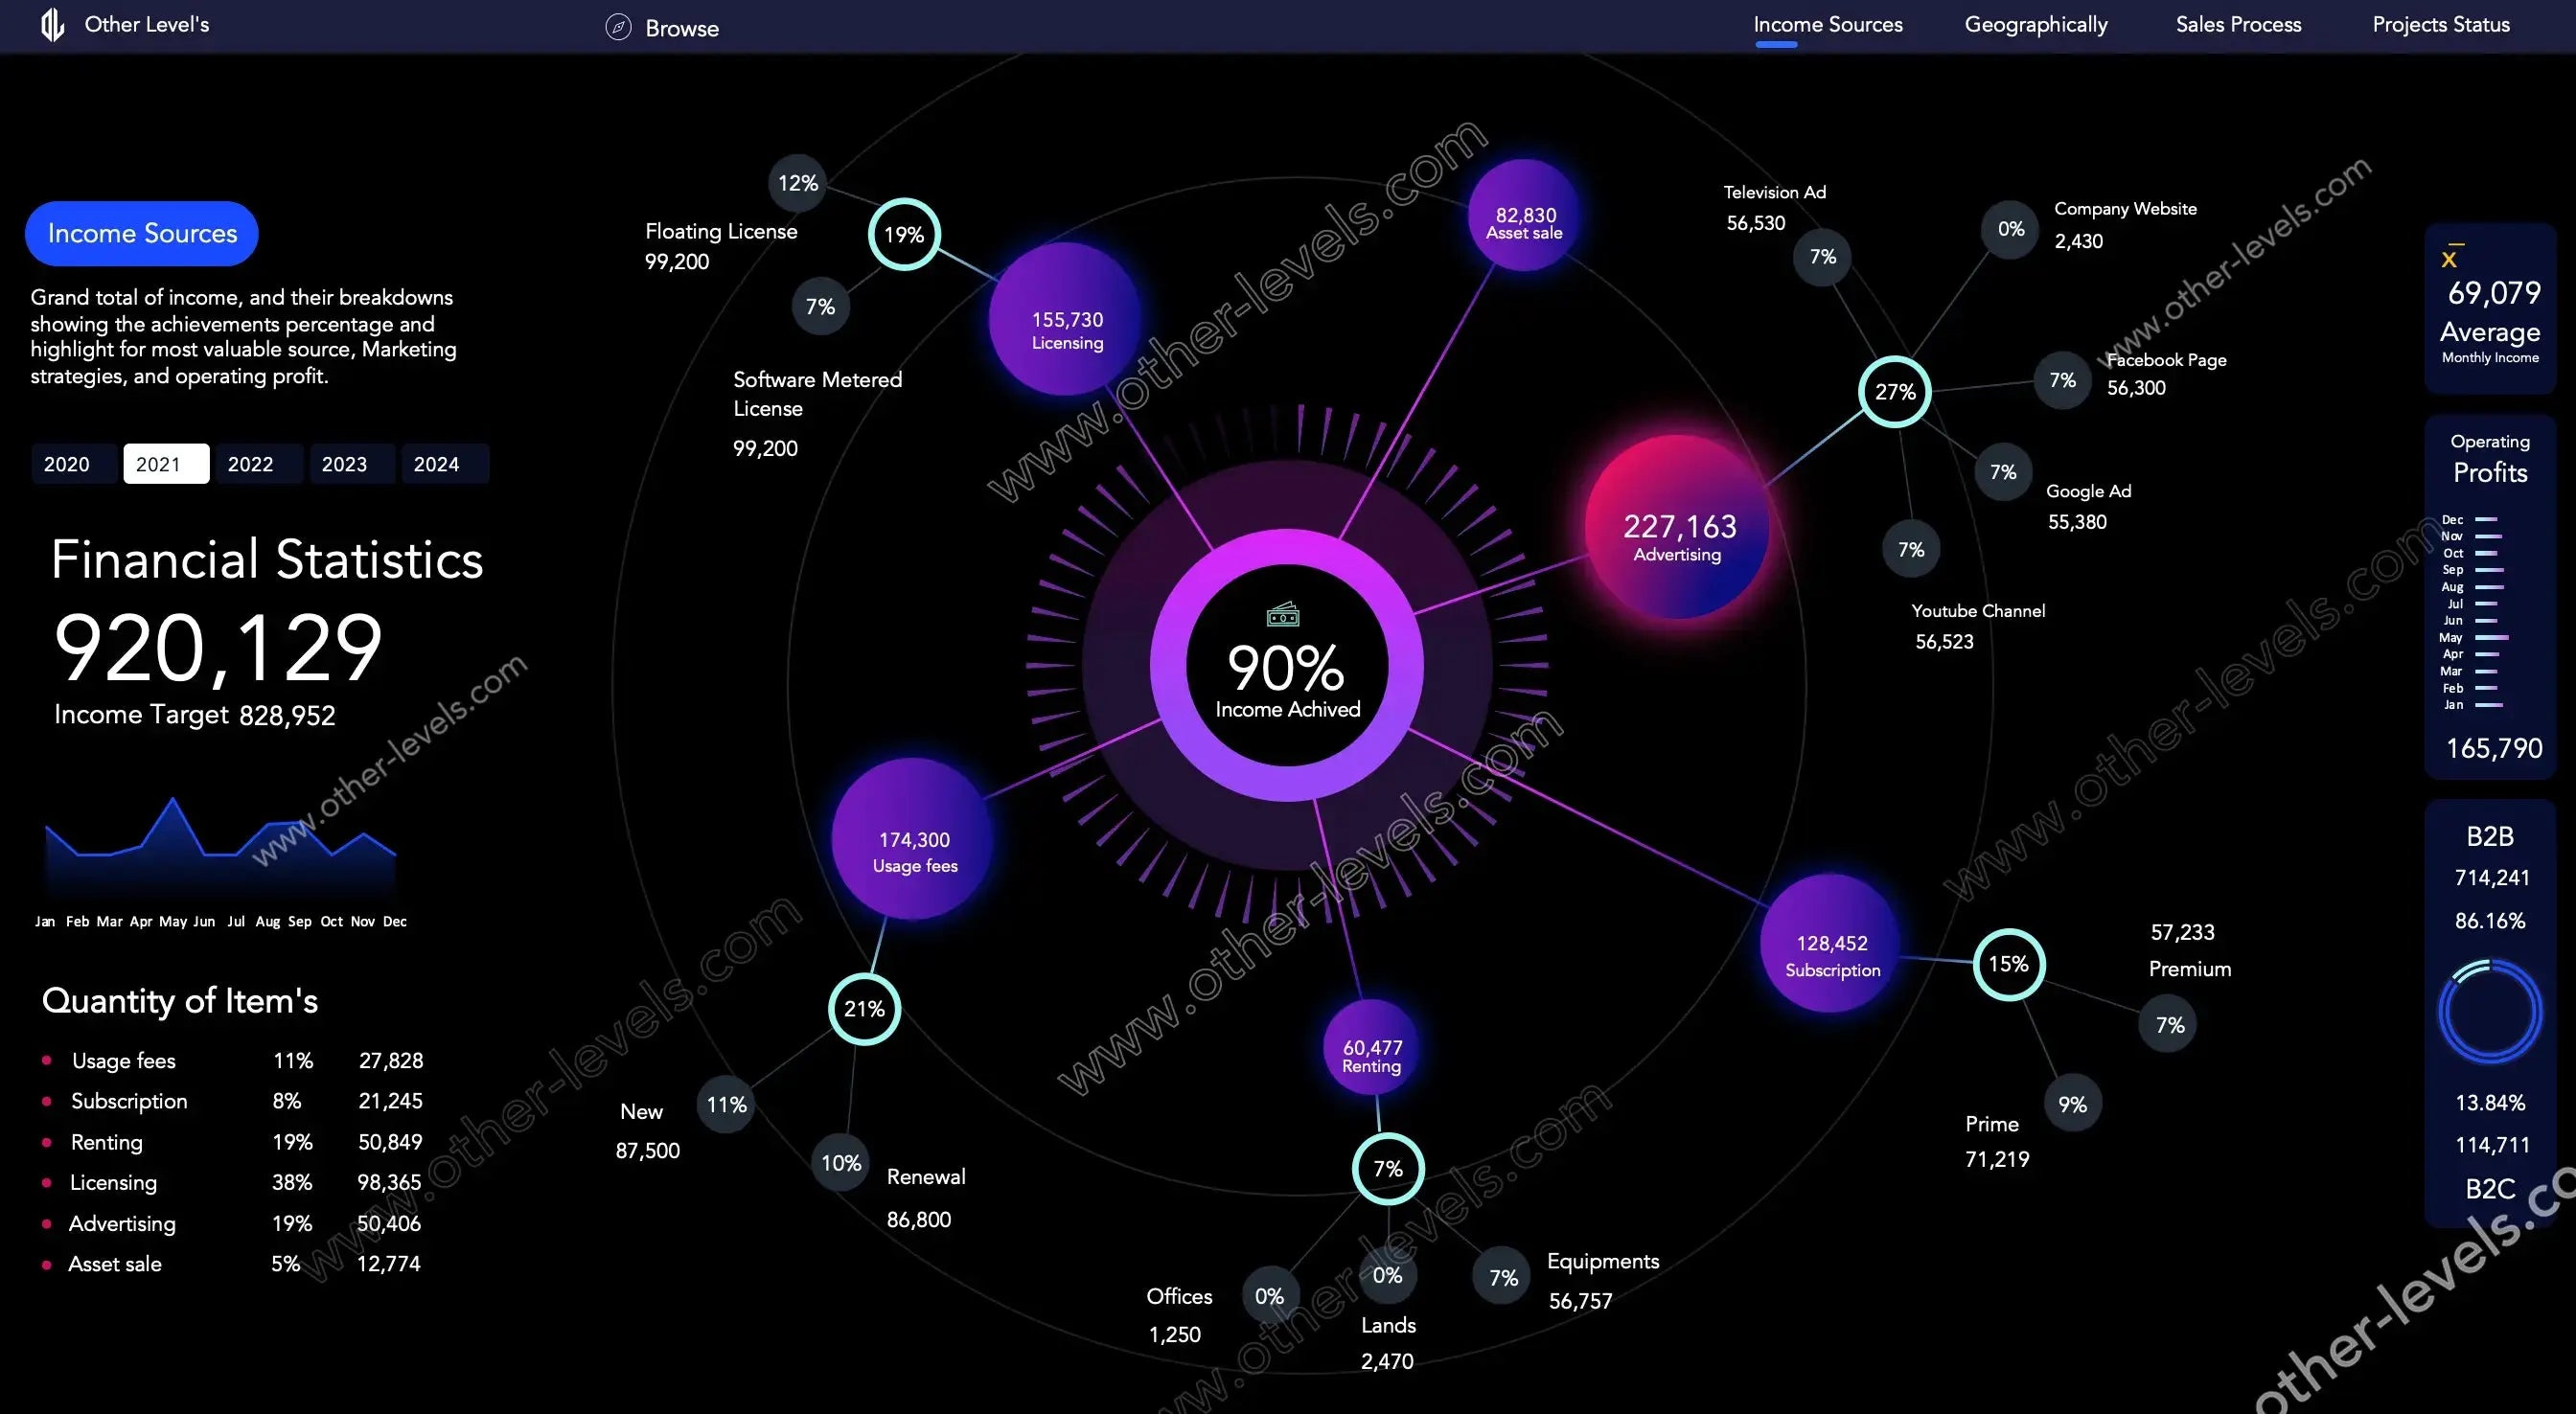
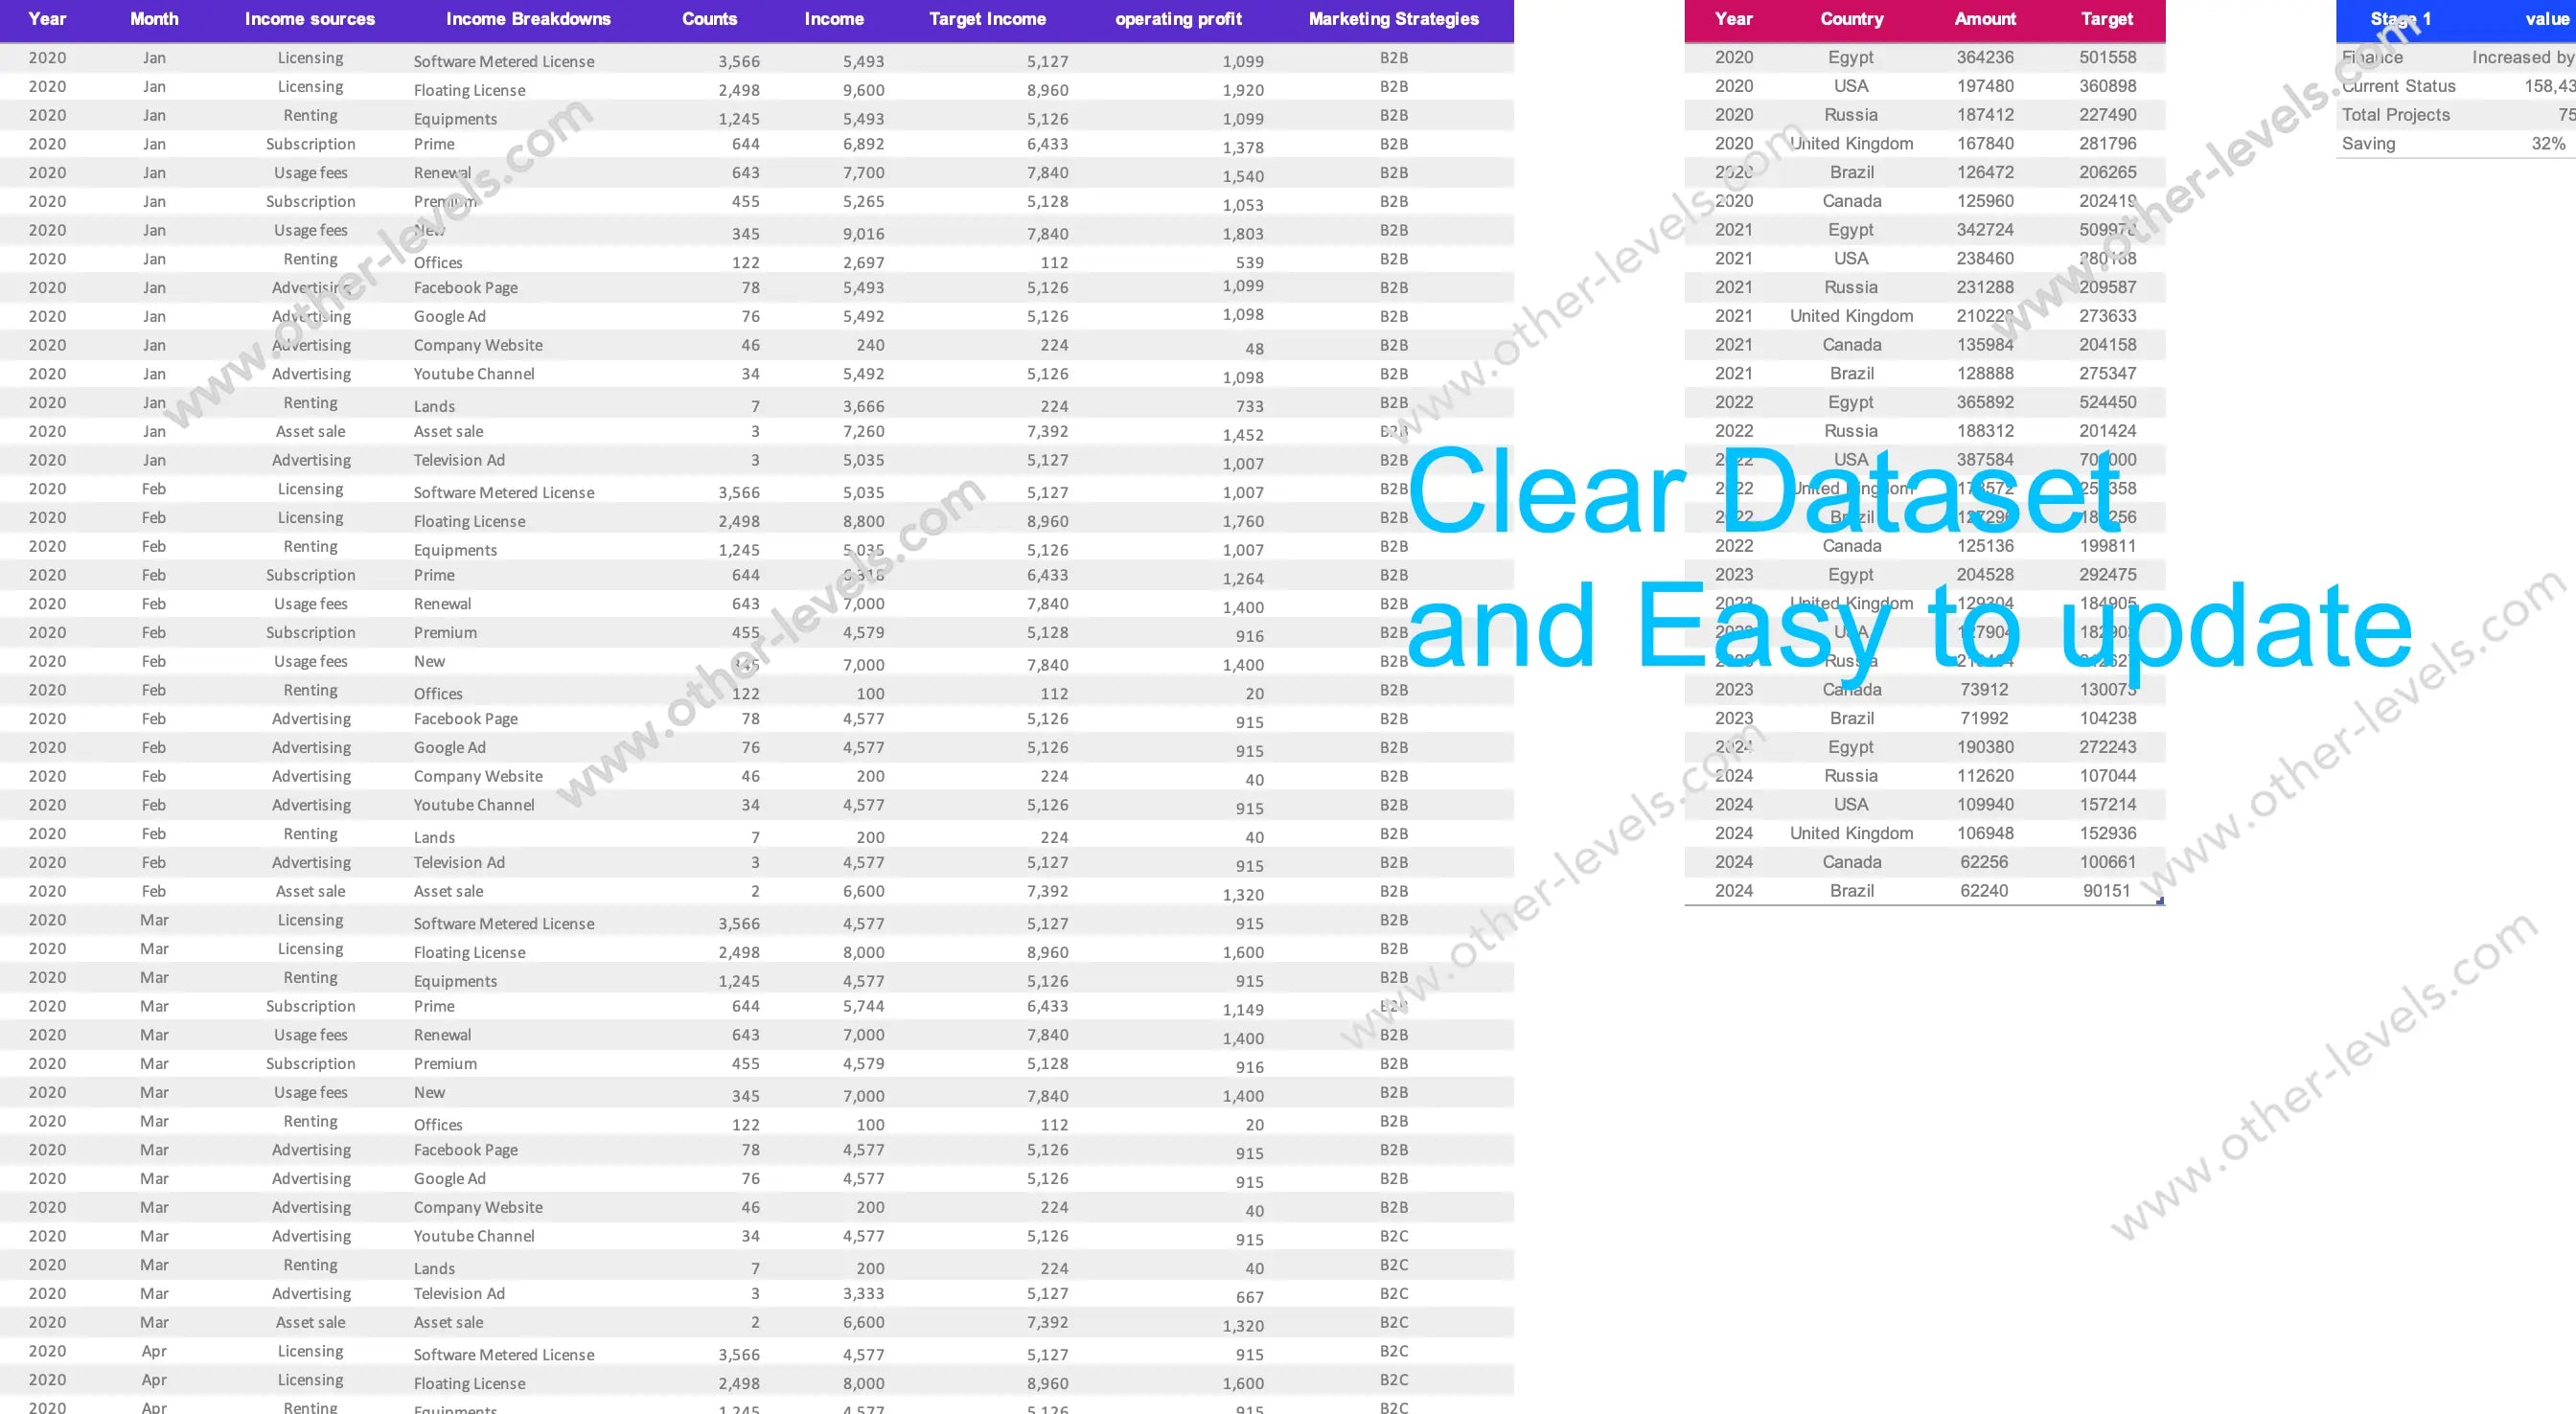
- Income Sources hub with radial bubbles and a progress gauge for target tracking.
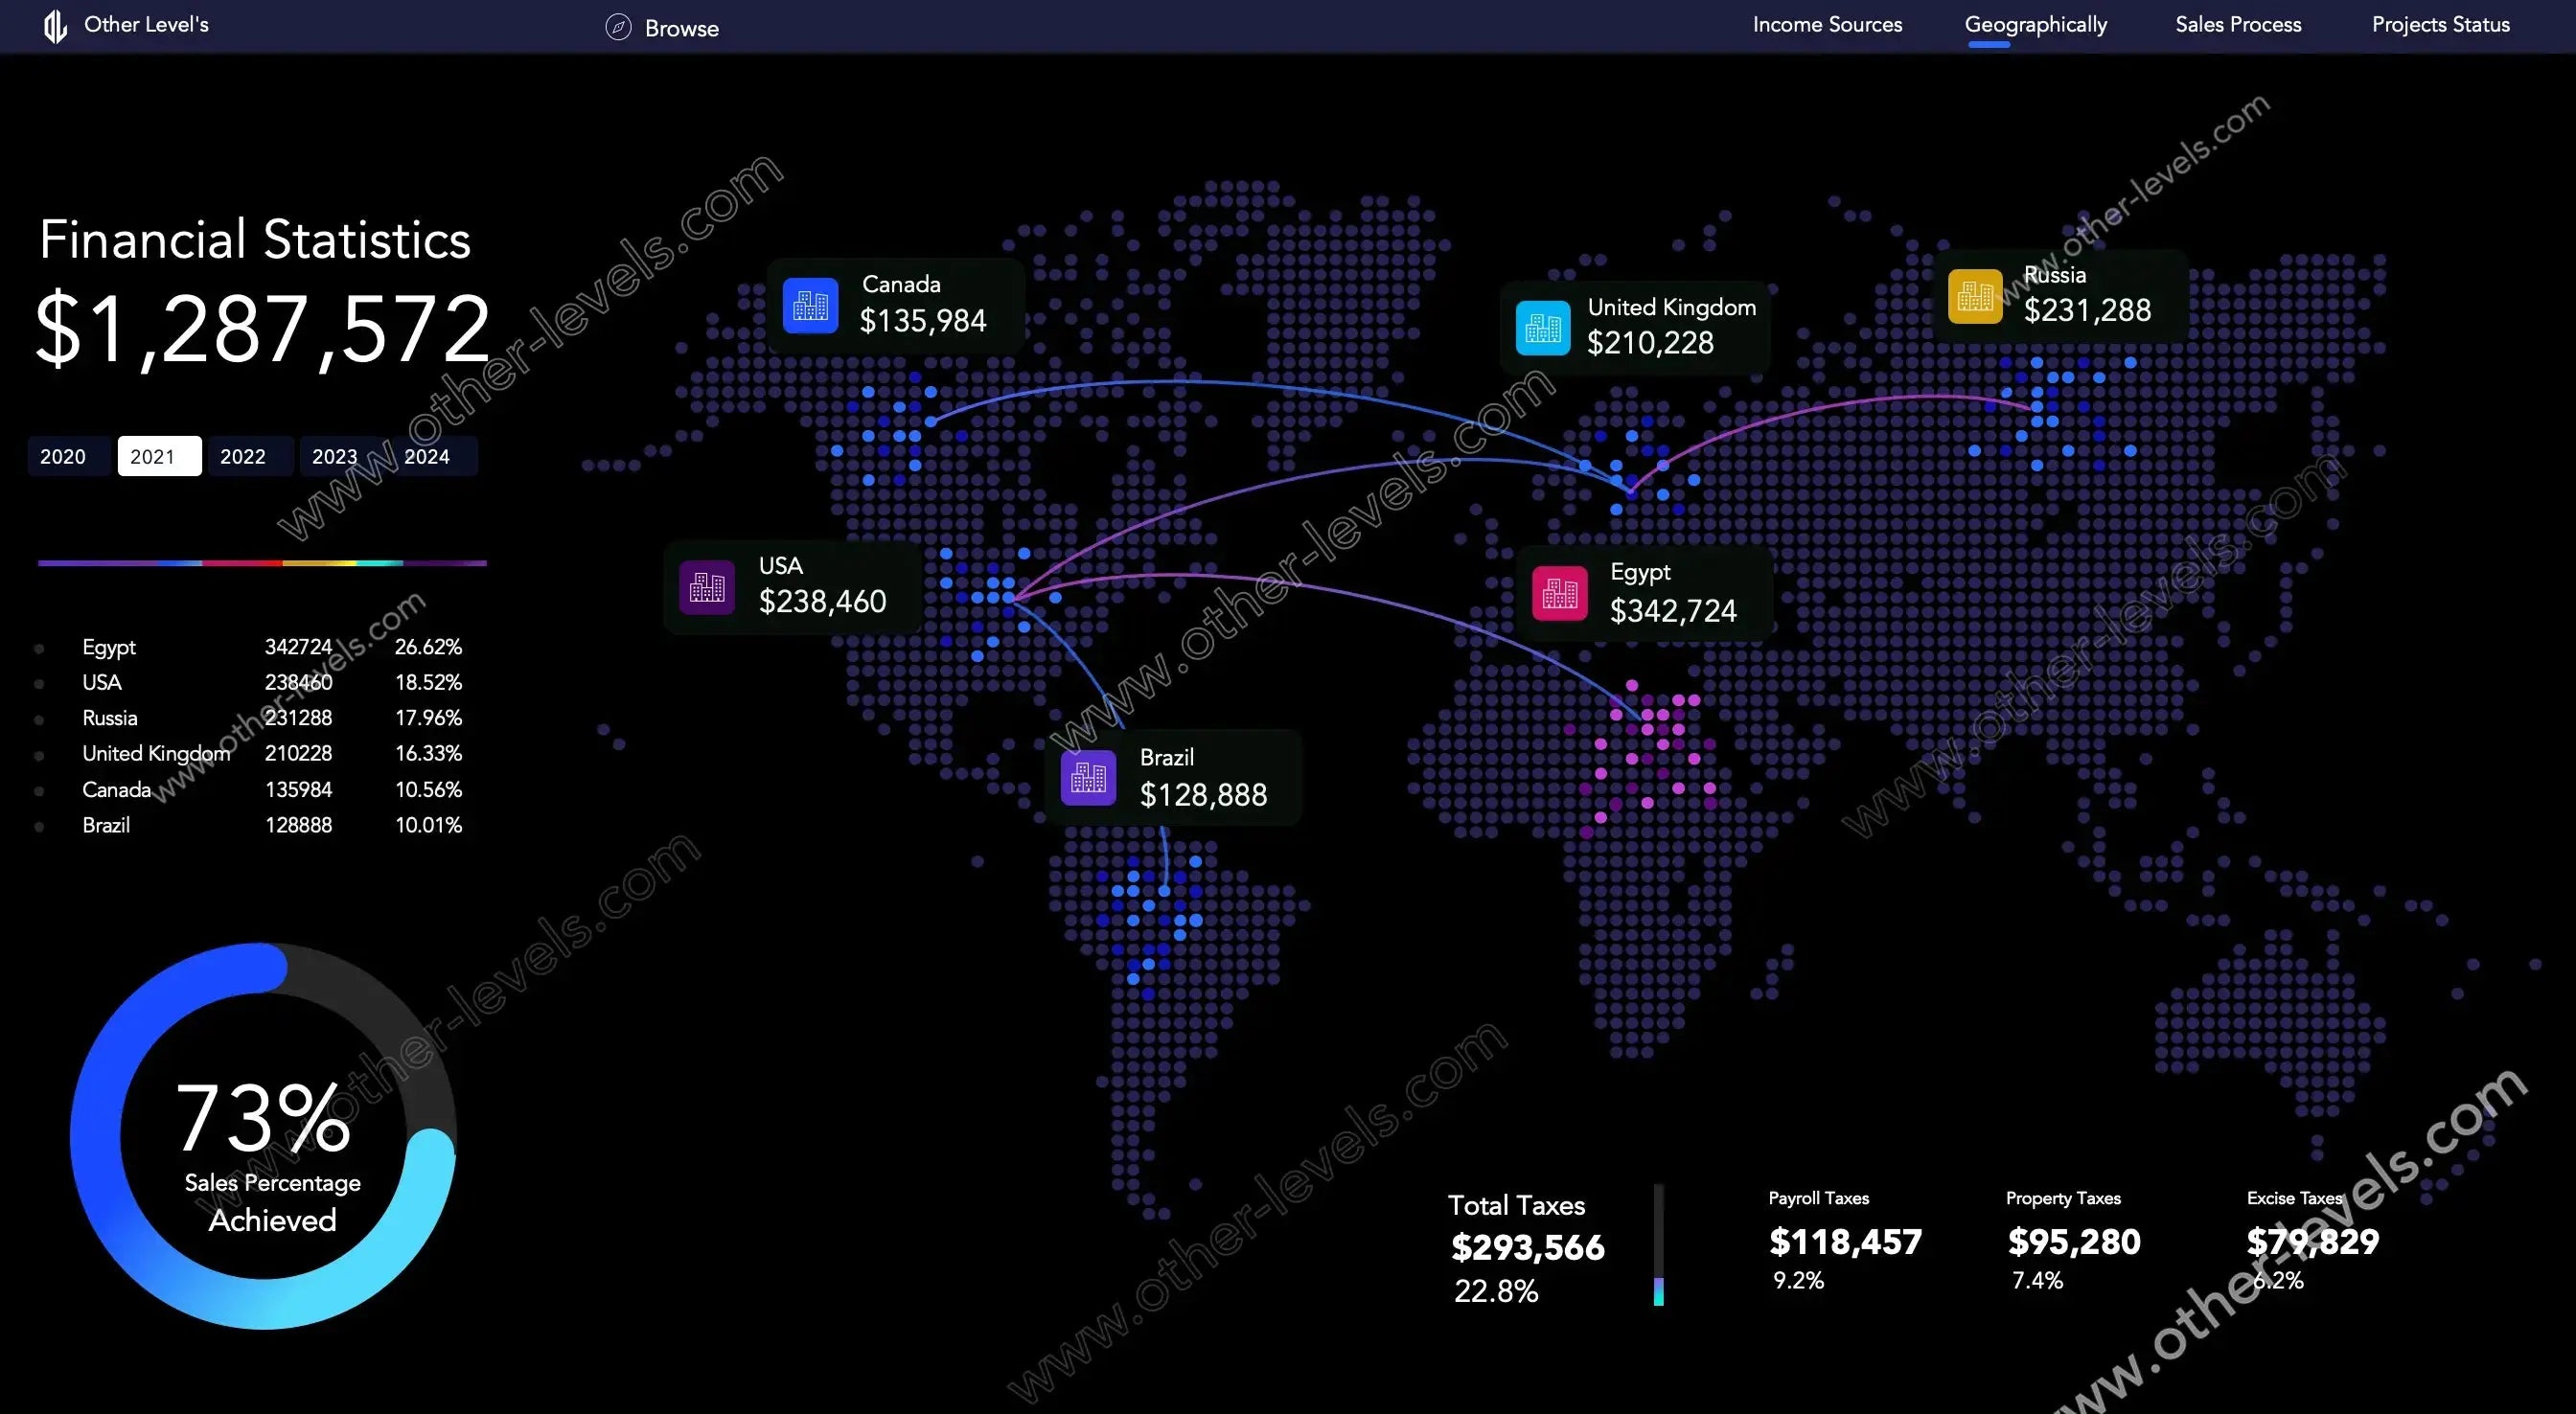
- Geographical map with country callouts and a contribution table for quick comparison.
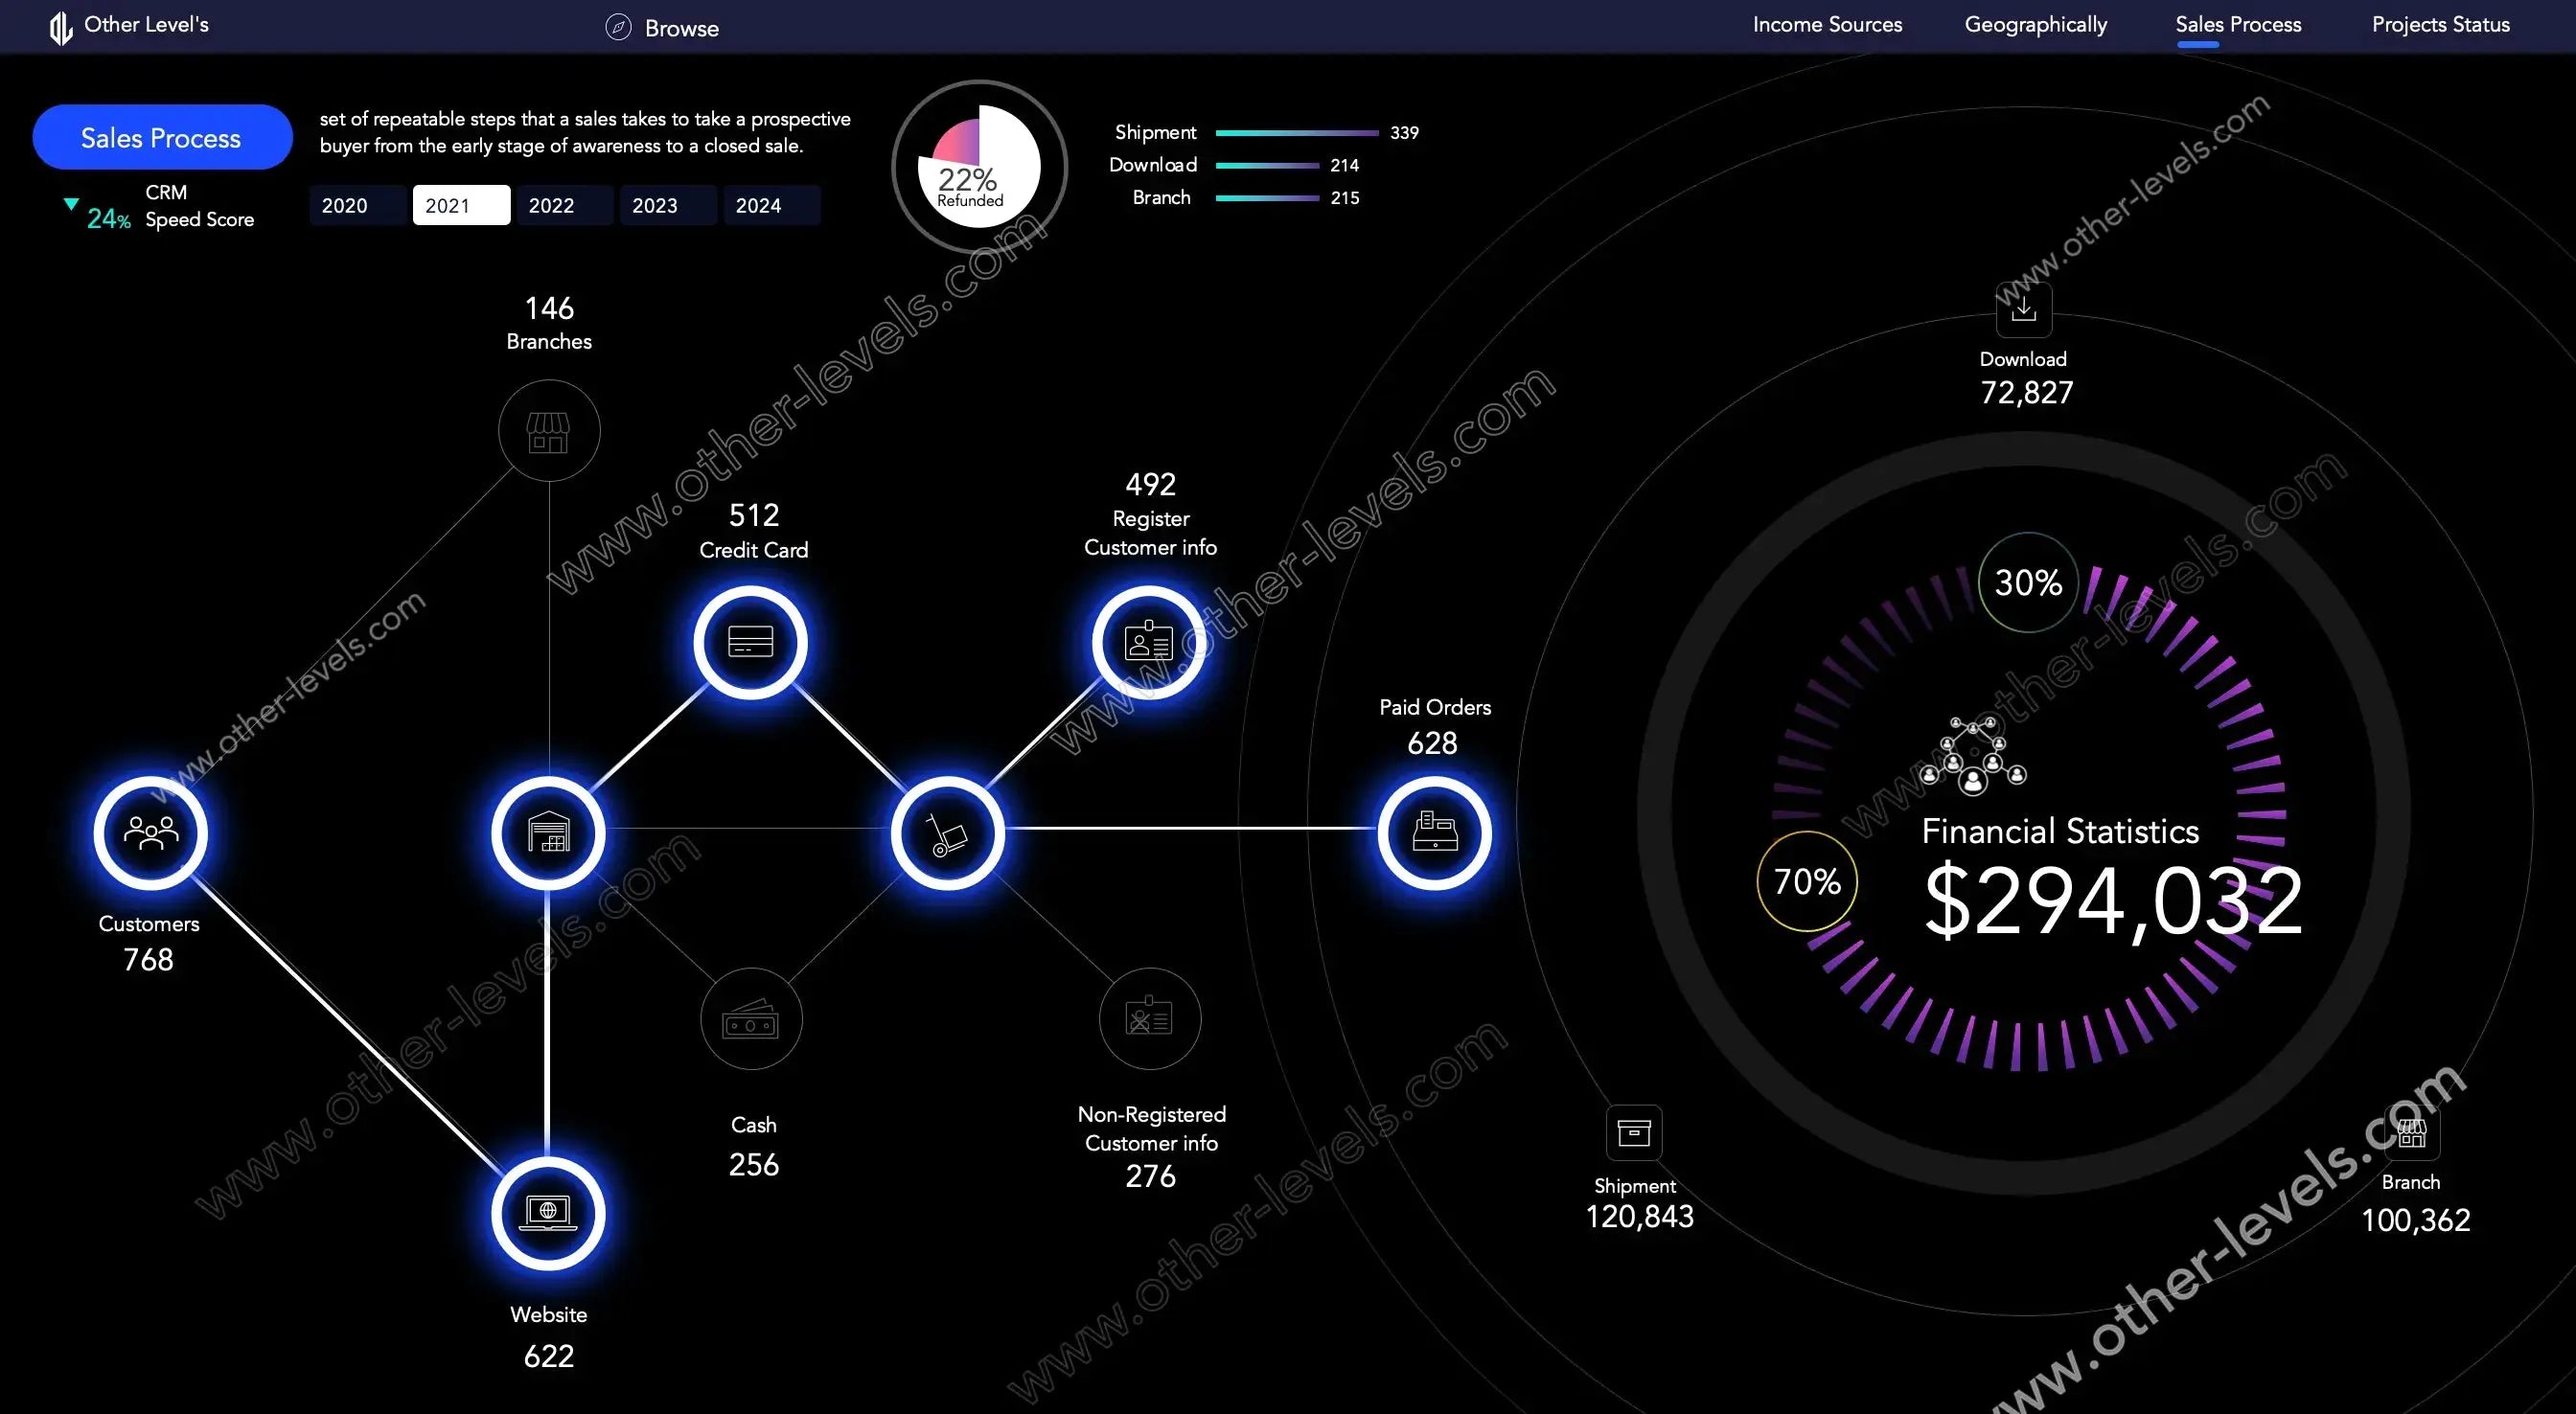
- Sales Process flow from visitors to paid orders and fulfillment, including refunds.
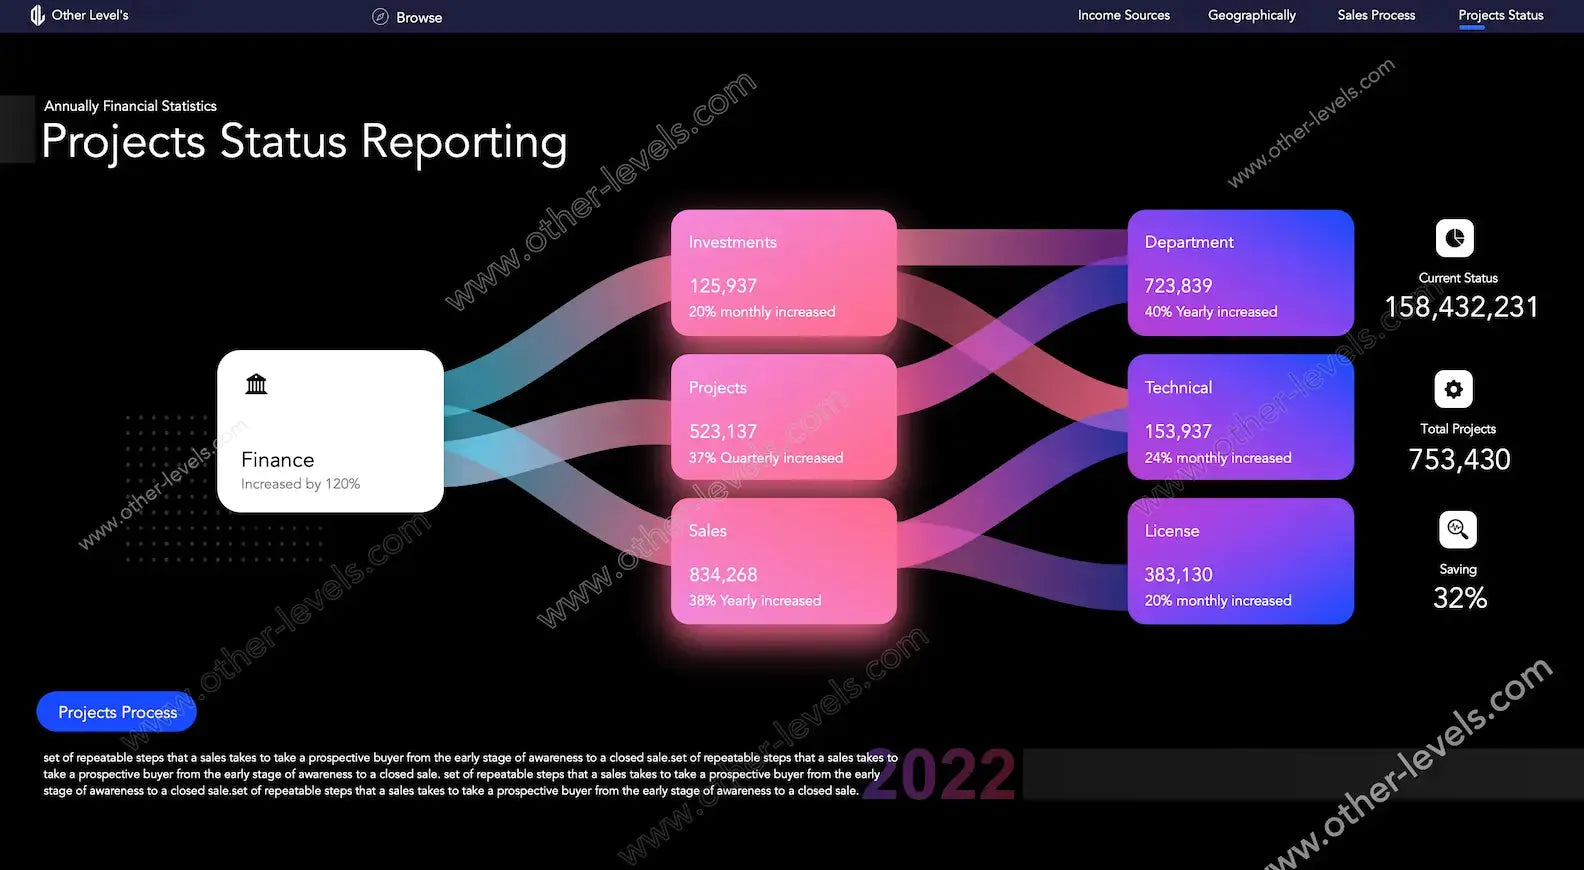
- Projects Status view using a clean, Sankey-style flow for portfolio movement.
Controls & usability
- Year slicers and quick navigation buttons between sections to speed analysis.
- KPI cards for totals, mix, and achievement percentages that highlight priorities.
- Consistent legend colors and accessible labels to keep insights readable.
How You’ll Use It
- Track income mix and marketing channels with an enterprise-ready Spreadsheet.
- See regional performance at a glance, spot outliers, and share findings quickly.
- Monitor funnel health, payment paths, and delivery modes over time.
- Review project flows and surface portfolio status in a concise, presentable view.
Specs & Files
- Ready-to-edit workbook with PivotTables, slicers, and clean page-level navigation.
- Dark theme, grouped charts, and icons designed for meetings and stakeholder decks.
- No add-ins required; optimized for standard desktop Excel with smooth performance.
Related Excel Dashboards
- Boost budgeting on the go with the Personal Finance Excel Dashboard – Excel Mobile Version .
- For deeper analytics and goal tracking, explore the Personal Finance Tracker Dashboard – Advanced Excel Tool .
Video Tutorial
Watch the full Financial Statistics Excel Dashboard tutorial on our Other Levels YouTube Channel
Specifications
Get all essential details in one place. From features and package contents to software compatibility and skill level required, this section gives you a clear overview so you know exactly what to expect before download.
Template Features
Package Details
Software Compatibility
Skill Level Required
Advanced
FAQs
Please read our FAQs page to find out more.
Are the templates fully customizable?
Yes, all our templates are fully customizable. You can adjust the layout, data, and design elements to fit your specific needs. Our templates are designed to be flexible, allowing you to easily tailor them to your preferences.
Can I order a product in any language?
Yes, we provide products in any language. Simply select the "Dashboard language change" Service and once your order is placed, you will receive it within 48 hours.
What happens if I choose the wrong monitor screen size for my dashboard?
If you choose the wrong screen size, the dashboard may not display correctly on your monitor. Elements could appear too large, too small, or misaligned, affecting the readability and usability of the dashboard. We recommend selecting the appropriate screen size to ensure optimal viewing and performance.
Do I need specific skills to use the advanced Excel dashboard templates?
Our advanced Excel dashboards are easy to use, the only thing you need to know is how to work with PivotTables. With basic knowledge of PivotTables, you'll be able to customize and fully utilize these templates effortlessly. "Please check the skill level required"
All dashboards are 100% editable Excel files. Learn how to use them through our video tutorials, included datasets, and lifetime access program.