✅ Instant Digital Delivery | 🔒 Secure Checkout | ⭐ Trusted by 1,000+ Professionals | 💬 24hr Support
Advanced Property Management Excel Dashboard - Wholesale Real Estate
Pairs well with
Advanced Property Management Excel Dashboard and Wholesale Real Estate
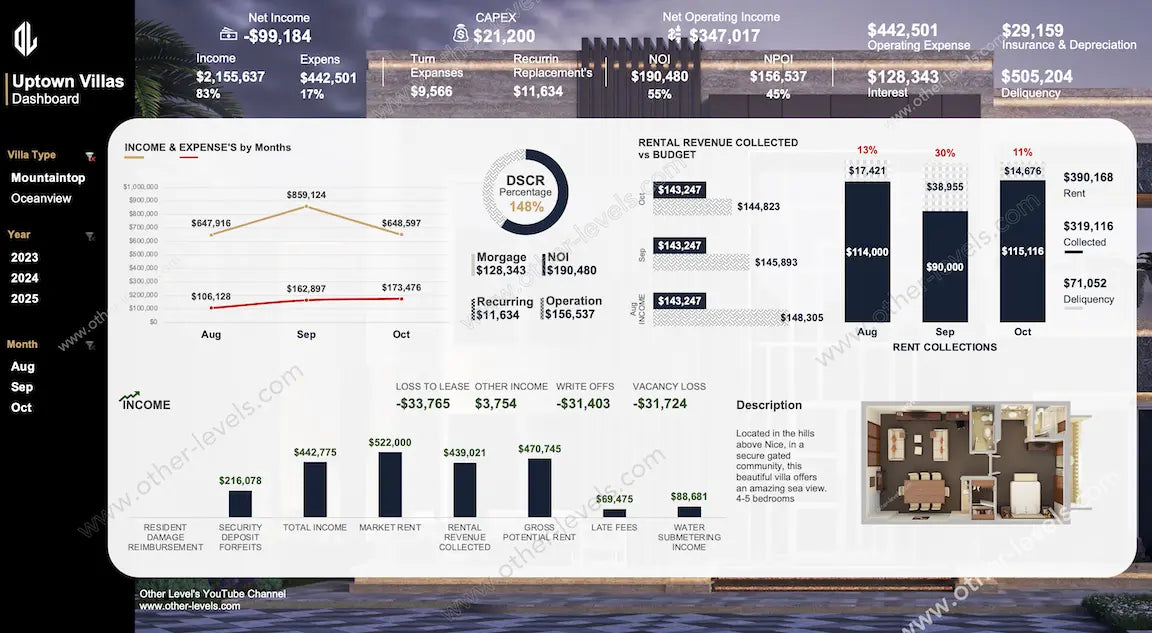
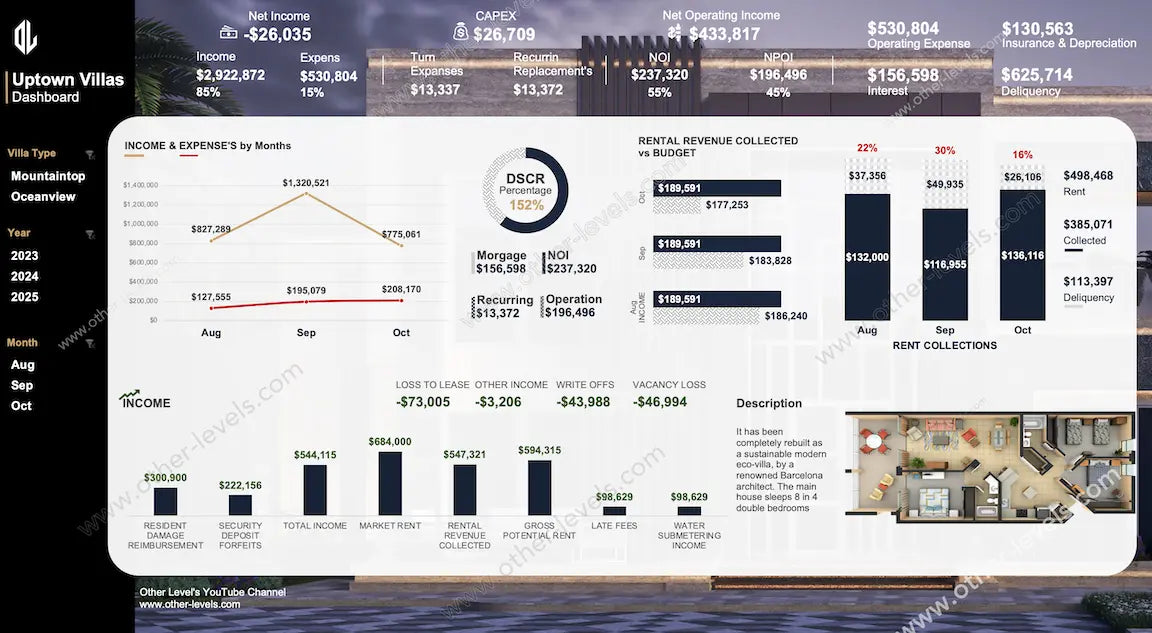
The Excel Dashboard in this property template gives managers and investors a fast, balanced view of portfolio health. Select a villa type, year, or month and every KPI updates instantly. It’s built for teams in advanced property management and wholesale real estate who want clear visuals without digging through raw tables.
A concise executive band summarizes performance while focused visuals tell the story. You’ll track income vs expenses, monitor net operating income, and compare rental revenue to budget. Each view stays readable in meetings and printable for investor updates, supporting buy/hold/sell conversations across assets.
What’s inside
- Top KPI cards for NOI, operating expense mix, CAPEX, delinquency, and collections.
- Monthly trend lines that compare income vs expenses at a glance.
- Clustered bars for rental revenue vs budget with quick variance cues.
- Donut KPI for DSCR with callouts that explain the moving parts.
- Category columns showing a practical breakdown of income statement.
- Tiles for loss-to-lease, vacancy loss, write-offs, and other adjustments.
Analysis modules
- Collections Health: Track progress, spot shortfalls, and plan follow-ups.
- NOI Focus: Manage operating expenses and defend margins.
- Leasing Reality: Use the rent roll context to assess occupancy impact.
- Budget Discipline: Compare actuals to targets by month or period.
Why teams like it
- Fast slicers for Villa Type, Year, and Month.
- Clean visuals that work in stakeholder decks.
- Refreshable model that scales with more properties or months.
Use cases
- Weekly operations huddles and owner updates.
- Wholesale underwriting snapshots and disposition reviews.
- Quarterly sessions where DSCR, NOI, and collections live on one screen.
Specs
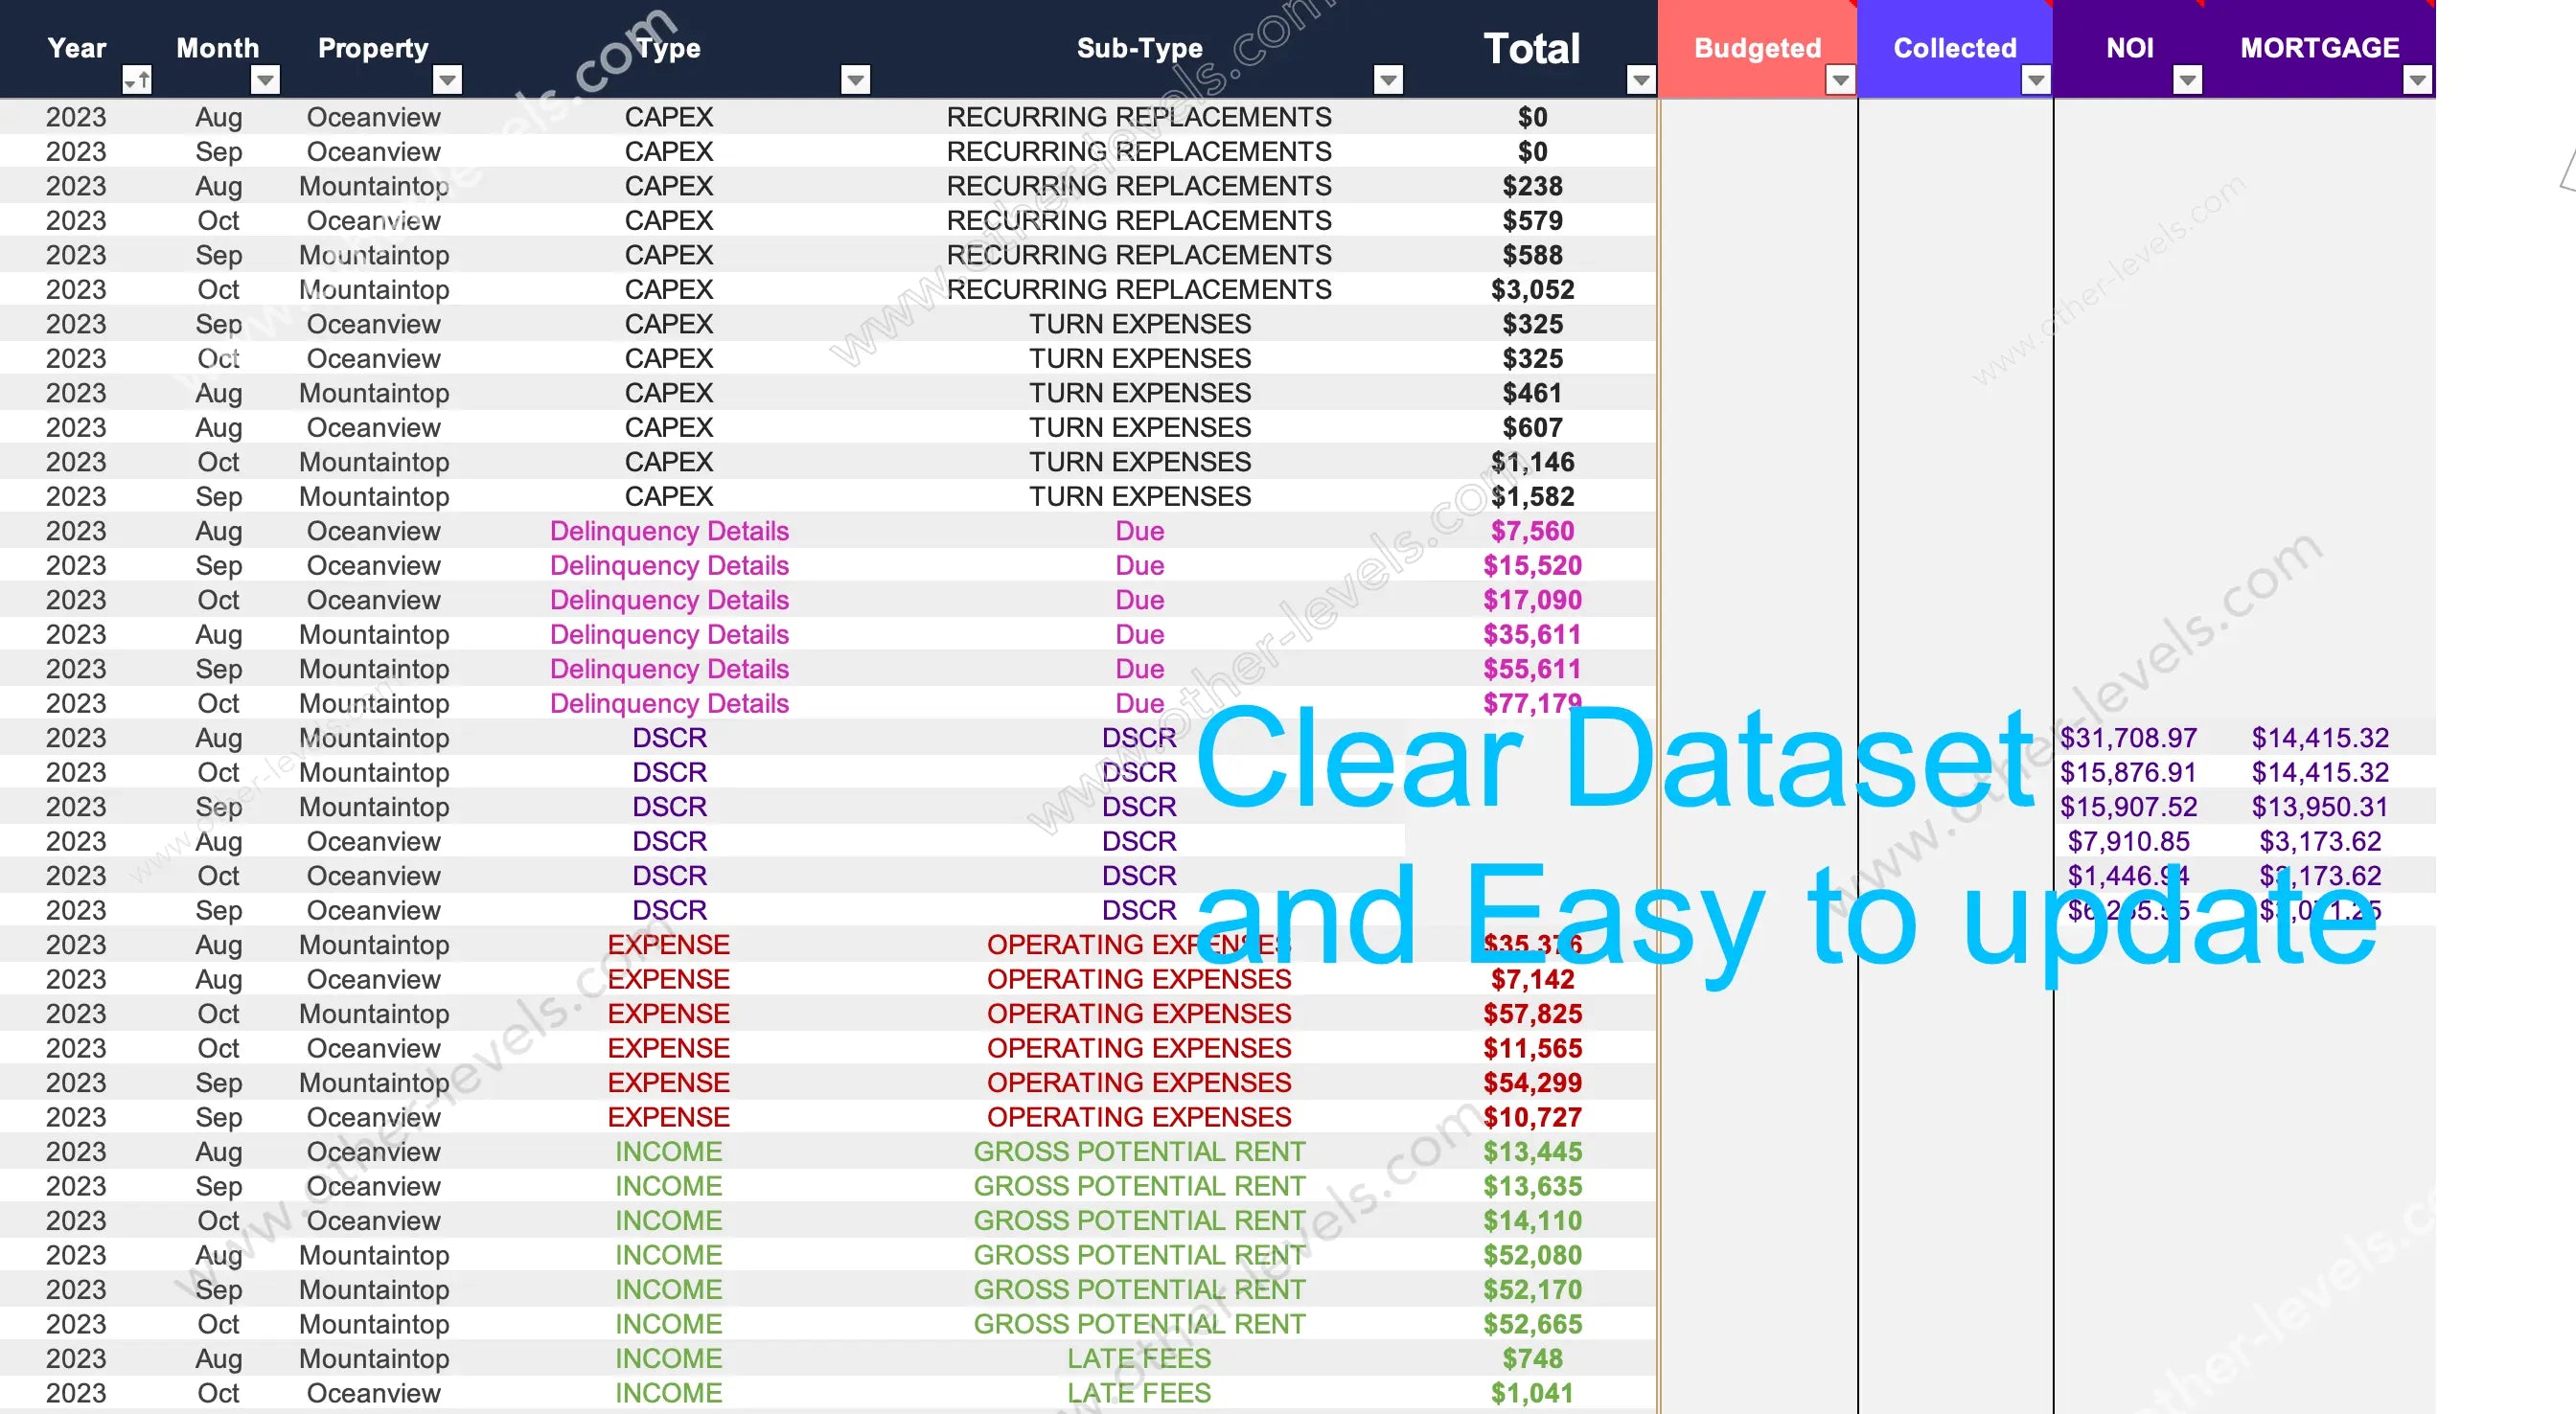
- Excel-based; powered by PivotTables and Power Query.
- Slicers drive instant filtering across modules.
- Print-ready, presentation-friendly layout for portfolio and unit views.
Related dashboards
- School Management Excel Dashboard for Education Analytics
- School Management Dashboard with Dynamic Top 3 Student Photos
Video tutorial
Watch the full Real Estate Excel Dashboard tutorial on our Other Levels YouTube Channel
Specifications
Get all essential details in one place. From features and package contents to software compatibility and skill level required, this section gives you a clear overview so you know exactly what to expect before download.
Template Features
Package Details
Software Compatibility
Skill Level Required
Beginner
FAQs
Please read our FAQs page to find out more.
Are the templates fully customizable?
Yes, all our templates are fully customizable. You can adjust the layout, data, and design elements to fit your specific needs. Our templates are designed to be flexible, allowing you to easily tailor them to your preferences.
Can I order a product in any language?
Yes, we provide products in any language. Simply select the "Dashboard language change" Service and once your order is placed, you will receive it within 48 hours.
What happens if I choose the wrong monitor screen size for my dashboard?
If you choose the wrong screen size, the dashboard may not display correctly on your monitor. Elements could appear too large, too small, or misaligned, affecting the readability and usability of the dashboard. We recommend selecting the appropriate screen size to ensure optimal viewing and performance.
Do I need specific skills to use the advanced Excel dashboard templates?
Our advanced Excel dashboards are easy to use, the only thing you need to know is how to work with PivotTables. With basic knowledge of PivotTables, you'll be able to customize and fully utilize these templates effortlessly. "Please check the skill level required"
All dashboards are 100% editable Excel files. Learn how to use them through our video tutorials, included datasets, and lifetime access program.