✅ Instant Digital Delivery | 🔒 Secure Checkout | ⭐ Trusted by 1,000+ Professionals | 💬 24hr Support
Student Management Excel Dashboard – Manage School Projects
Pairs well with
Student Management Excel Dashboard to Manage School Projects Overview
This presentation-ready Excel Dashboard turns scattered school data into a single, clear view. If you’ve wondered how to manage a school successfully without juggling multiple spreadsheets, this template brings the essentials—attendance, courses, exams, events, learning hours, and enrollment—onto one page so leaders act fast and teams stay aligned.
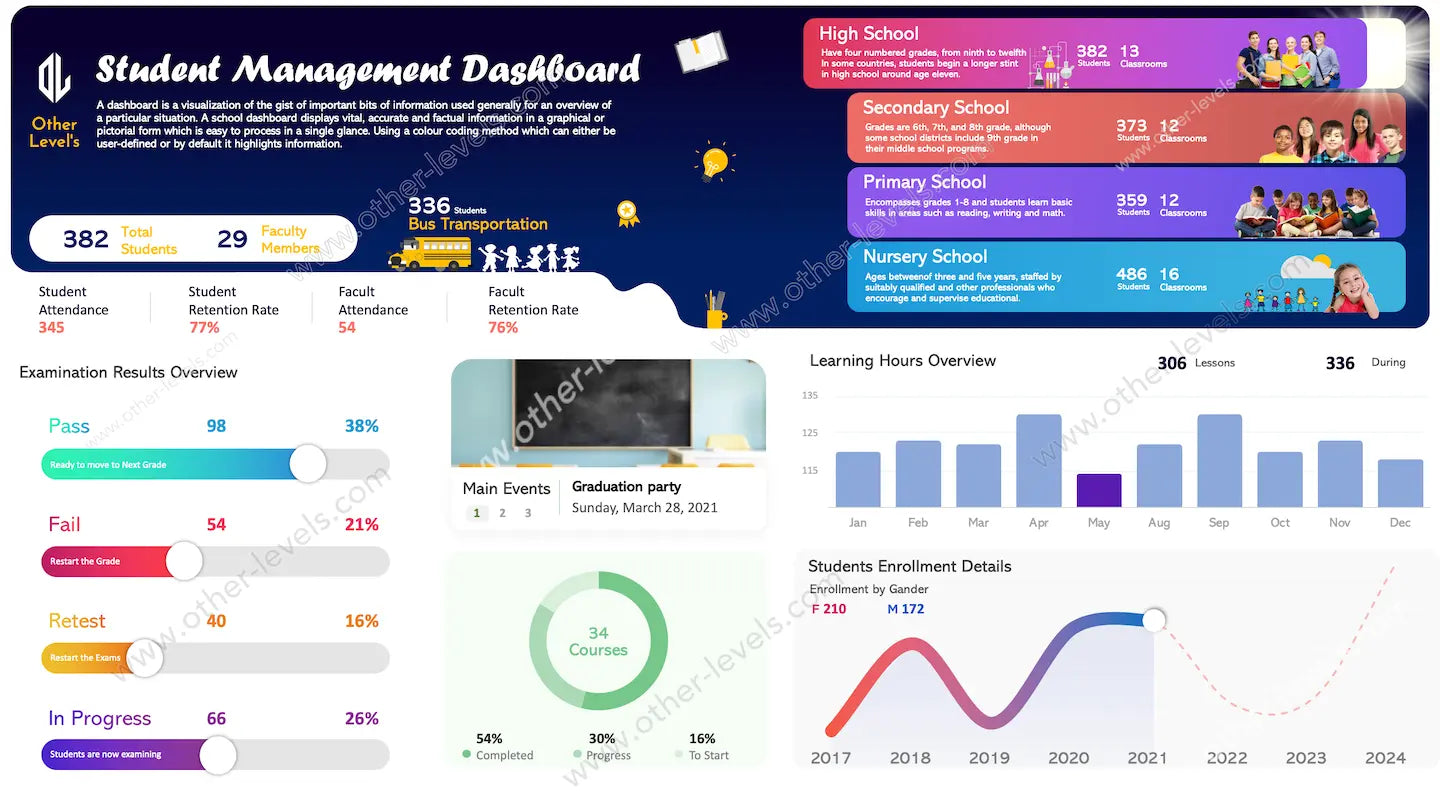
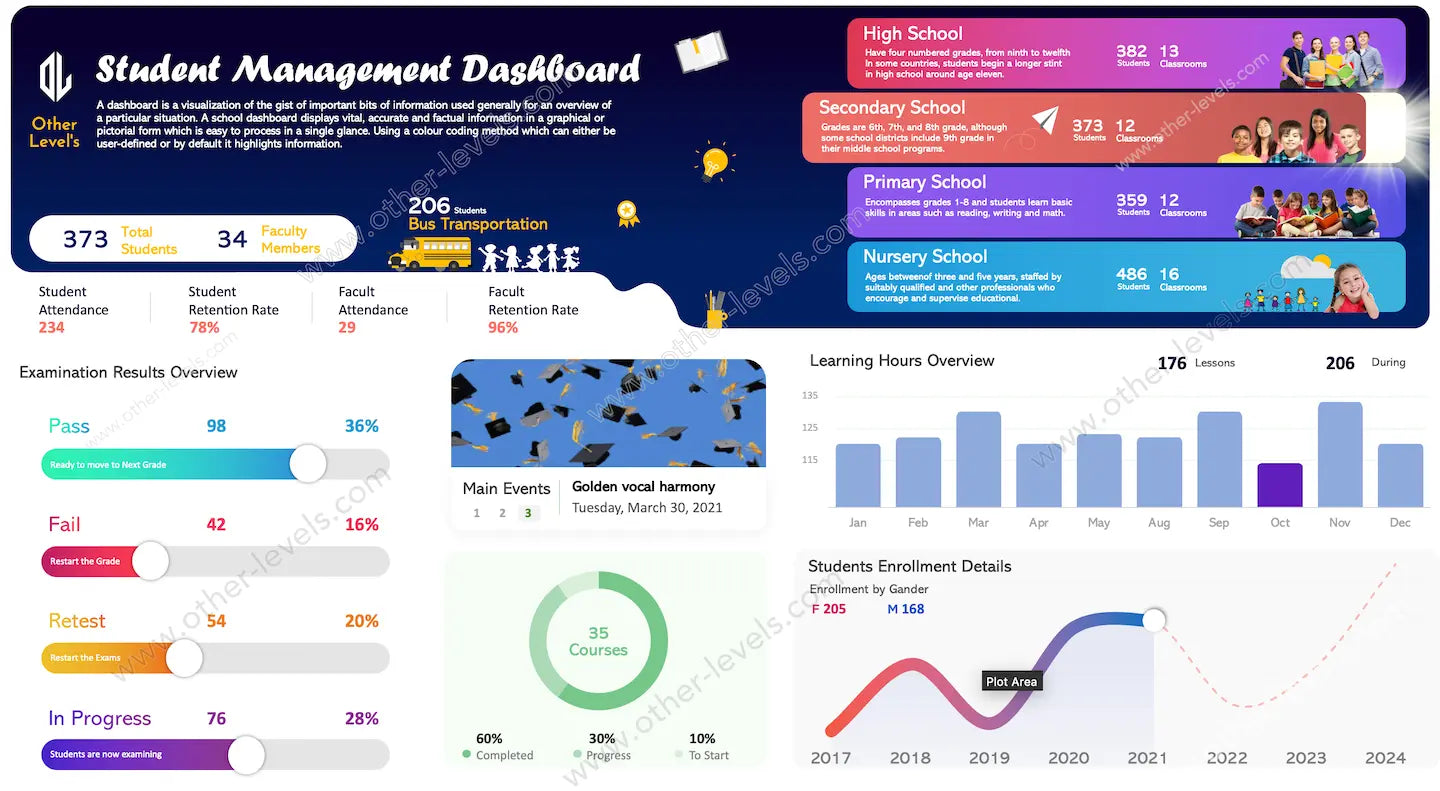
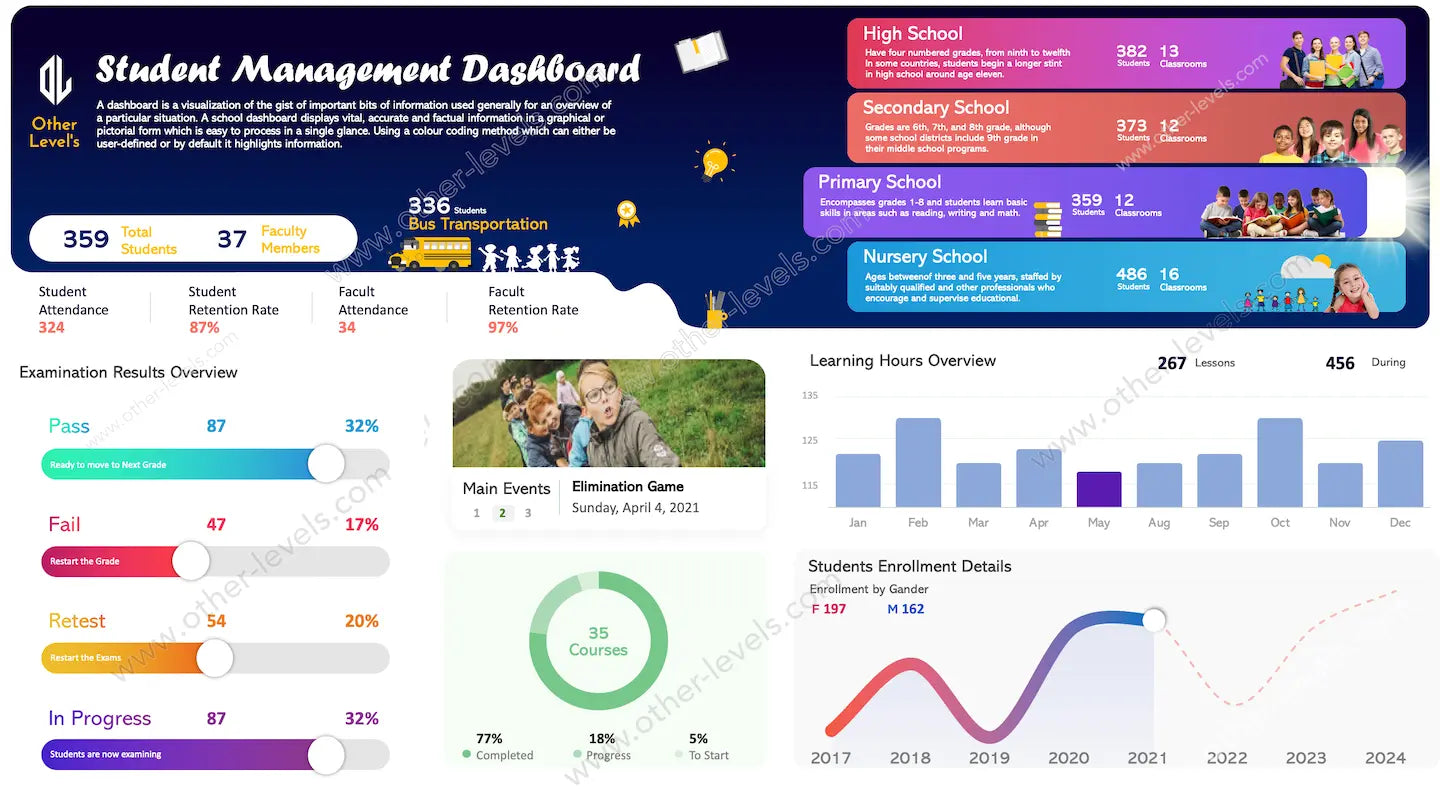
What you can see at a glance
The layout is built for people first. Leadership gets instant signal; coordinators and teachers get context to act. It supports student management, tracks student enrollment trends, and shows curriculum execution in a clean, meeting-ready canvas suitable from nursery to a performing arts high school.
KPI blocks & status strips
- Bold KPI cards for students, faculty, transport, and lessons for quick health checks.
- Attendance and retention strips compare learners and staff for stability and engagement.
- Exam pipeline bars highlight pass, fail, retest, and in-progress states for clear follow-ups.
Charts that tell the story
- Monthly column chart for learning hours to plan resources and timetables.
- Donut chart for course status to monitor completed, in progress, and upcoming work.
- Yearly line chart with forward view for enrollment to guide capacity decisions.
- School-level summary cards (Nursery to High) to balance classrooms and staff.
How it helps you manage school projects
Program leads get a single board to coordinate tasks and reviews—perfect when you need how to manage school projects guidance in practice. Leadership can export a concise view that doubles as a school performance fact sheet for board or parent meetings. It also fits data analytics for schools, light higher education analytics, and broader analytics for education use cases. For student success coaching, tie updates to routines covering time management for college students goals. Business-oriented academies and a school for business management program can track outcomes side by side.
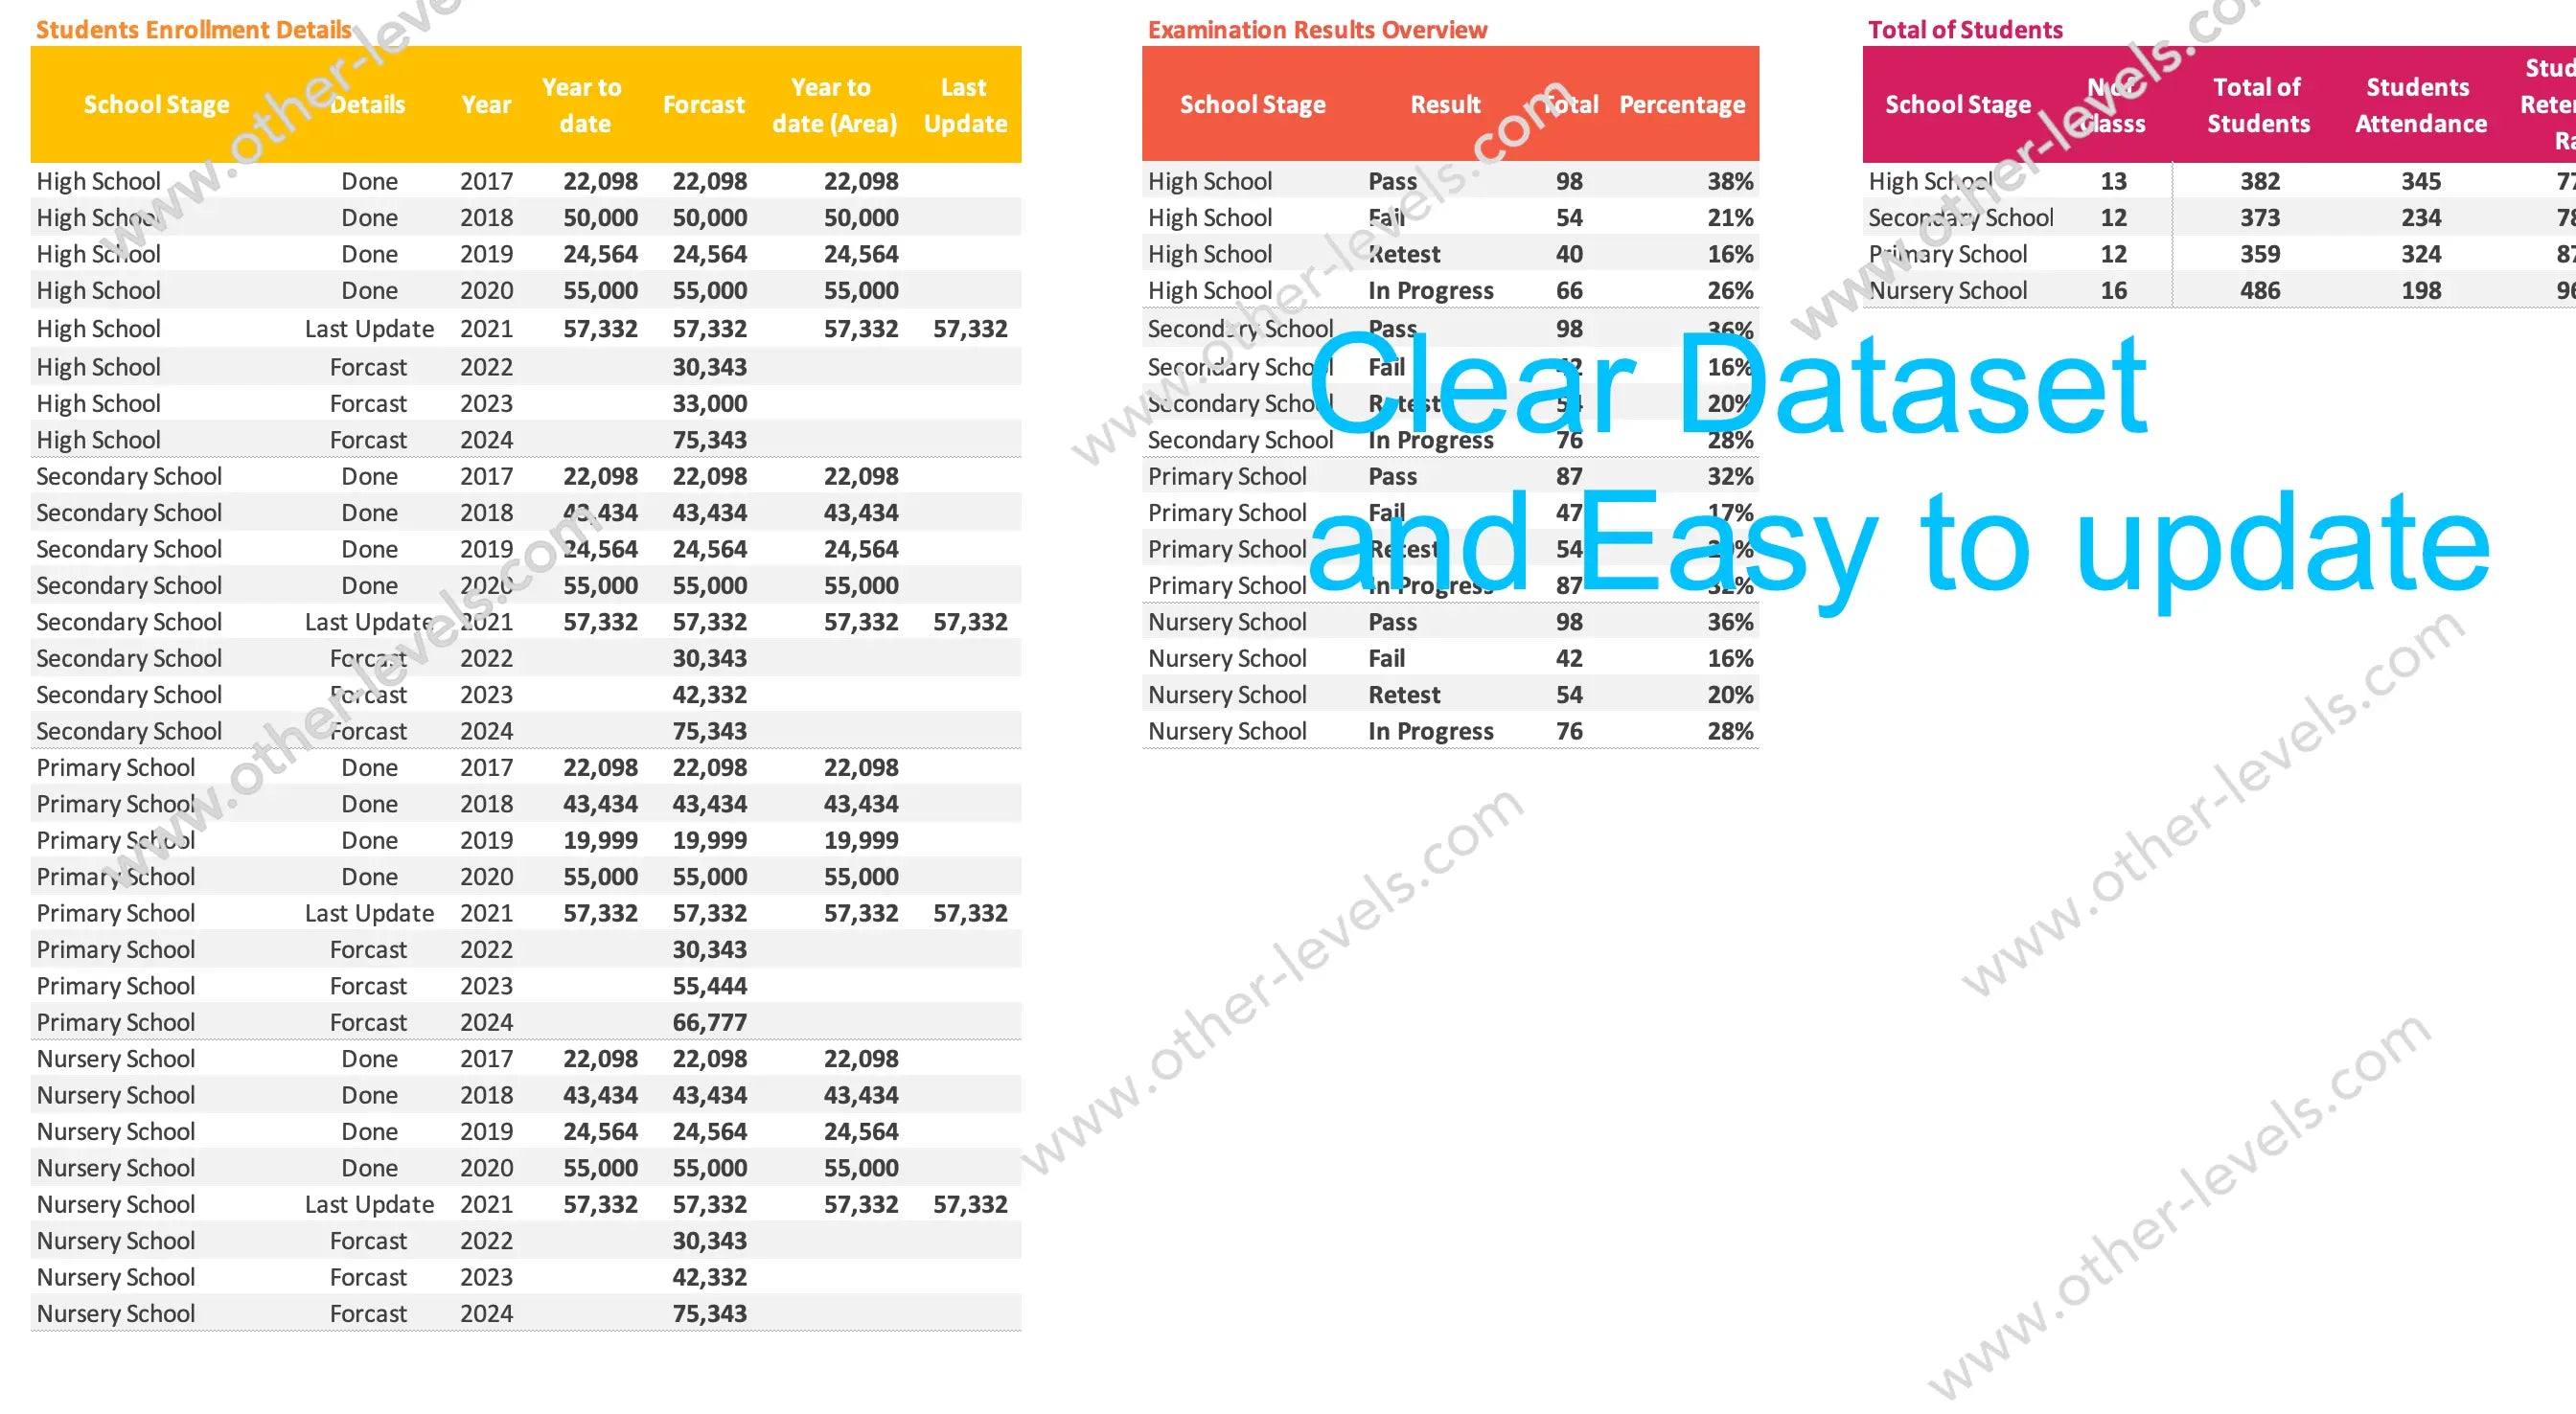
Why teams ship faster with this template
- Refresh-ready tables (CSV/Excel) with clear mapping to each visual.
- Readable on large screens and printable for sessions or briefings.
- Simple governance—use it as your will template for weekly ops reviews and sign-offs.
Related Excel Dashboards
Strengthen operations reporting with these SLA-focused templates:
- Service Level Agreement Summary Excel Dashboard – KPI scorecards for SLA compliance and trend analysis.
- Service Level Management Dashboard – SLA Excel Analytics – incident metrics, response times, and service performance tracking.
Video Tutorial
Specifications
Get all essential details in one place. From features and package contents to software compatibility and skill level required, this section gives you a clear overview so you know exactly what to expect before download.
Template Features
Package Details
Software Compatibility
Skill Level Required
Intermediate
FAQs
Please read our FAQs page to find out more.
Are the templates fully customizable?
Yes, all our templates are fully customizable. You can adjust the layout, data, and design elements to fit your specific needs. Our templates are designed to be flexible, allowing you to easily tailor them to your preferences.
Can I order a product in any language?
Yes, we provide products in any language. Simply select the "Dashboard language change" Service and once your order is placed, you will receive it within 48 hours.
What happens if I choose the wrong monitor screen size for my dashboard?
If you choose the wrong screen size, the dashboard may not display correctly on your monitor. Elements could appear too large, too small, or misaligned, affecting the readability and usability of the dashboard. We recommend selecting the appropriate screen size to ensure optimal viewing and performance.
Do I need specific skills to use the advanced Excel dashboard templates?
Our advanced Excel dashboards are easy to use, the only thing you need to know is how to work with PivotTables. With basic knowledge of PivotTables, you'll be able to customize and fully utilize these templates effortlessly. "Please check the skill level required"
All dashboards are 100% editable Excel files. Learn how to use them through our video tutorials, included datasets, and lifetime access program.