
✅ Instant Digital Delivery | 🔒 Secure Checkout | ⭐ Trusted by 1,000+ Professionals | 💬 24hr Support
Service Level Agreement Dashboard for Managed Services – CSAT Solution
Pairs well with
Service Level Agreement Dashboard for Managed Services – CSAT Solution
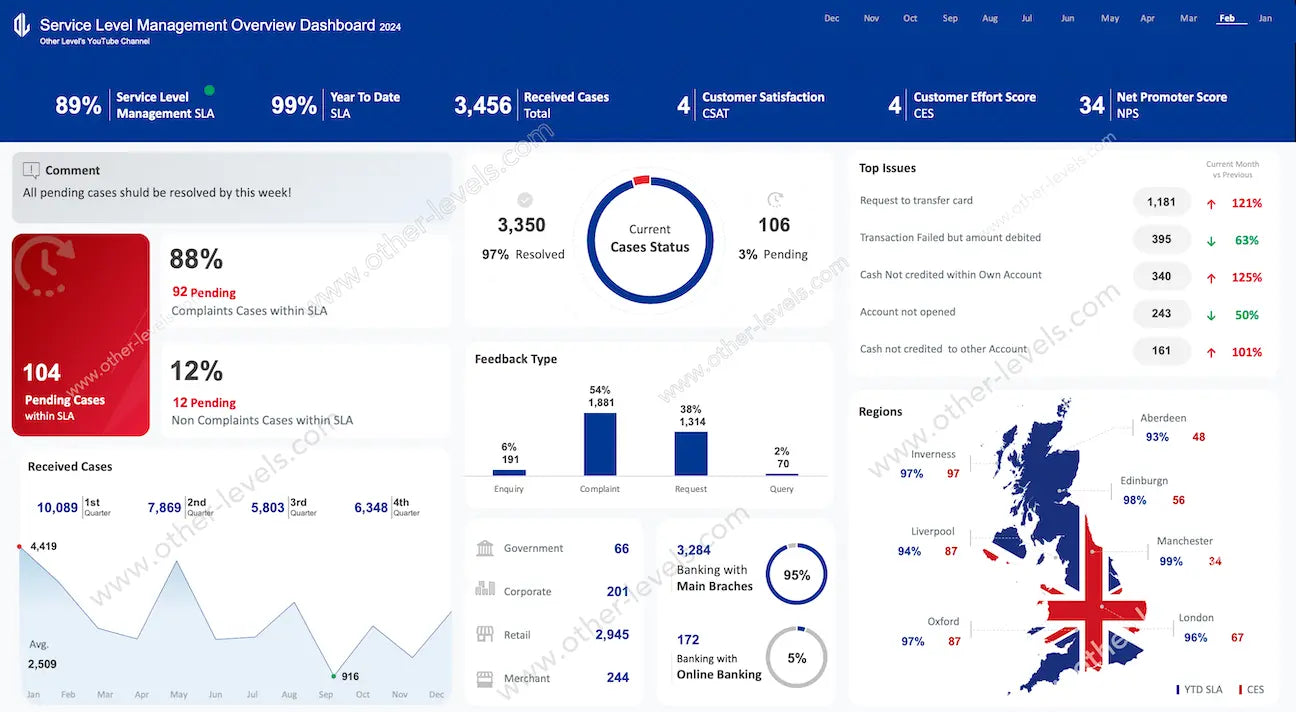
This Excel Dashboard gives managers a fast, visual way to track call-center operations, align teams with contractual targets, and connect service quality to real outcomes. It opens with clear KPI cards for volume and channel share, then moves into segmented visuals for issue mix, geography, seasonality, and time-of-day patterns. With slicers for Month, Week, and Support Type, you can drill from portfolio view to the exact interaction in a few clicks—no hunting through raw tables.
Excel Dashboard Overview
The layout is built for frontline use: concise tiles up top, deeper analysis below, and consistent color cues. Every chart is powered by PivotTables/PivotCharts and wired to the same slicers, so filters stay in sync. This keeps the experience fast, trustworthy, and easy to present in management reviews.
What it analyzes (titles & chart types)
Top KPIs
- Total Inbound Calls — KPI card
- Channel Share – Circuit / Internet / Landline / Mobile / Other Services — Donut/Gauge tiles
Service outcomes
- Service Outcome – Ticketed vs Non-Ticketed — Clustered column
- Inbound Calls by Week — Horizontal bar
- Issue Type Breakdown — Vertical column
Patterns & distribution
- Inbound Calls by Country — Choropleth map
- Monthly Seasonality — Radar/Polar
- Daily Inbound Calls – Current Period — Line
- Calls by Hour — Smooth line/area
Operational signals
- Operational Signals – Respond / Ethernet / Orders / Services / Clients / Alarms — KPI tiles with deltas
How it supports SLA & CSAT
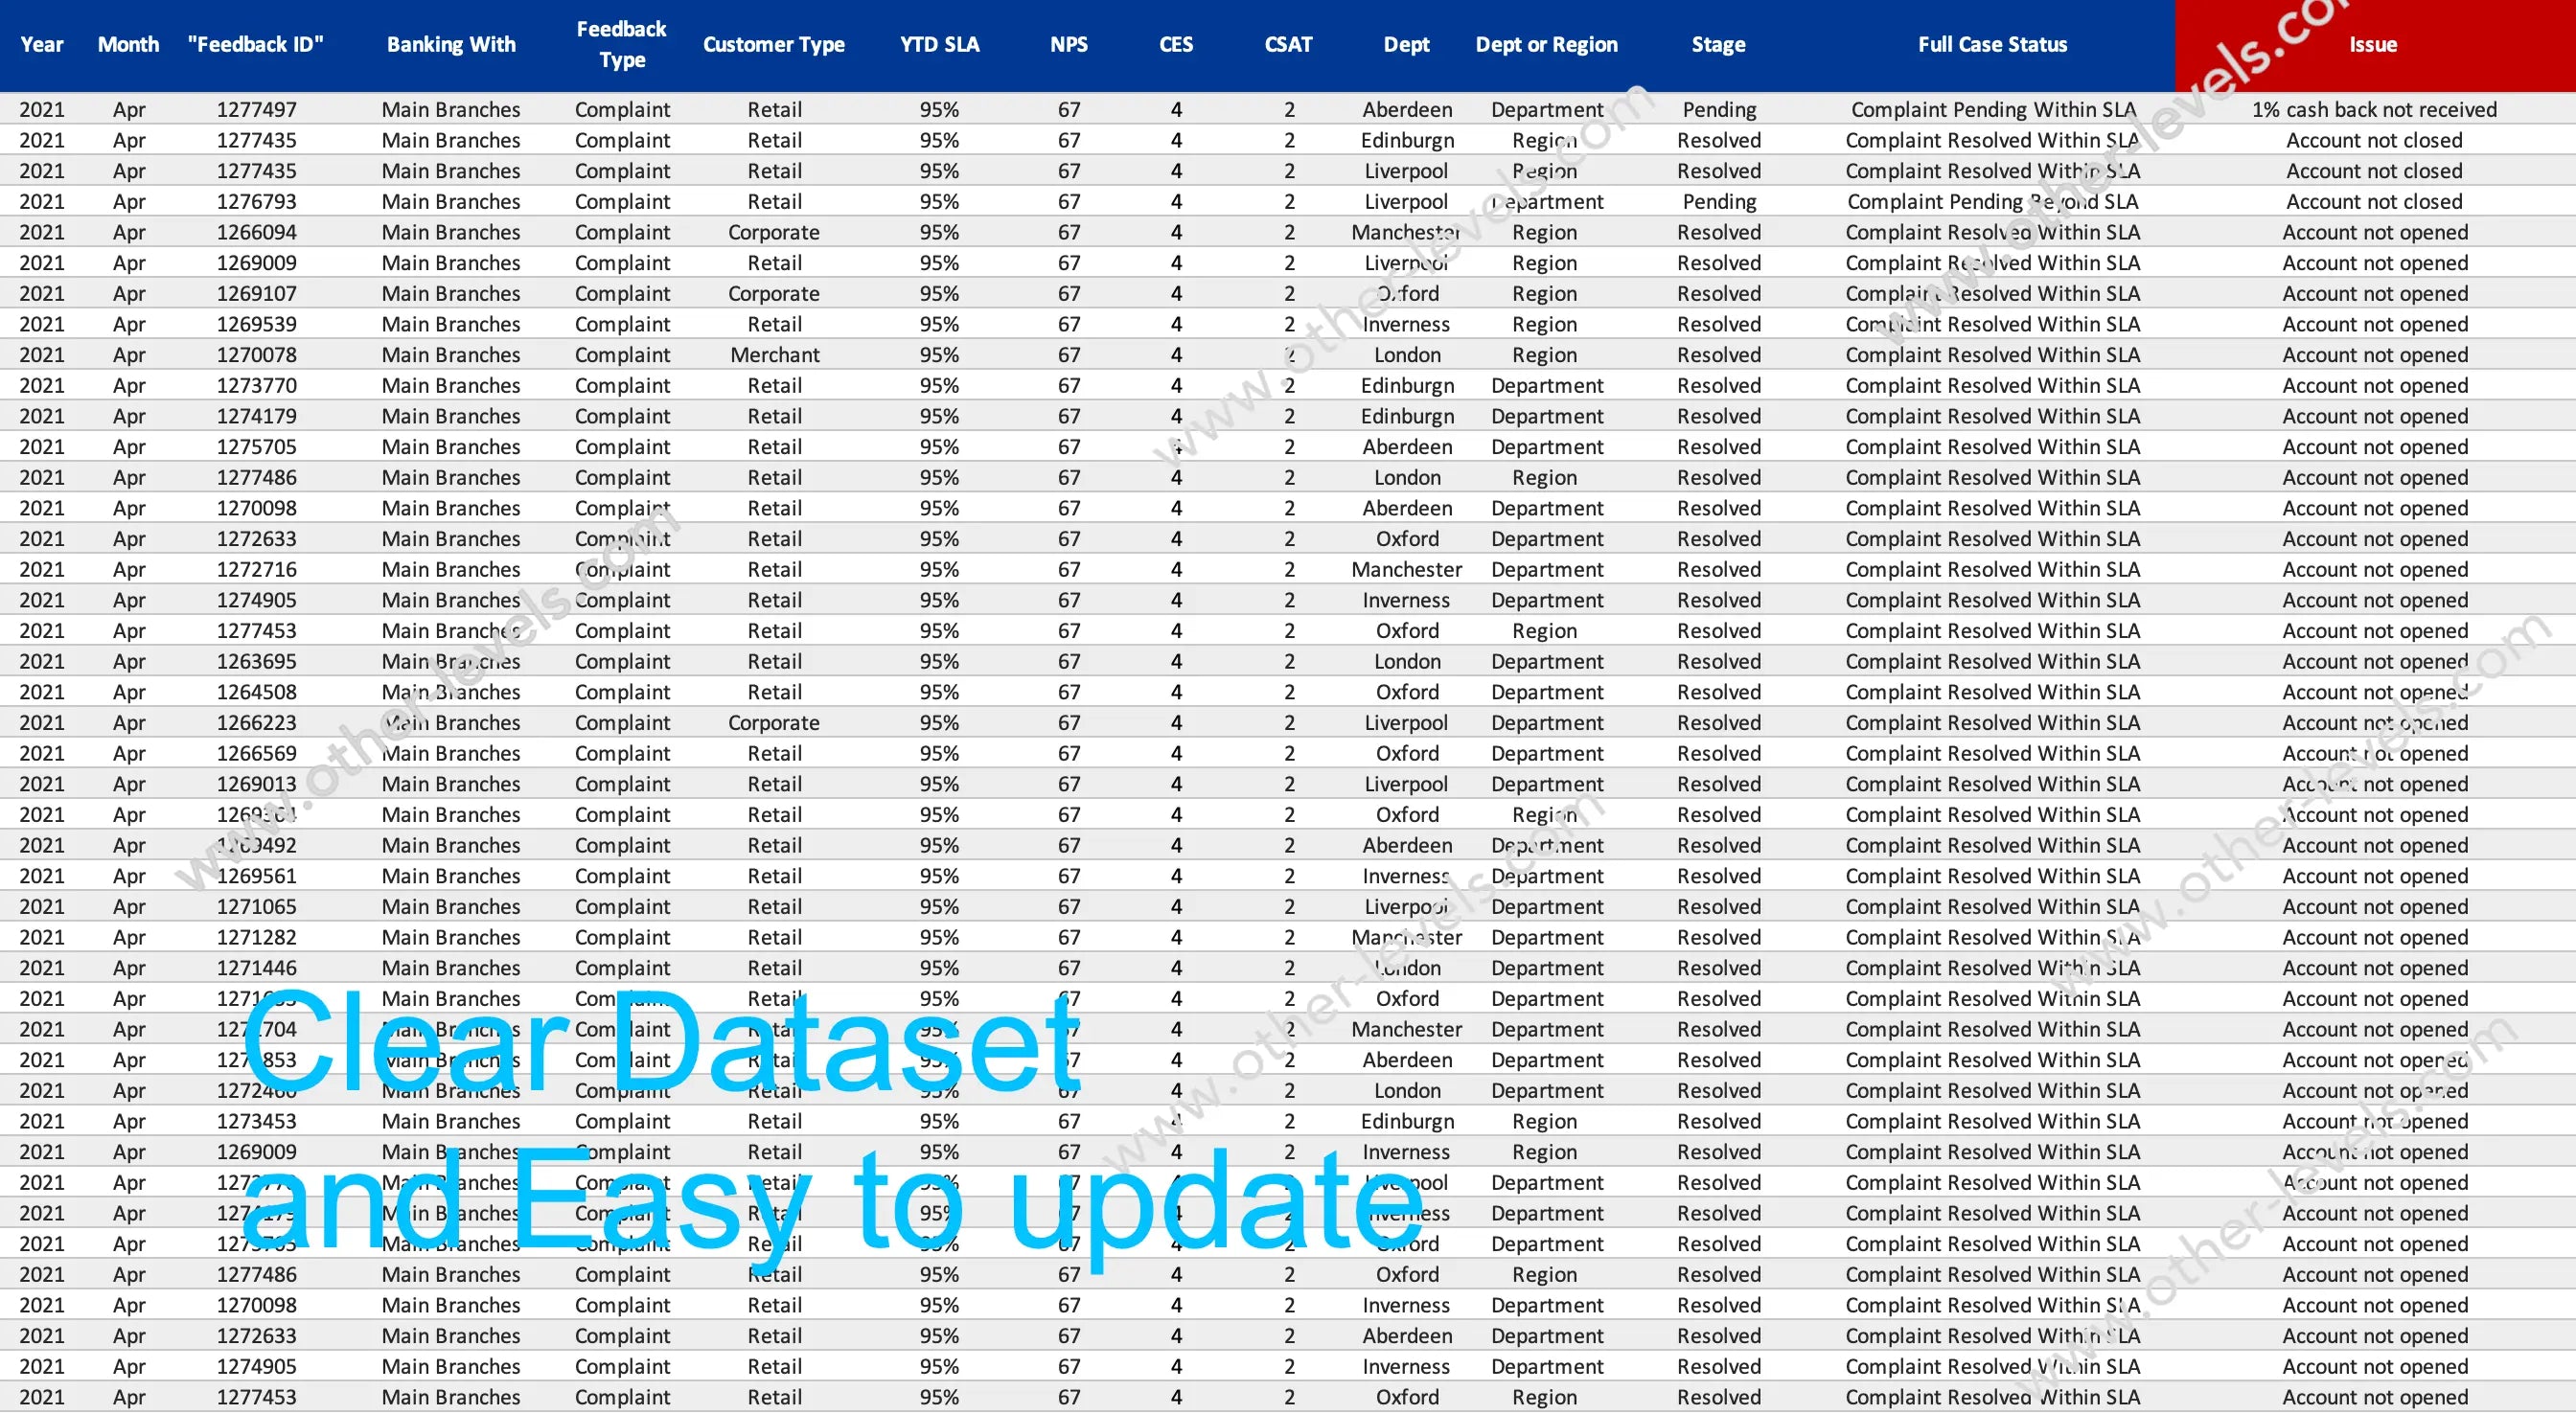
This is an sla dashboard designed for service level management in managed services. Add tiles for core sla metrics such as compliance rate, breach count, and average response time; pair them with a customer satisfaction score tile to show how speed influences csat. Use the ticketing split to strengthen customer service management and keep every service sla traceable, especially where sla in contract terms demand evidence.
Features & build
- Interactive slicers (Month, Week, Support Type) applied to all visuals
- PivotTables + PivotCharts with “Show Values As” for shares and trends
- Conditional formatting on KPI deltas for quick green/red signals
- “Last Update” timestamp pulled from refresh for auditability
- Print-ready single-page layout and consistent color system
Use cases
- Shift planning against hourly and weekly peaks to protect response targets
- Issue-mix analysis to reduce backlogs and prevent SLA breaches
- Regional performance reviews and vendor oversight with map context
- Executive reporting that links compliance directly to satisfaction
Related templates
- Comprehensive Project Management Performance – Excel Dashboard Template
- Project Management KPI & Status – Comprehensive Excel Dashboard
Specifications
Get all essential details in one place. From features and package contents to software compatibility and skill level required, this section gives you a clear overview so you know exactly what to expect before download.
Template Features
Package Details
Software Compatibility
Skill Level Required
Beginner
FAQs
Please read our FAQs page to find out more.
Are the templates fully customizable?
Yes, all our templates are fully customizable. You can adjust the layout, data, and design elements to fit your specific needs. Our templates are designed to be flexible, allowing you to easily tailor them to your preferences.
Can I order a product in any language?
Yes, we provide products in any language. Simply select the "Dashboard language change" Service and once your order is placed, you will receive it within 48 hours.
What happens if I choose the wrong monitor screen size for my dashboard?
If you choose the wrong screen size, the dashboard may not display correctly on your monitor. Elements could appear too large, too small, or misaligned, affecting the readability and usability of the dashboard. We recommend selecting the appropriate screen size to ensure optimal viewing and performance.
Do I need specific skills to use the advanced Excel dashboard templates?
Our advanced Excel dashboards are easy to use, the only thing you need to know is how to work with PivotTables. With basic knowledge of PivotTables, you'll be able to customize and fully utilize these templates effortlessly. "Please check the skill level required"
All dashboards are 100% editable Excel files. Learn how to use them through our video tutorials, included datasets, and lifetime access program.