✅ Instant Digital Delivery | 🔒 Secure Checkout | ⭐ Trusted by 1,000+ Professionals | 💬 24hr Support
Financial Planning and Analysis Excel Dashboard – Budget vs Actual
Pairs well with
Financial Planning and Analysis Excel Dashboard – Budget vs Actual
Here’s the thing. Managing financial performance is never simple. Budgets shift, projects evolve, and in practice, the numbers don’t always tell the full story. That’s why this Financial Planning Excel Dashboard was designed — to give you a clear view of budget vs actual performance in a way that feels effortless. It’s built as a flexible Spreadsheet, so you don’t need macros or complex tools to start analyzing right away.
What You’ll See at a Glance
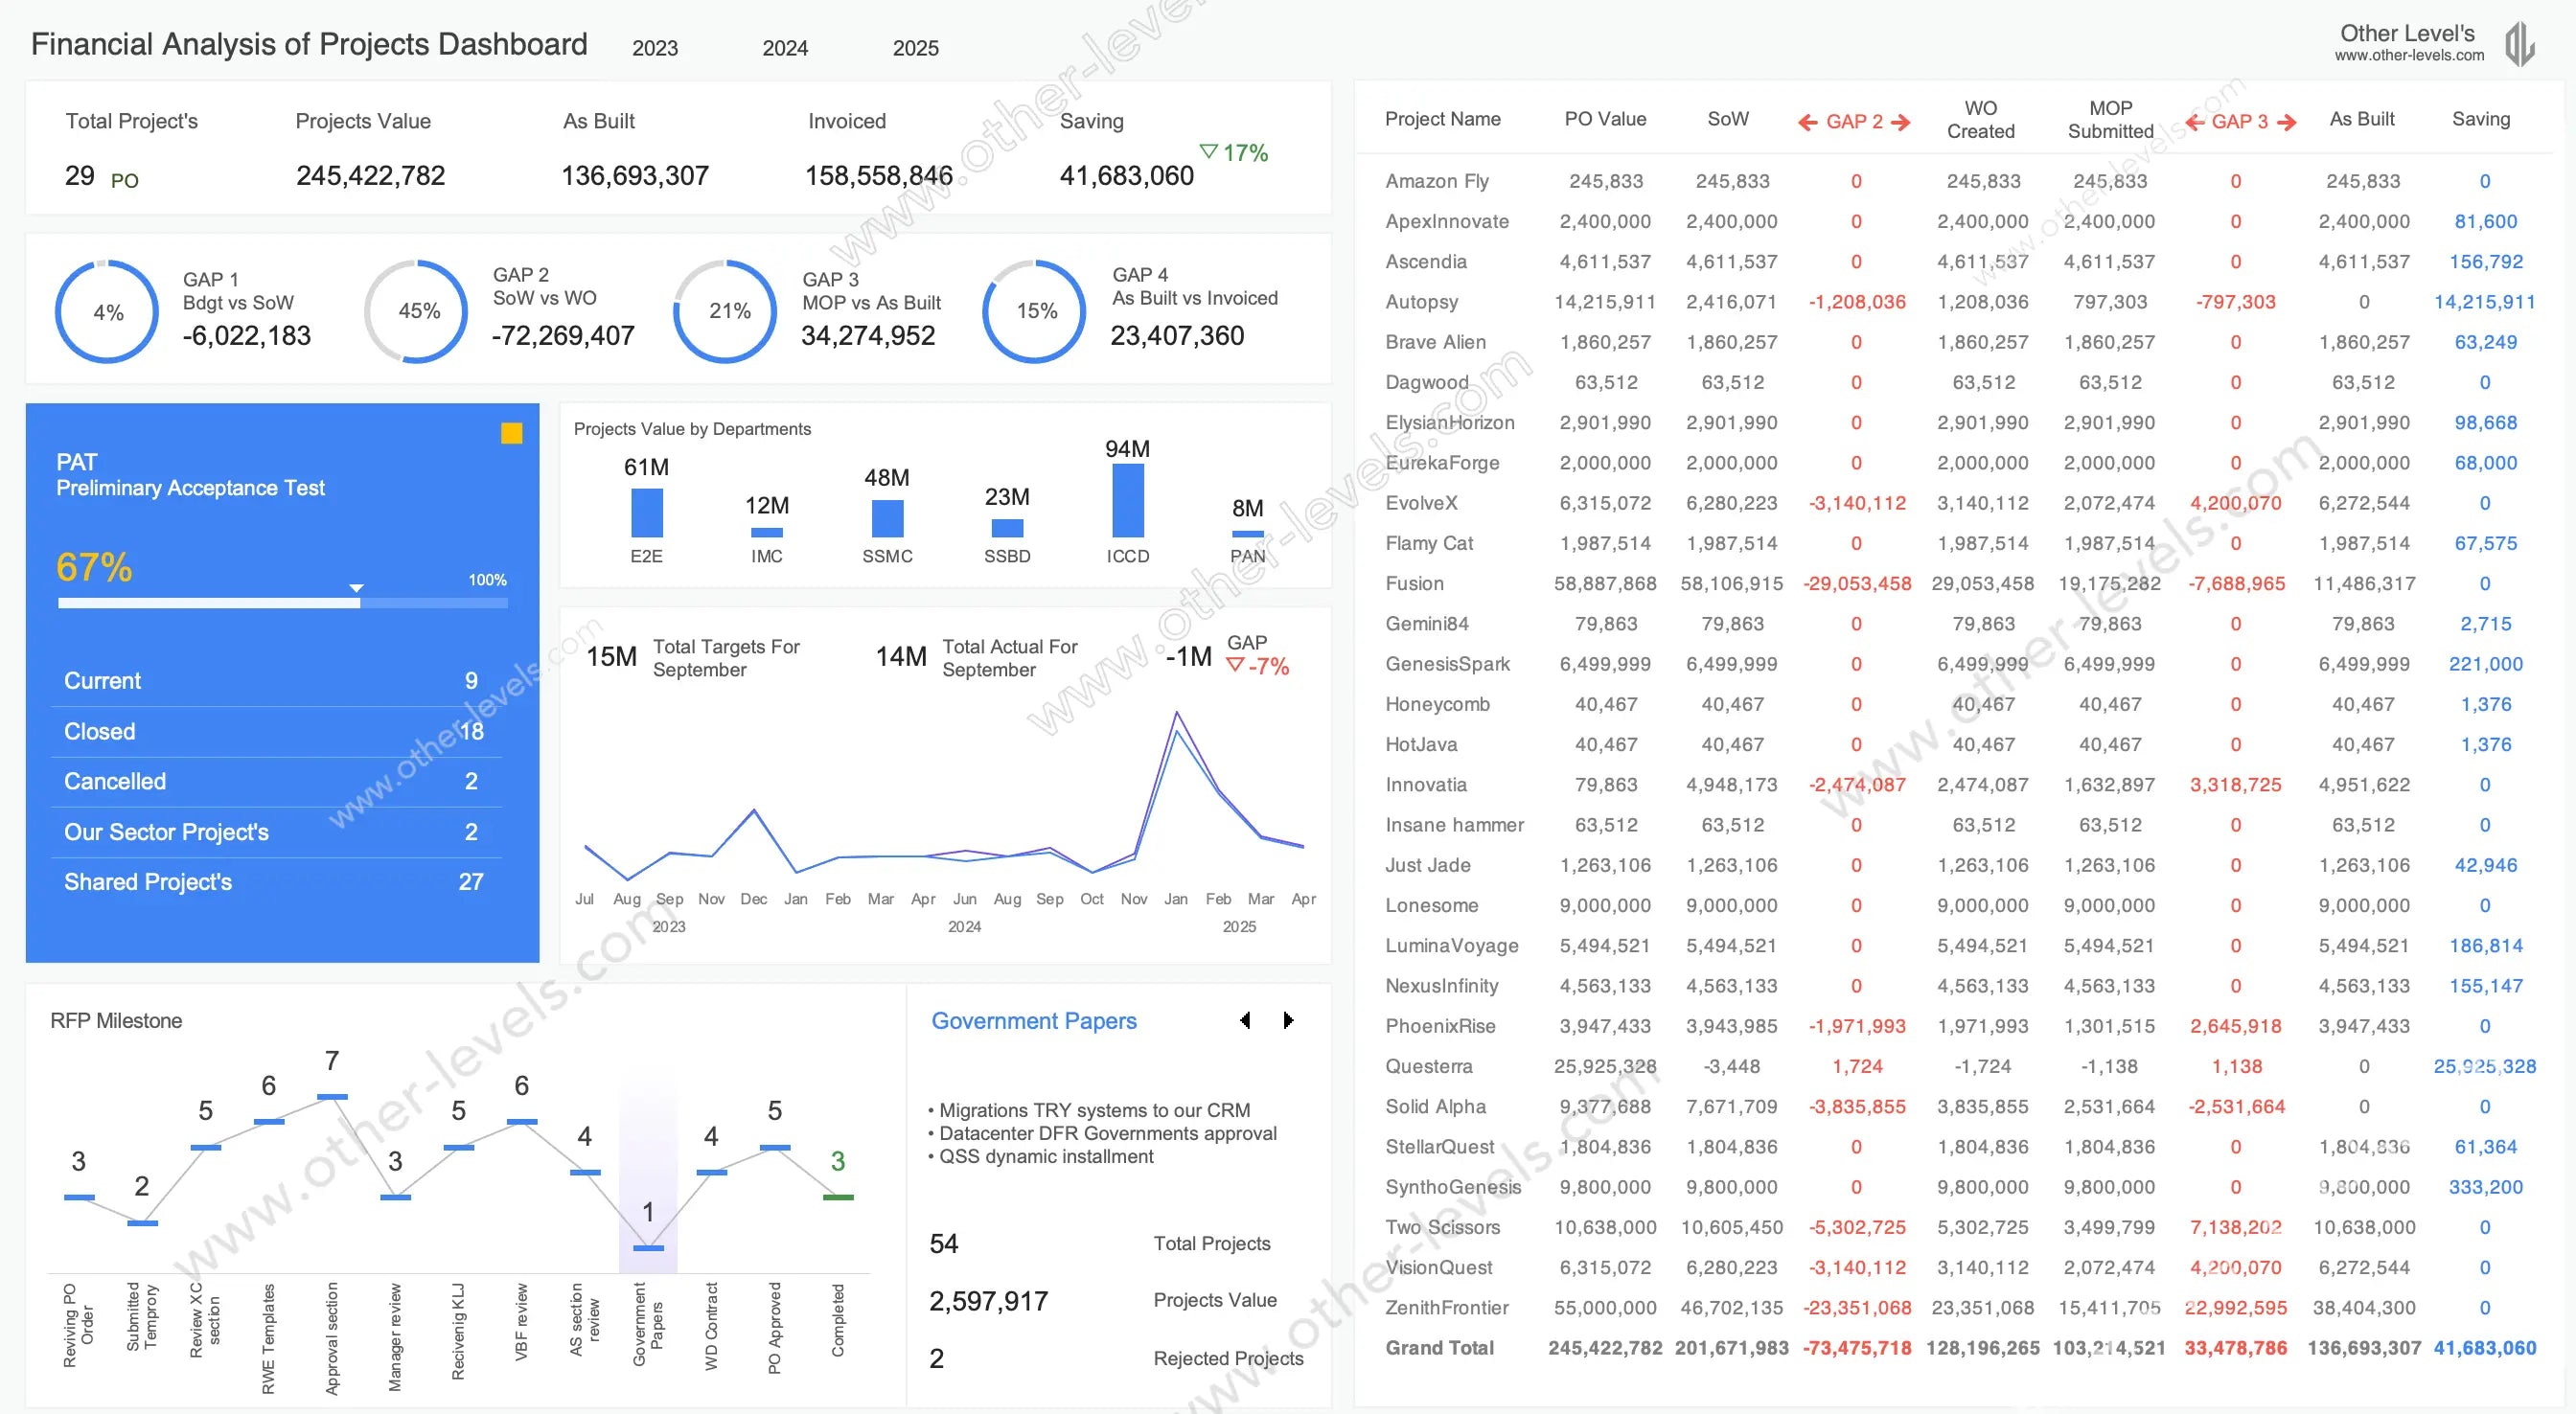
KPI Cards That Talk to You
At the top, you’ll notice simple KPI cards. They show total projects, project values, as-built and invoiced figures, plus cost savings over time. Think of them as quick “health checks” — numbers that instantly tell you if things are moving in the right direction.
Donut Charts for Gap Analysis
Ever wondered where the leaks are? The donut charts break down gaps like Budget vs SoW, SoW vs VO, MOP vs As-Built, and As-Built vs Invoiced. With a quick glance, you’ll know where things are slipping — or saving.
Project Status and Acceptance Test
On the left side, there’s a status tracker. It sorts projects into current, closed, canceled, shared, or sector-based. Right below it, the PAT gauge (Preliminary Acceptance Test) shows progress with a neat bar that feels almost like a speedometer.
Department Value Comparisons
Here’s where it gets practical. A clustered column chart compares how much value each department is carrying. This makes it easy to spot which teams are leading financially and where resources might be stretched thin.
Monthly Targets and Trends
A line chart shows monthly performance. Targets are mapped against actual results, and gaps are marked. You’ll notice the trend lines make it easy to track progress and spot dips before they become serious problems.
Milestone Timeline for RFPs
Projects move in steps. The RFP milestone timeline uses a line with markers to track project management milestones. You can follow approvals, reviews, submissions, and contract sign-offs in one clean path. No more digging through messy files to see where things stand.
Contract Highlights and Quick Notes
This card is like a sticky note for your contracts. It holds the essentials: total projects, value, and rejected projects. Plus, you can add quick reminders for approvals or special requirements so nothing slips through.
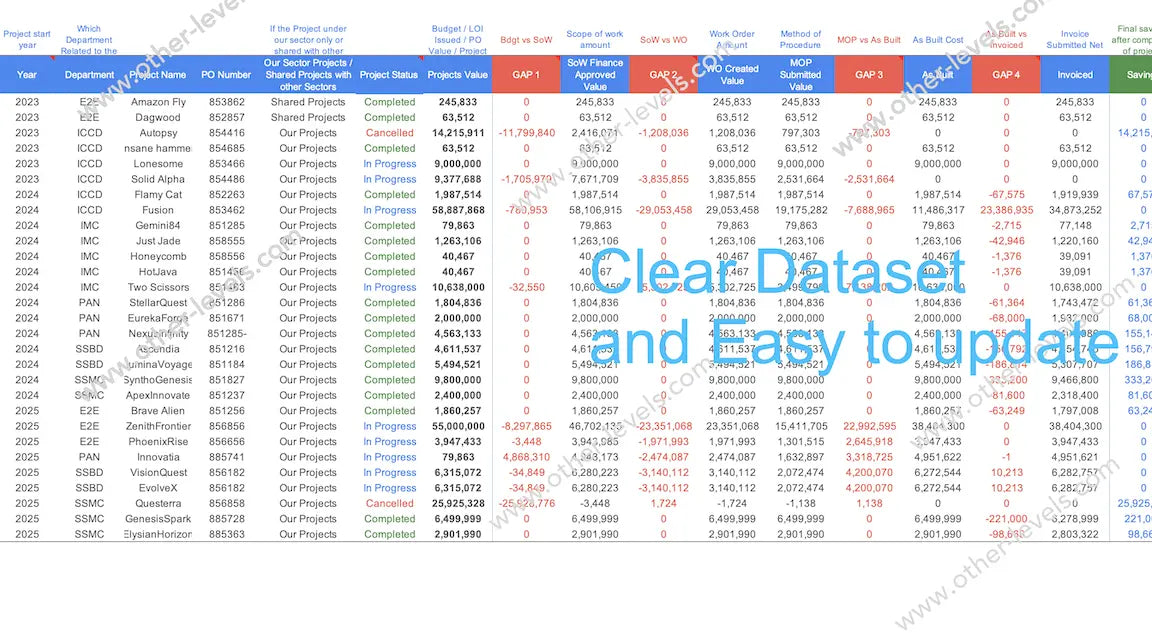
Detailed Project Table
Finally, the table. This is where the nitty-gritty lives. Each project is listed with PO, SoW, variation orders, work orders, submissions, as-built, gaps, and savings. Conditional formatting does the heavy lifting, so red flags and positive results stand out instantly.
Why It Matters for Financial Planning
This dashboard isn’t just numbers. It’s a real tool for financial planning and analysis. It helps you test assumptions, measure results, and link back to your financial business plan. In practice, it also works as an excel format for expense reports, giving you consistency across reporting.
How You Might Use It
- Set up a budget tracker template to keep plans vs results side by side.
- Run projections for profit as well as costs of r to prepare different scenarios.
- Present insights to leadership with visuals they can grasp in seconds.
Who Will Benefit the Most
- Any construction project manager who needs a single view of costs and progress.
- Teams testing construction project management software but want an Excel base first.
- Companies hiring for construction project manager vacancies who want reporting ready to go.
- Executives leading financial planning for business owners that depend on speed and clarity.
- Analysts preparing for financial planning & analysis jobs or case interviews.
Visuals and Charts Inside
- KPI Cards for quick checks
- Donut Charts for gap analysis
- Progress Gauge for PAT tracking
- Clustered Column Chart by department
- Line Chart for monthly targets
- Line with Markers for RFP milestones
- Conditional Formatting in project tables
Fitting into Your Planning Process
In practice, this dashboard ties neatly into the 7 step financial planning process. You’ll find it useful whether you’re monitoring budgets, preparing quarterly reviews, or fine-tuning your financial business plan. It’s a practical way to connect strategy with execution.
Explore Related Tools
If you like this dashboard, you might also find value in the Major Animated Dashboard, Meeting Actions Status, and Project Process. For a broader package, check out the Project Management & Operations Bundle. Both pair perfectly with this Excel template for a complete reporting toolkit.
Watch the Full Video Tutorial
Watch the full tutorial on our Other Levels YouTube Channel
Specifications
Get all essential details in one place. From features and package contents to software compatibility and skill level required, this section gives you a clear overview so you know exactly what to expect before download.
Template Features
Package Details
Software Compatibility
Skill Level Required
Intermediate
FAQs
Please read our FAQs page to find out more.
Are the templates fully customizable?
Yes, all our templates are fully customizable. You can adjust the layout, data, and design elements to fit your specific needs. Our templates are designed to be flexible, allowing you to easily tailor them to your preferences.
Can I order a product in any language?
Yes, we provide products in any language. Simply select the "Dashboard language change" Service and once your order is placed, you will receive it within 48 hours.
What happens if I choose the wrong monitor screen size for my dashboard?
If you choose the wrong screen size, the dashboard may not display correctly on your monitor. Elements could appear too large, too small, or misaligned, affecting the readability and usability of the dashboard. We recommend selecting the appropriate screen size to ensure optimal viewing and performance.
Do I need specific skills to use the advanced Excel dashboard templates?
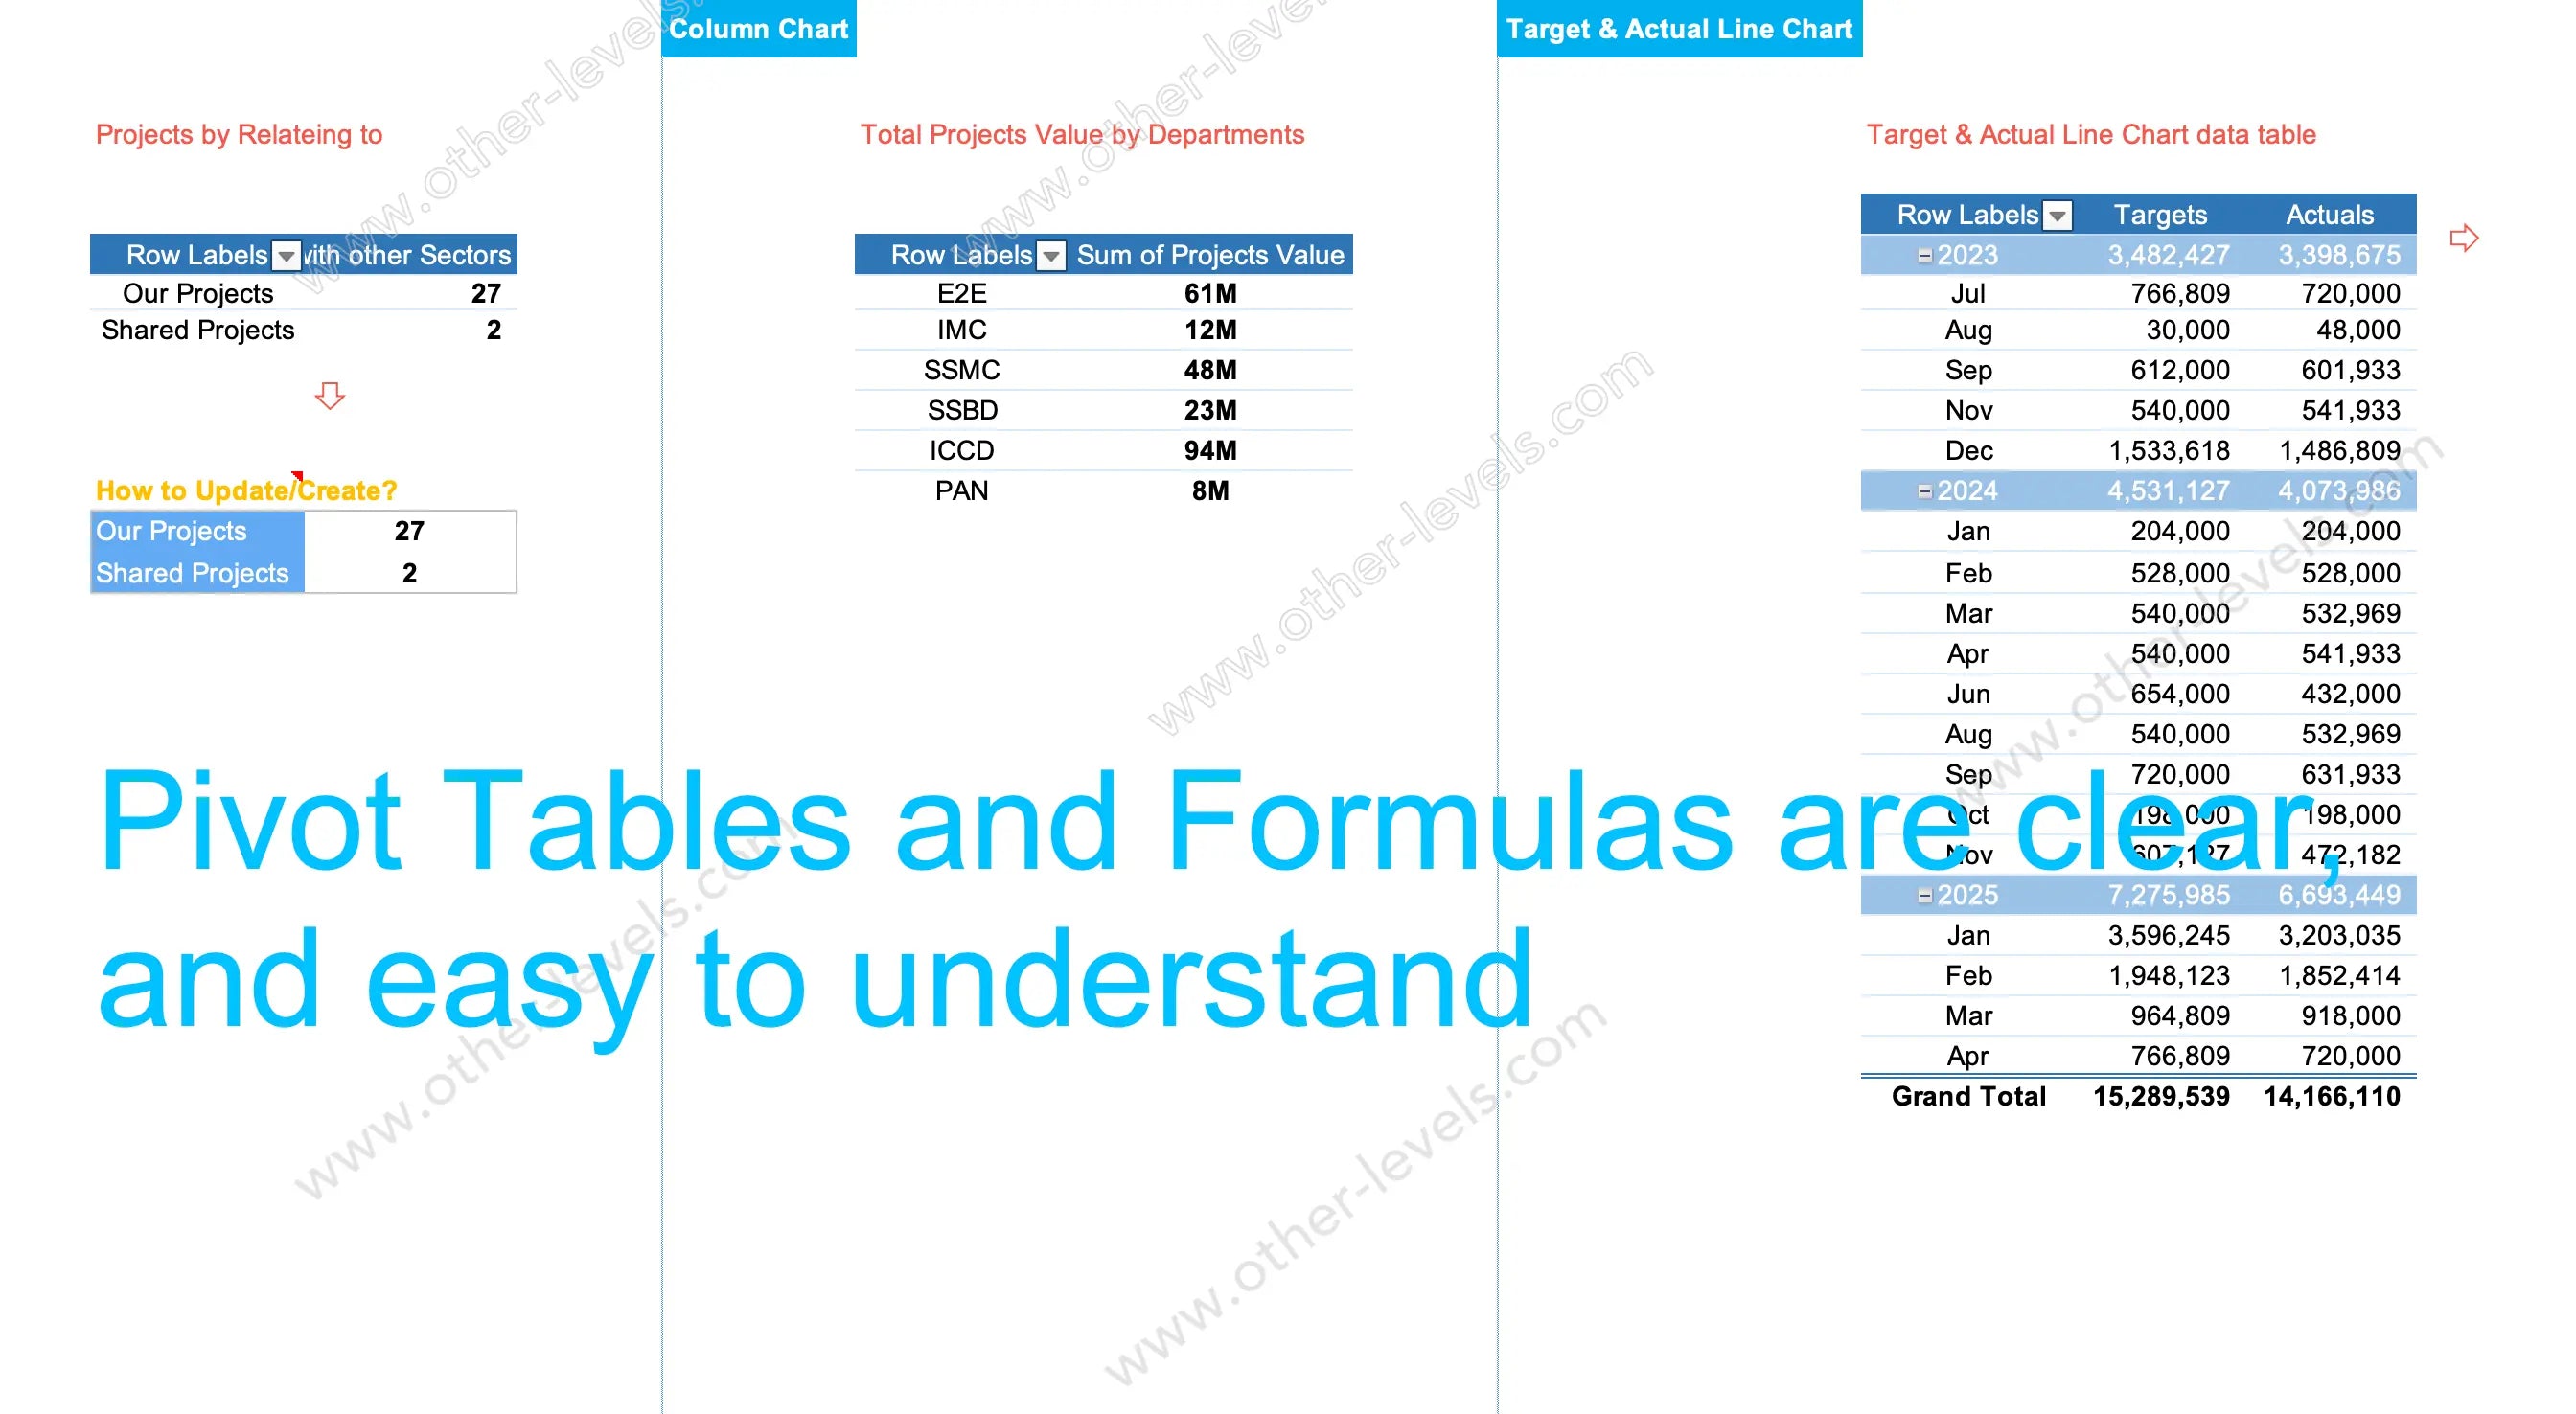
Our advanced Excel dashboards are easy to use, the only thing you need to know is how to work with PivotTables. With basic knowledge of PivotTables, you'll be able to customize and fully utilize these templates effortlessly. "Please check the skill level required"
All dashboards are 100% editable Excel files. Learn how to use them through our video tutorials, included datasets, and lifetime access program.