✅ Instant Digital Delivery | 🔒 Secure Checkout | ⭐ Trusted by 1,000+ Professionals | 💬 24hr Support
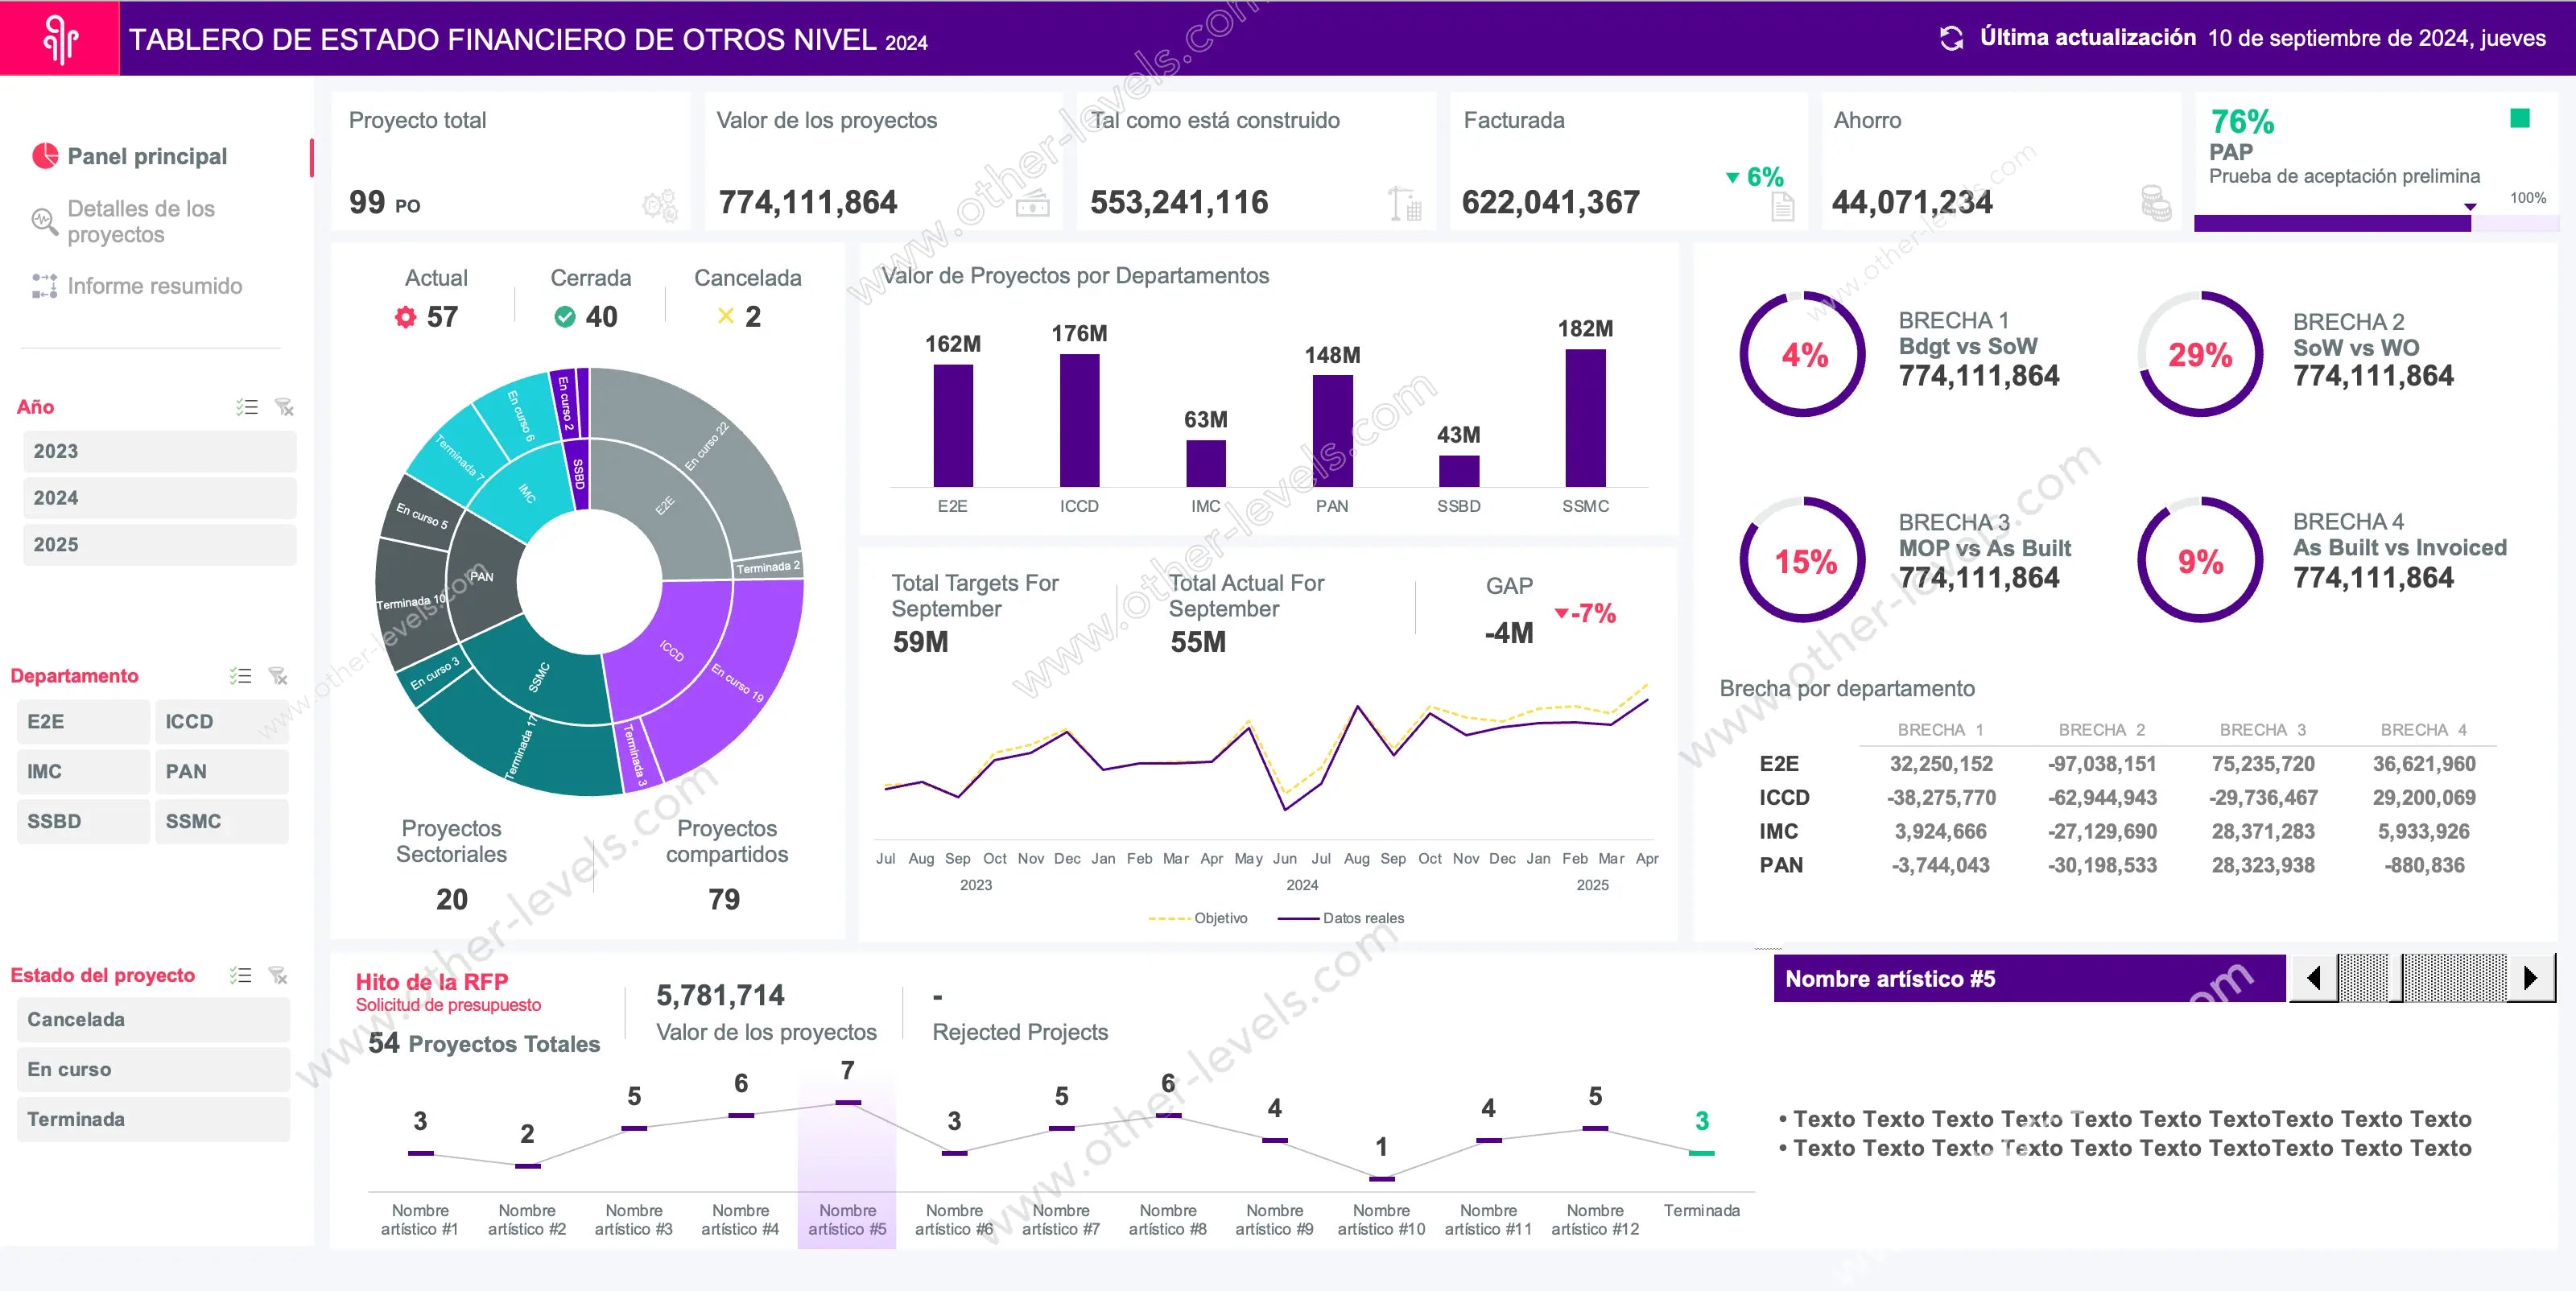
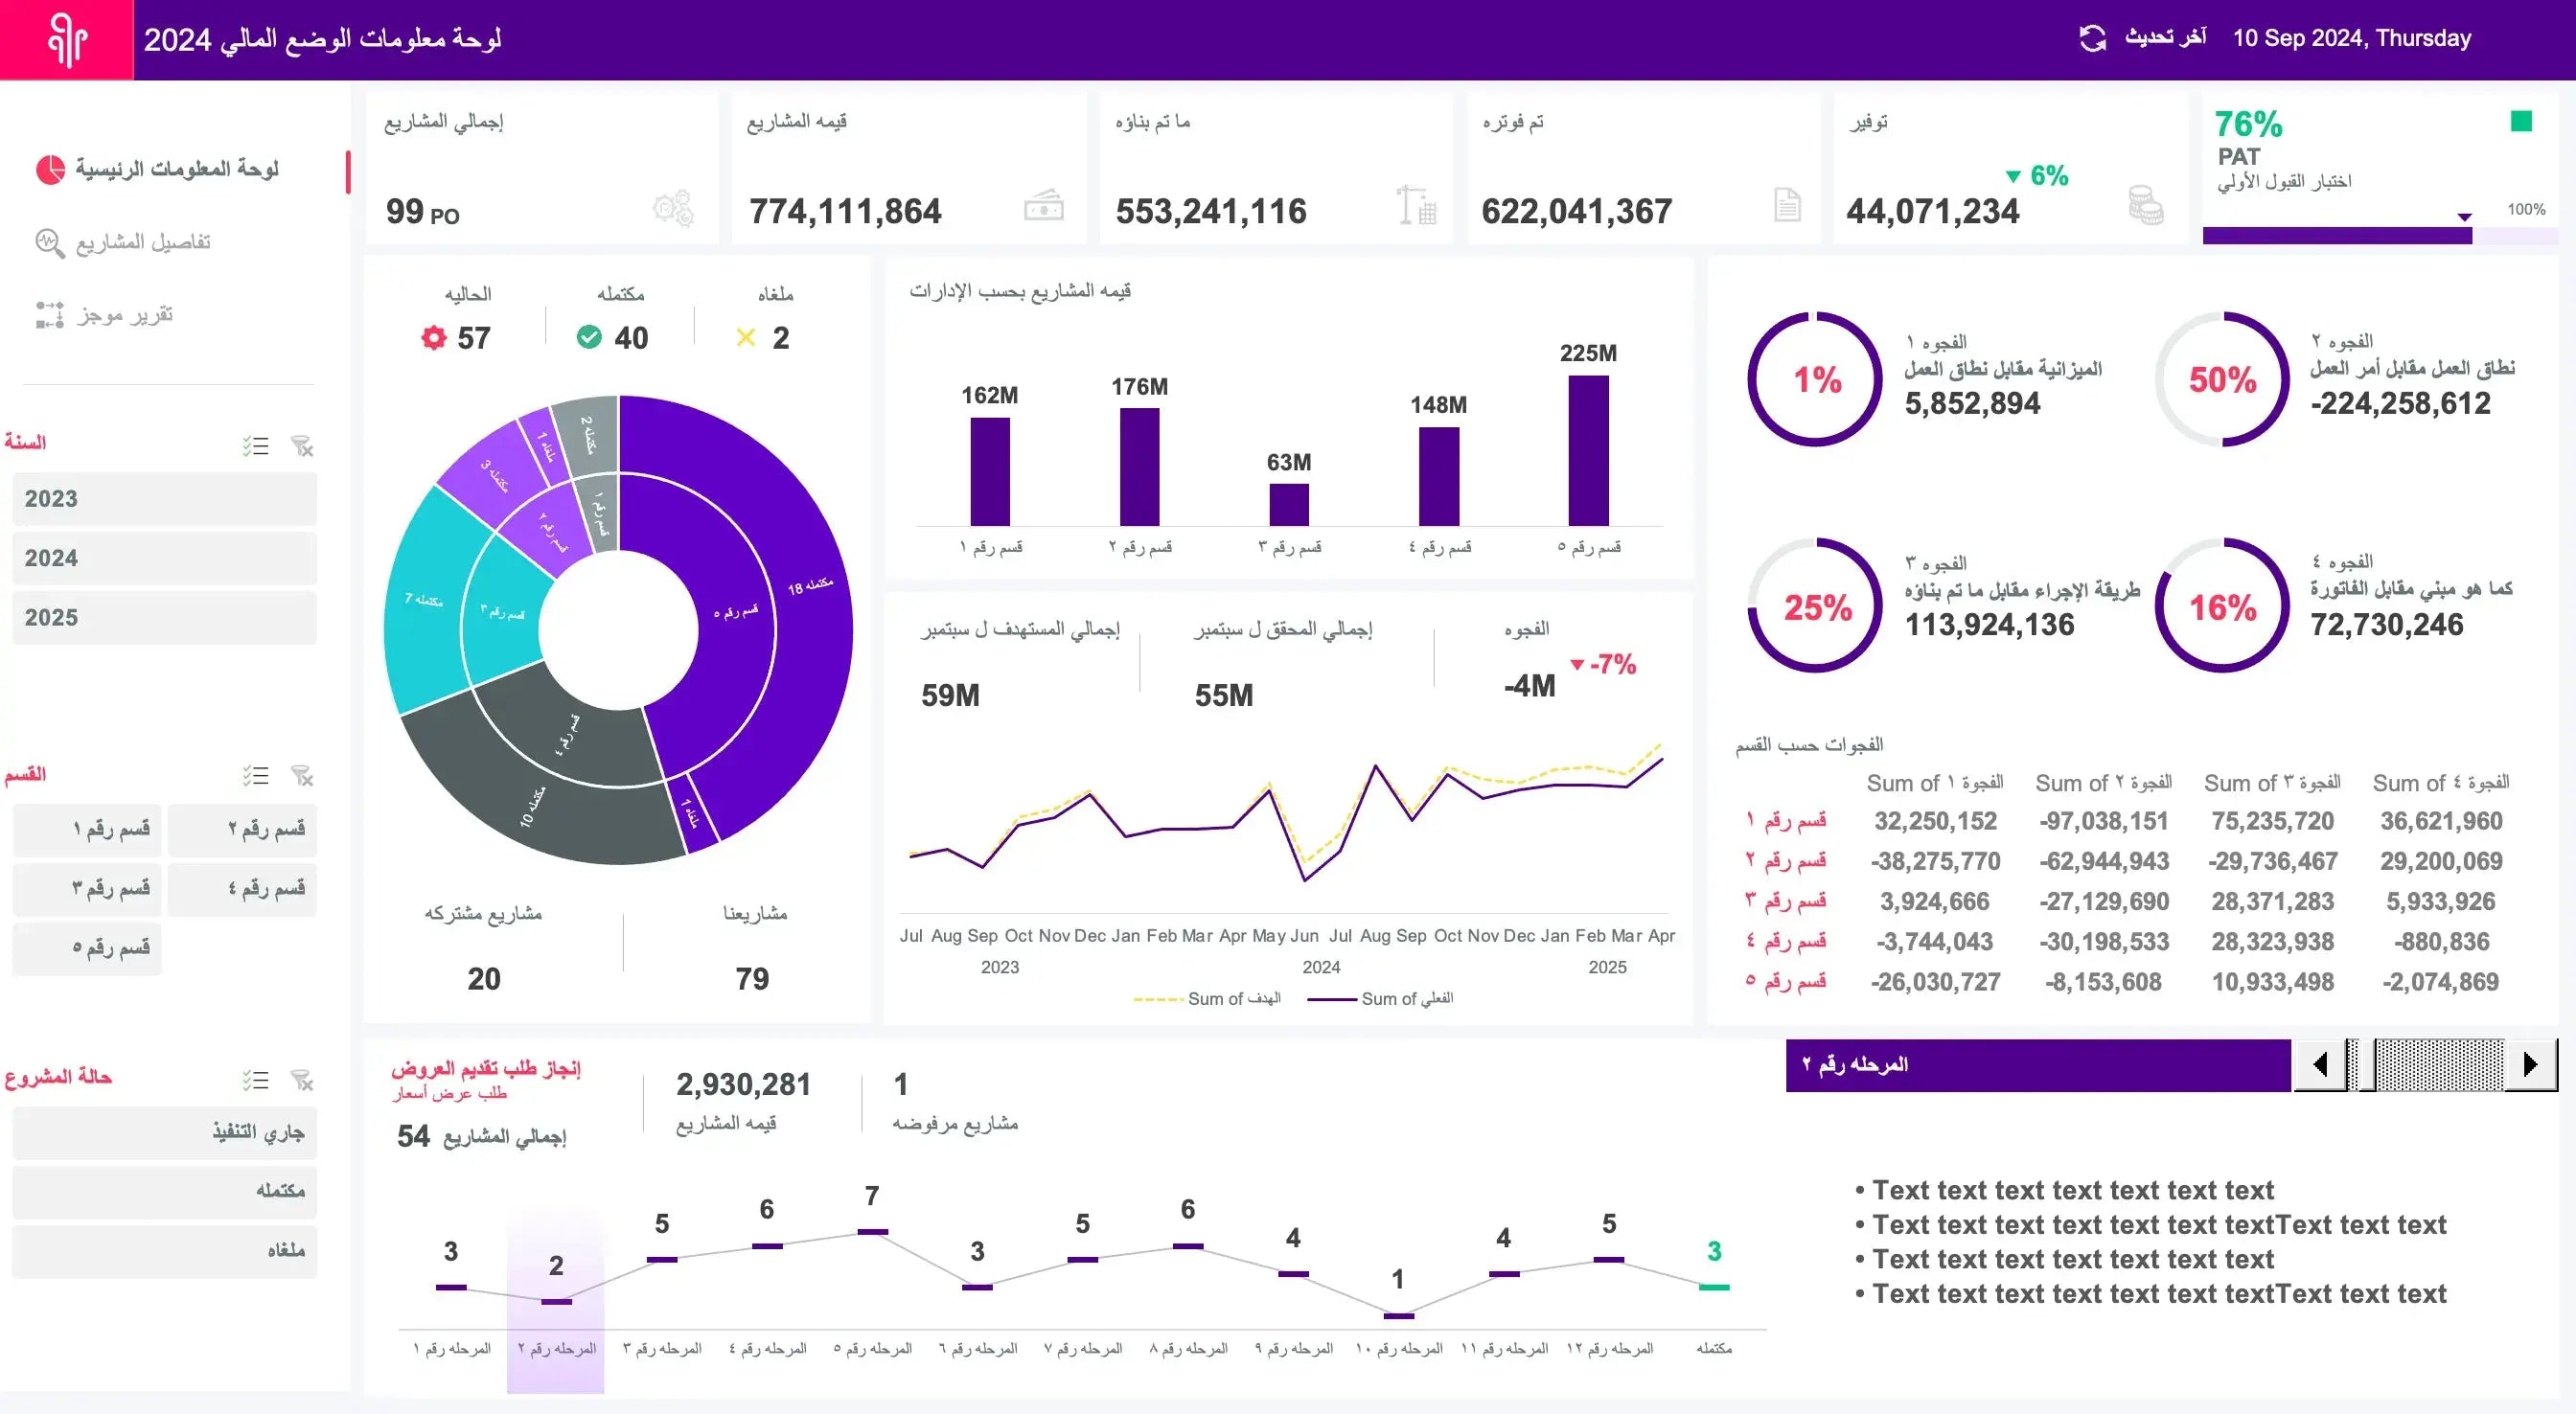
Dynamic & Interactive Dashboard - Financial Status & Project Milestone
Pairs well with
Financial Status Overview
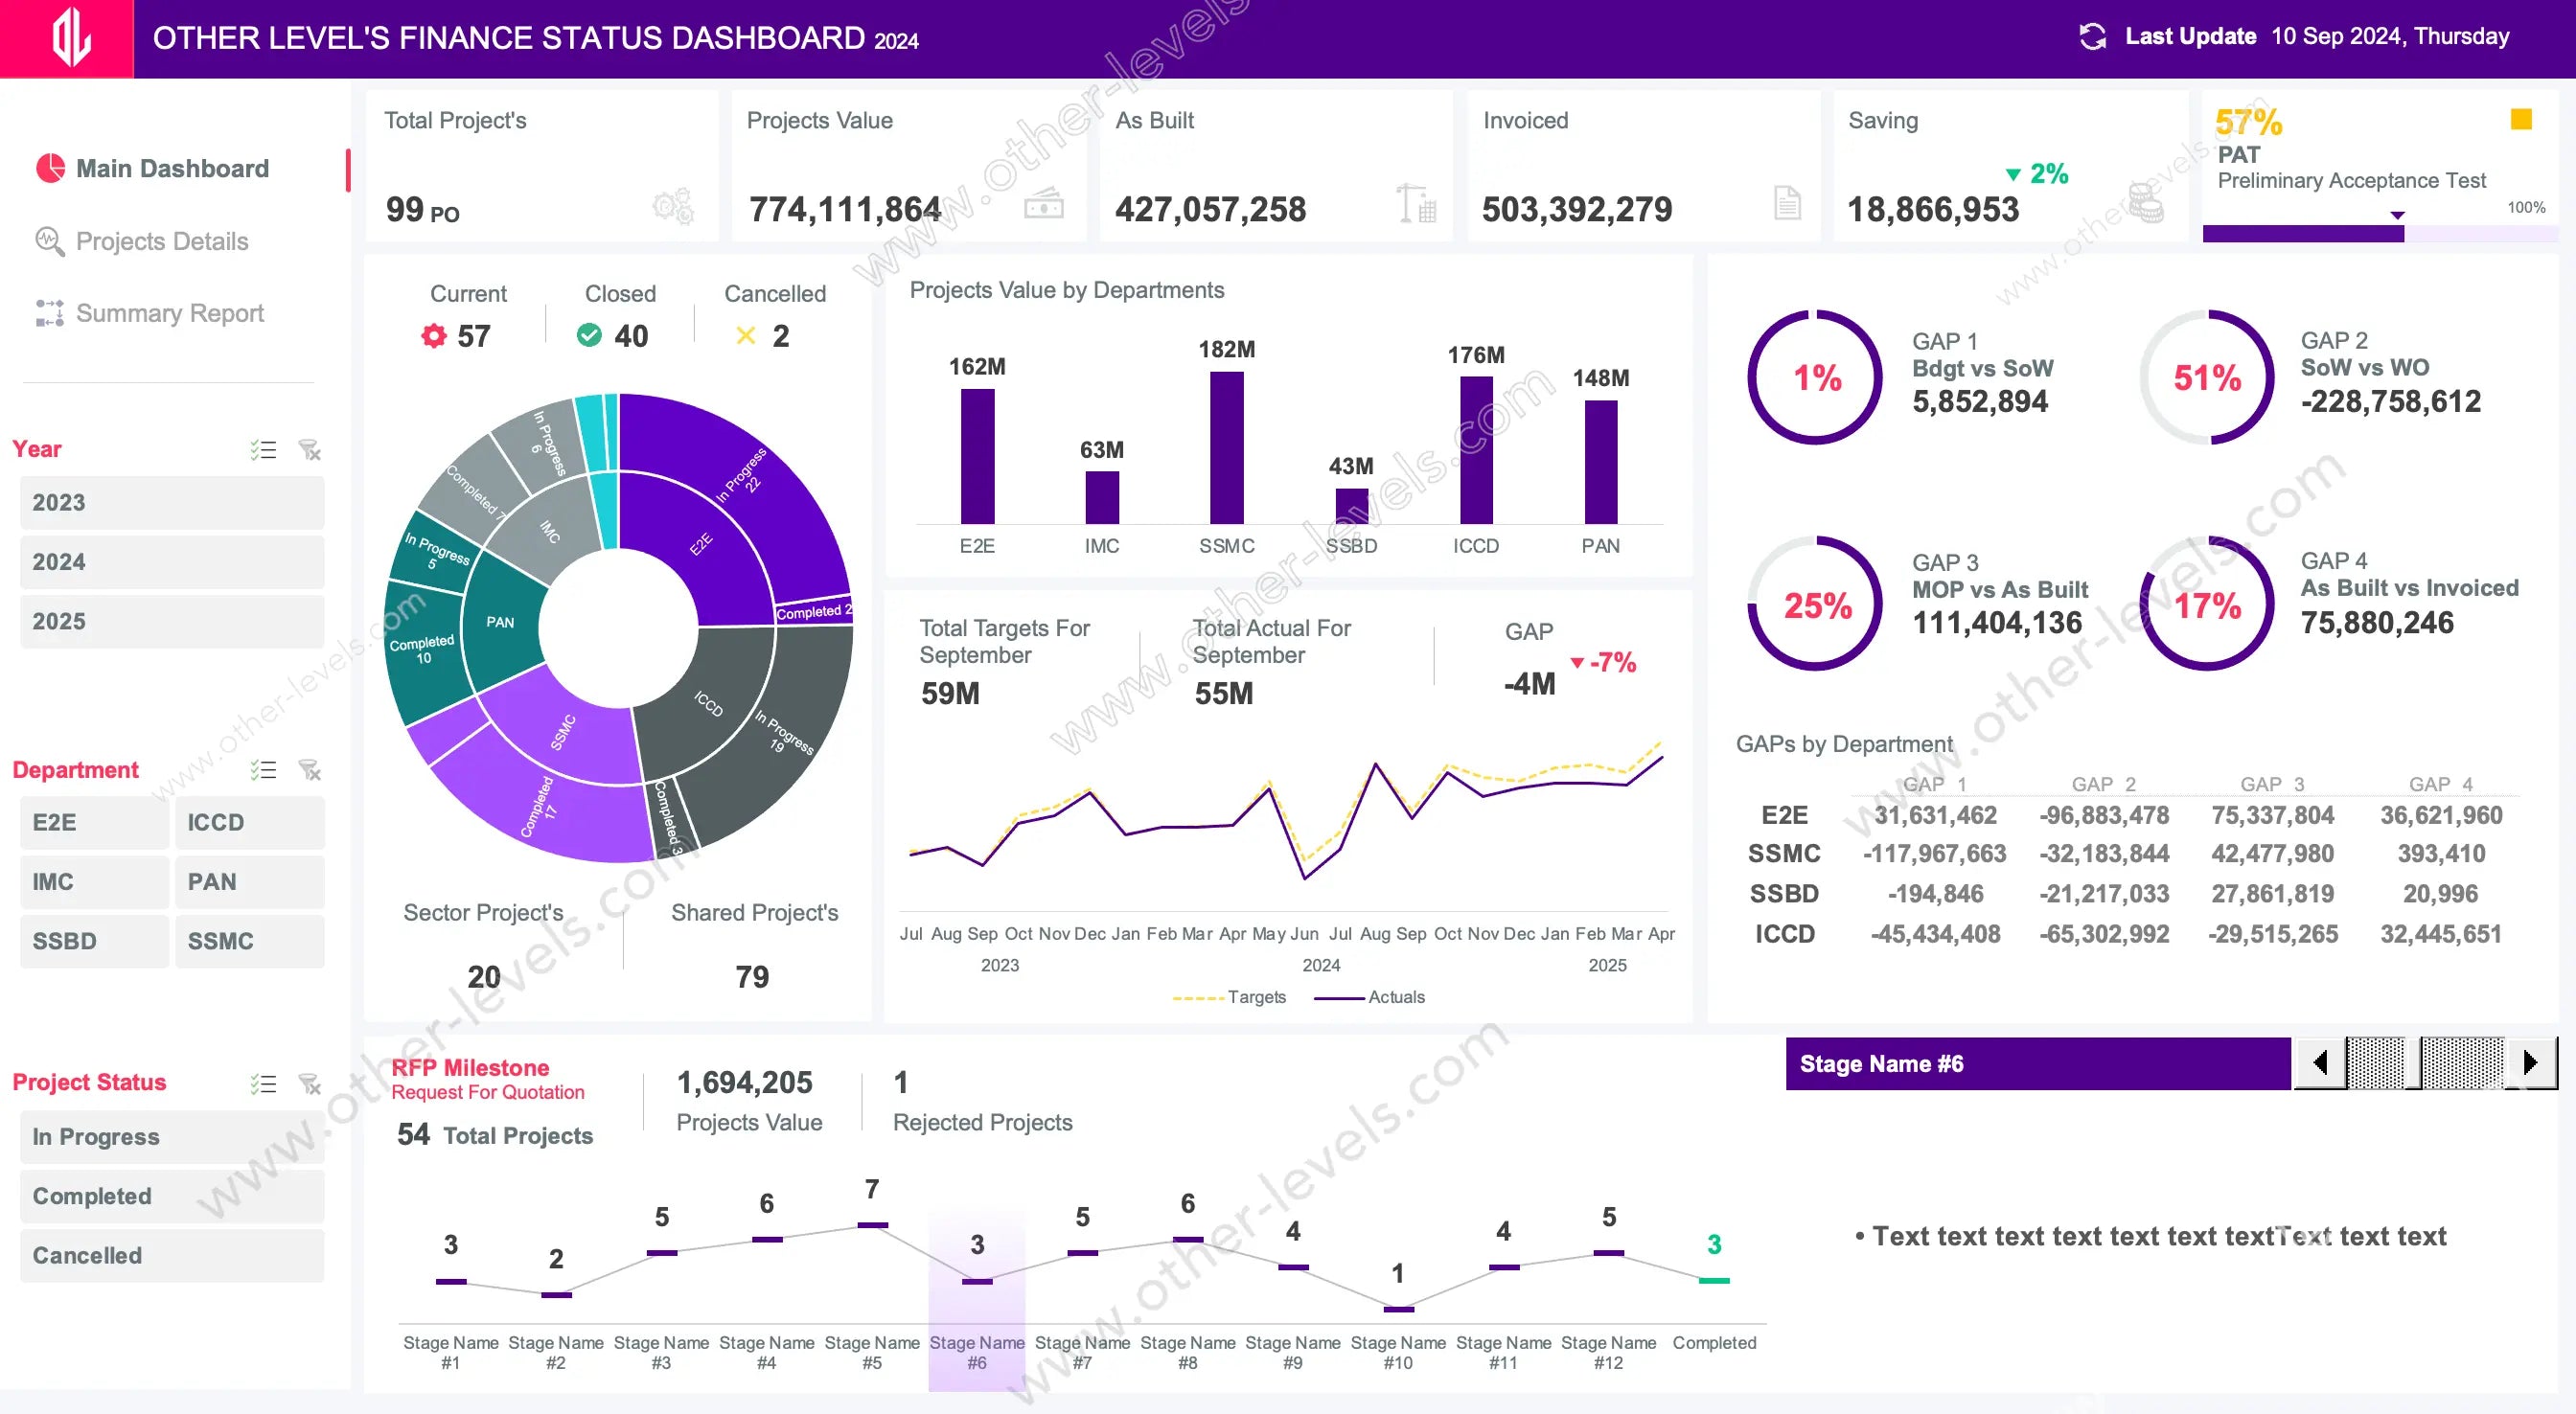
Meet the Dynamic & Interactive Dashboard – Finance Status & Projects Milestone. It turns Financial Status into clear, team-ready stories: filter by year, department, and status, then scan KPIs, gaps, and milestones in one Excel Dashboard without digging through raw tables.
How Financial Status Powers Decisions
Leaders align faster with monthly targets vs actuals, portfolio health, and risk flags. Short, focused visuals keep meetings practical, while a summary view is ready for print or share.
What’s Inside the Dashboard
- Executive KPIs for portfolio volume, value, execution, invoicing, readiness, and cost savings.
- Status sunburst and department bars for mix analysis and load balance.
- Dual-line trend to compare pacing over months and highlight budget vs actual.
- Four gap rings to reveal timing and exposure across delivery stages.
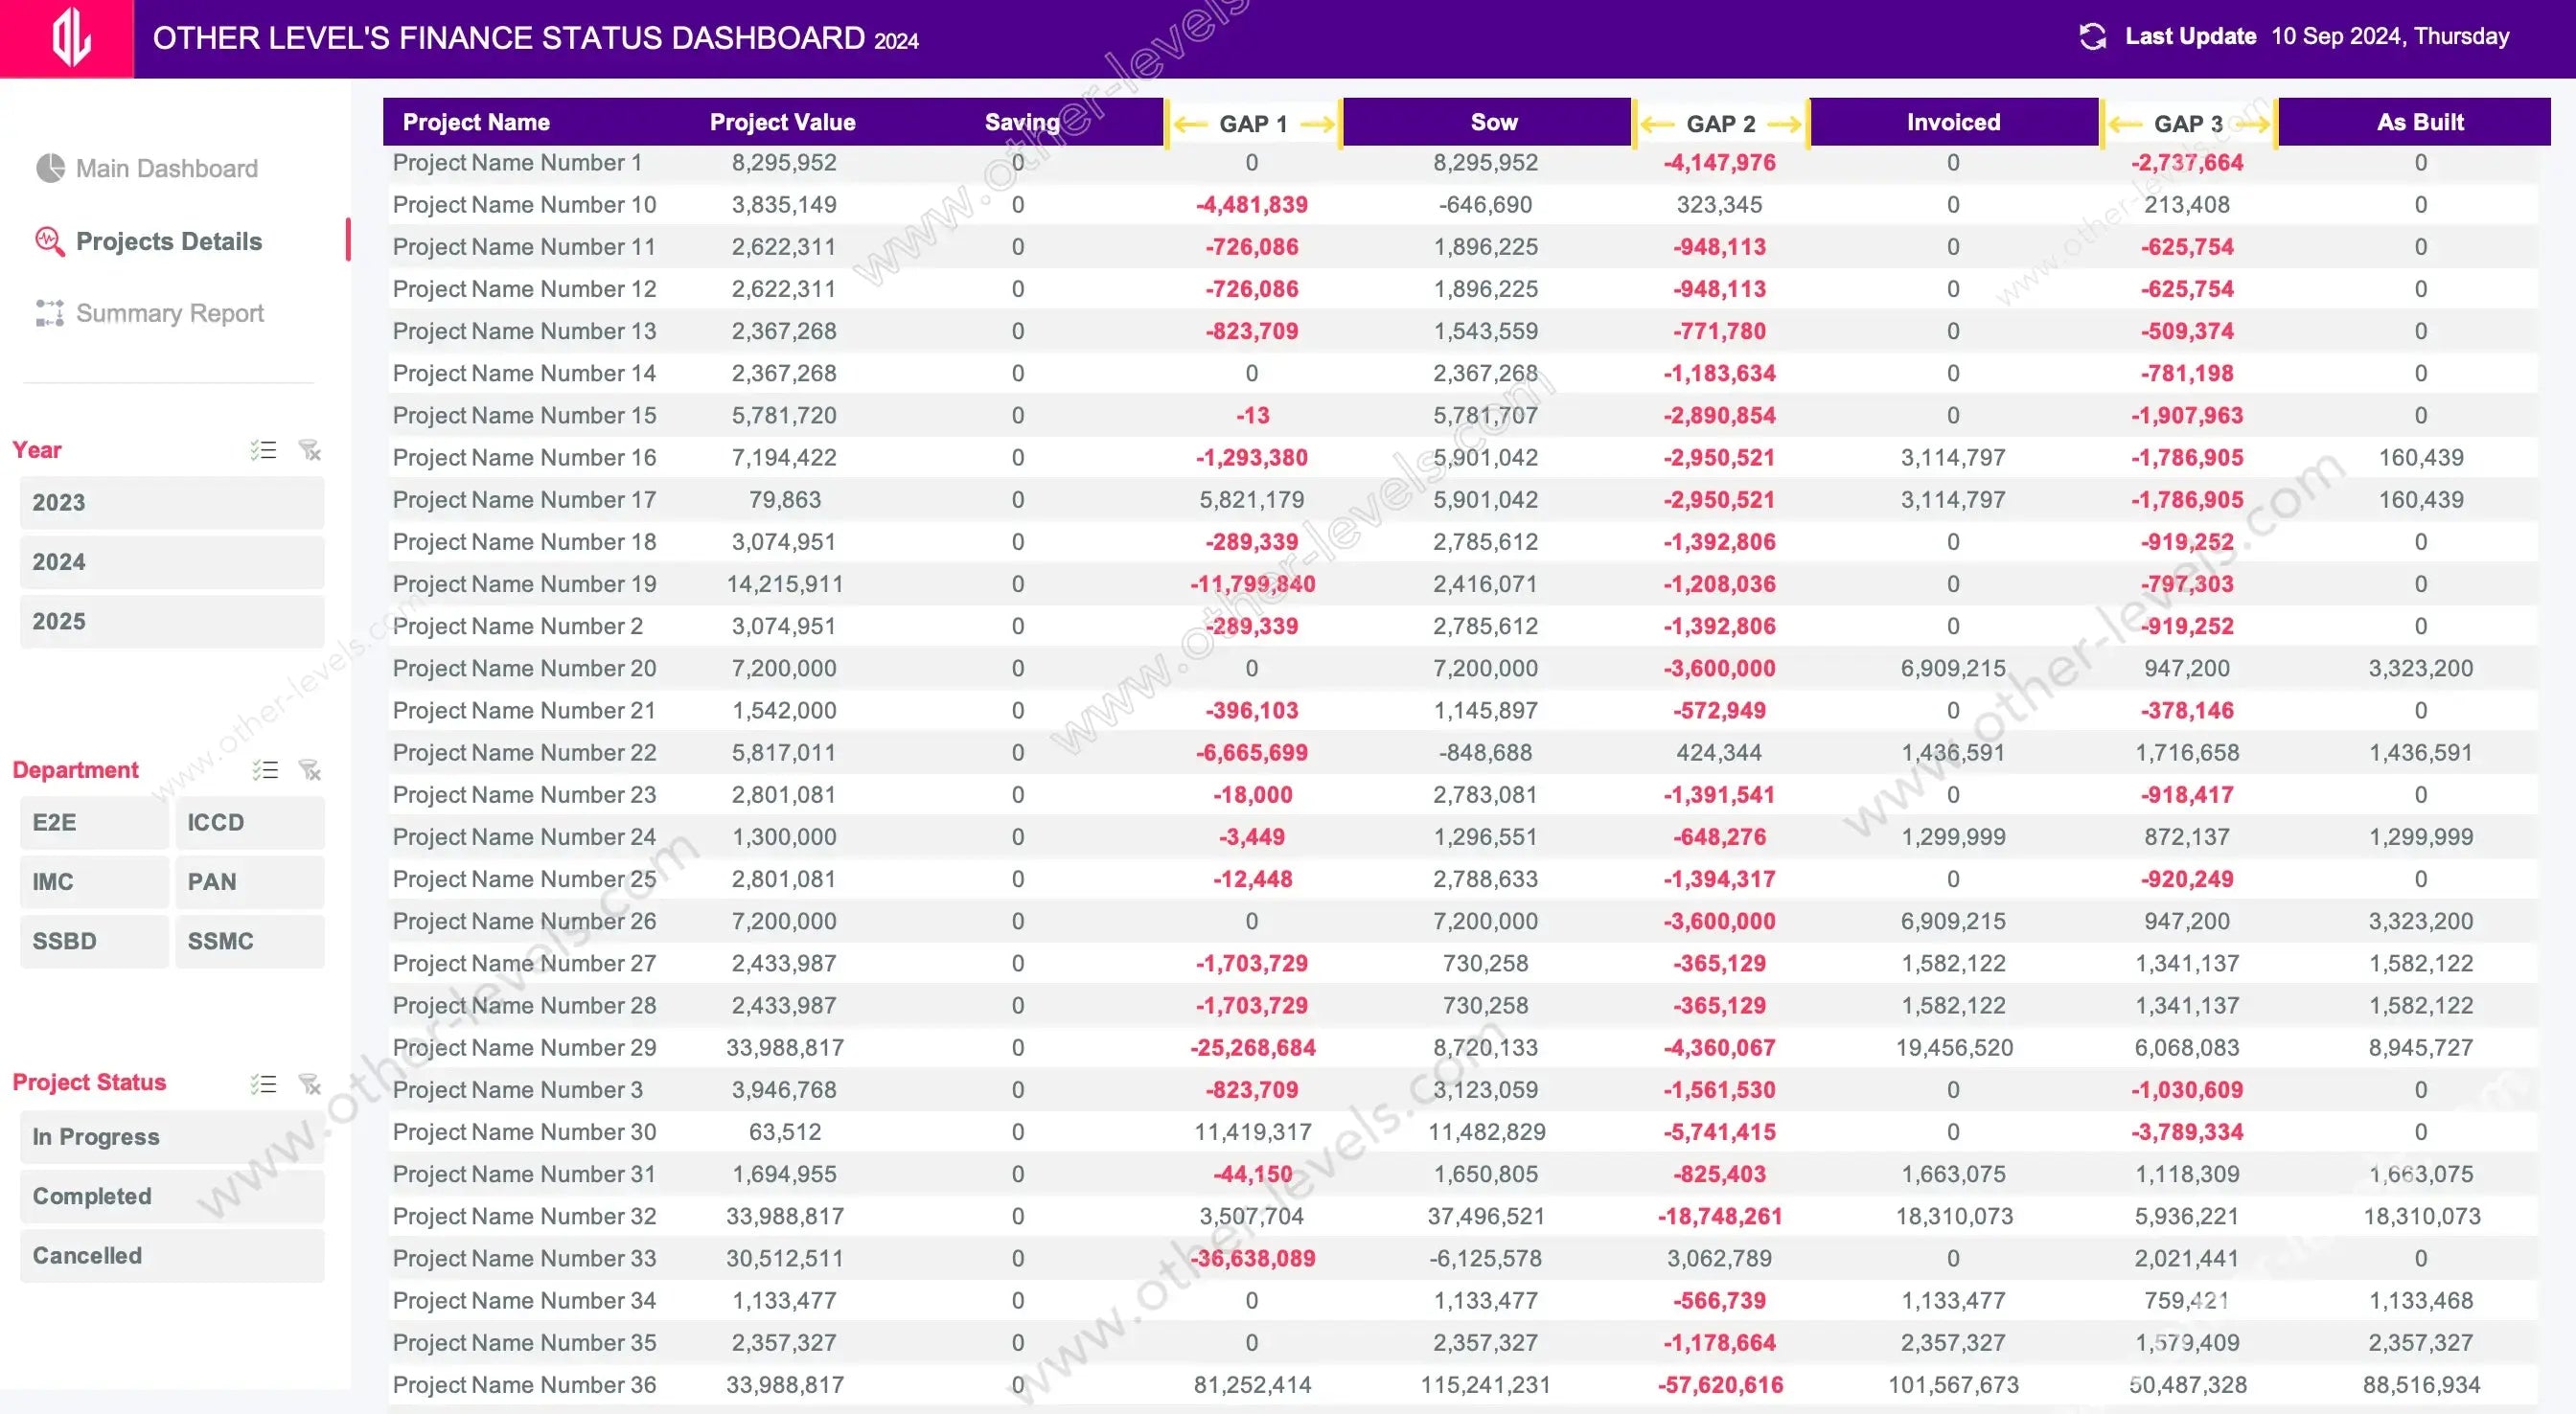
- Drillable register with conditional formatting and quick slicers.
Track Results & Close Variances
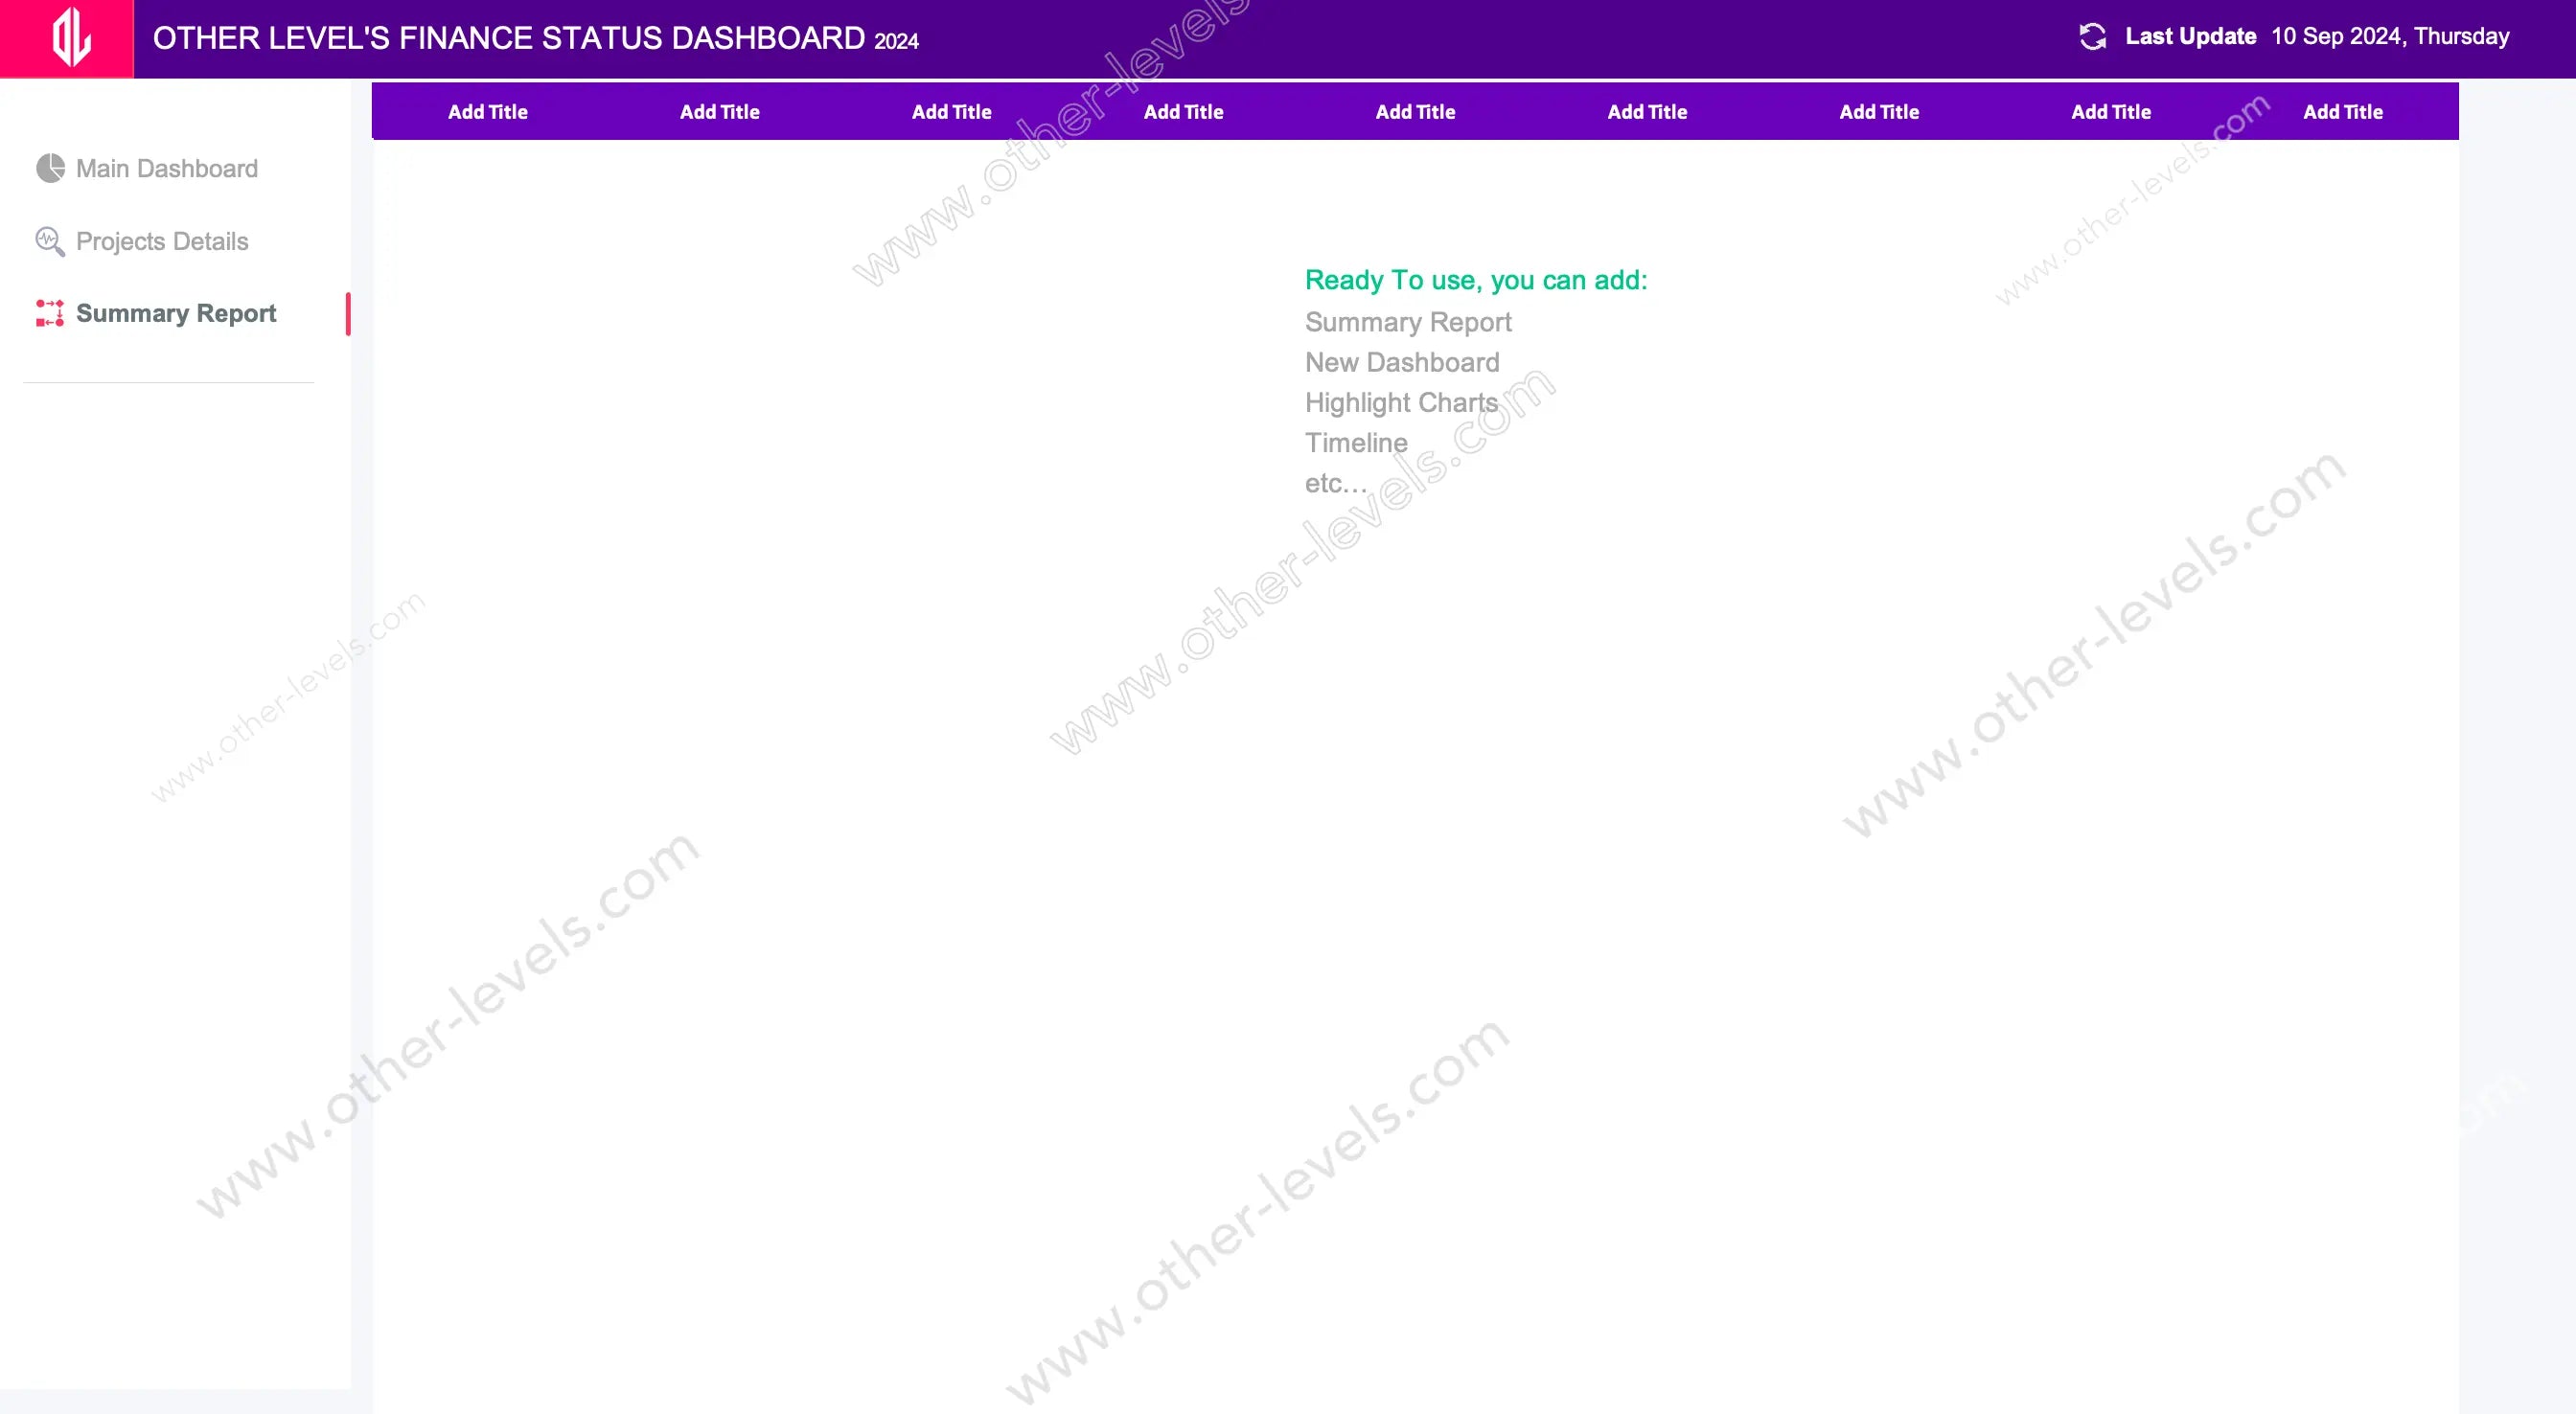
Use the variance view to prioritize actions, add notes beside stage sliders, and export the summary for rapid updates. It supports financial planning and analysis without extra setup.
Quick Specs
- Readable H2/H3 hierarchy and scan-friendly sections.
- Clickable charts, resettable slicers, and print-ready summaries.
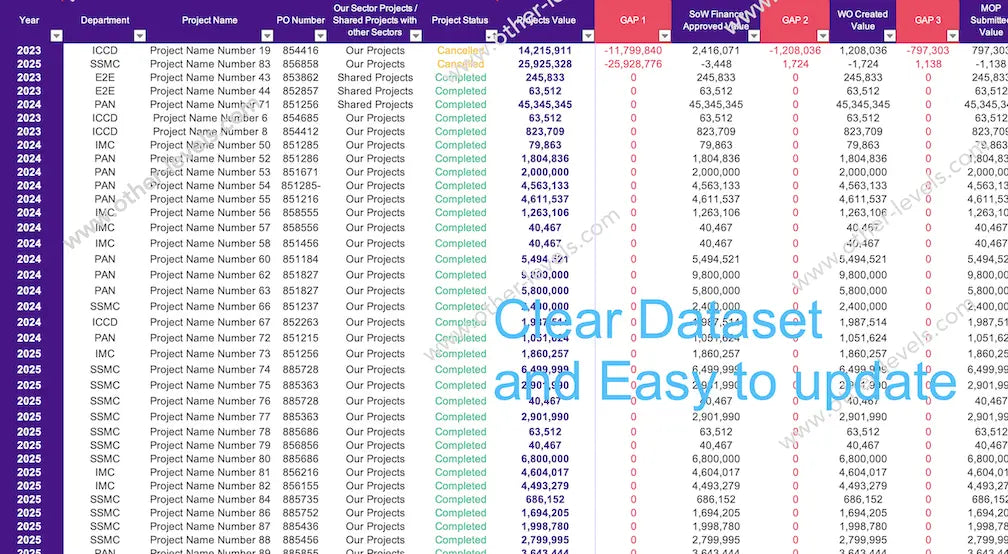
- Refresh by appending rows to the source Spreadsheet.
Use Cases
- PMO portfolio checkpoints and project management milestones.
- Finance huddles for monthly variance storytelling and financial business plan reviews.
- Construction oversight for a construction project manager using consistent reports.
Related templates for deeper analysis
- Excel KPIs Scorecards Dashboard & Data Analysis Tool – a unified Excel Dashboard for KPI tracking and reporting.
- Finance & Accounting Bundle – end-to-end toolkit for budget vs actual and financial planning and analysis.
Video Tutorial
Watch the full Dynamic & Interactive Excel Dashboard tutorial on our Other Levels YouTube Channel
Specifications
Get all essential details in one place. From features and package contents to software compatibility and skill level required, this section gives you a clear overview so you know exactly what to expect before download.
Template Features
Package Details
Software Compatibility
Skill Level Required
Intermediate
FAQs
Please read our FAQs page to find out more.
Are the templates fully customizable?
Yes, all our templates are fully customizable. You can adjust the layout, data, and design elements to fit your specific needs. Our templates are designed to be flexible, allowing you to easily tailor them to your preferences.
Can I order a product in any language?
Yes, we provide products in any language. Simply select the "Dashboard language change" Service and once your order is placed, you will receive it within 48 hours.
What happens if I choose the wrong monitor screen size for my dashboard?
If you choose the wrong screen size, the dashboard may not display correctly on your monitor. Elements could appear too large, too small, or misaligned, affecting the readability and usability of the dashboard. We recommend selecting the appropriate screen size to ensure optimal viewing and performance.
Do I need specific skills to use the advanced Excel dashboard templates?
Our advanced Excel dashboards are easy to use, the only thing you need to know is how to work with PivotTables. With basic knowledge of PivotTables, you'll be able to customize and fully utilize these templates effortlessly. "Please check the skill level required"
All dashboards are 100% editable Excel files. Learn how to use them through our video tutorials, included datasets, and lifetime access program.