
✅ Instant Digital Delivery | 🔒 Secure Checkout | ⭐ Trusted by 1,000+ Professionals | 💬 24hr Support
Supply Chain KPI Dashboard – Freight Analytics and Planning
Pairs well with
Supply Chain KPI Dashboard – Freight Analytics and Planning
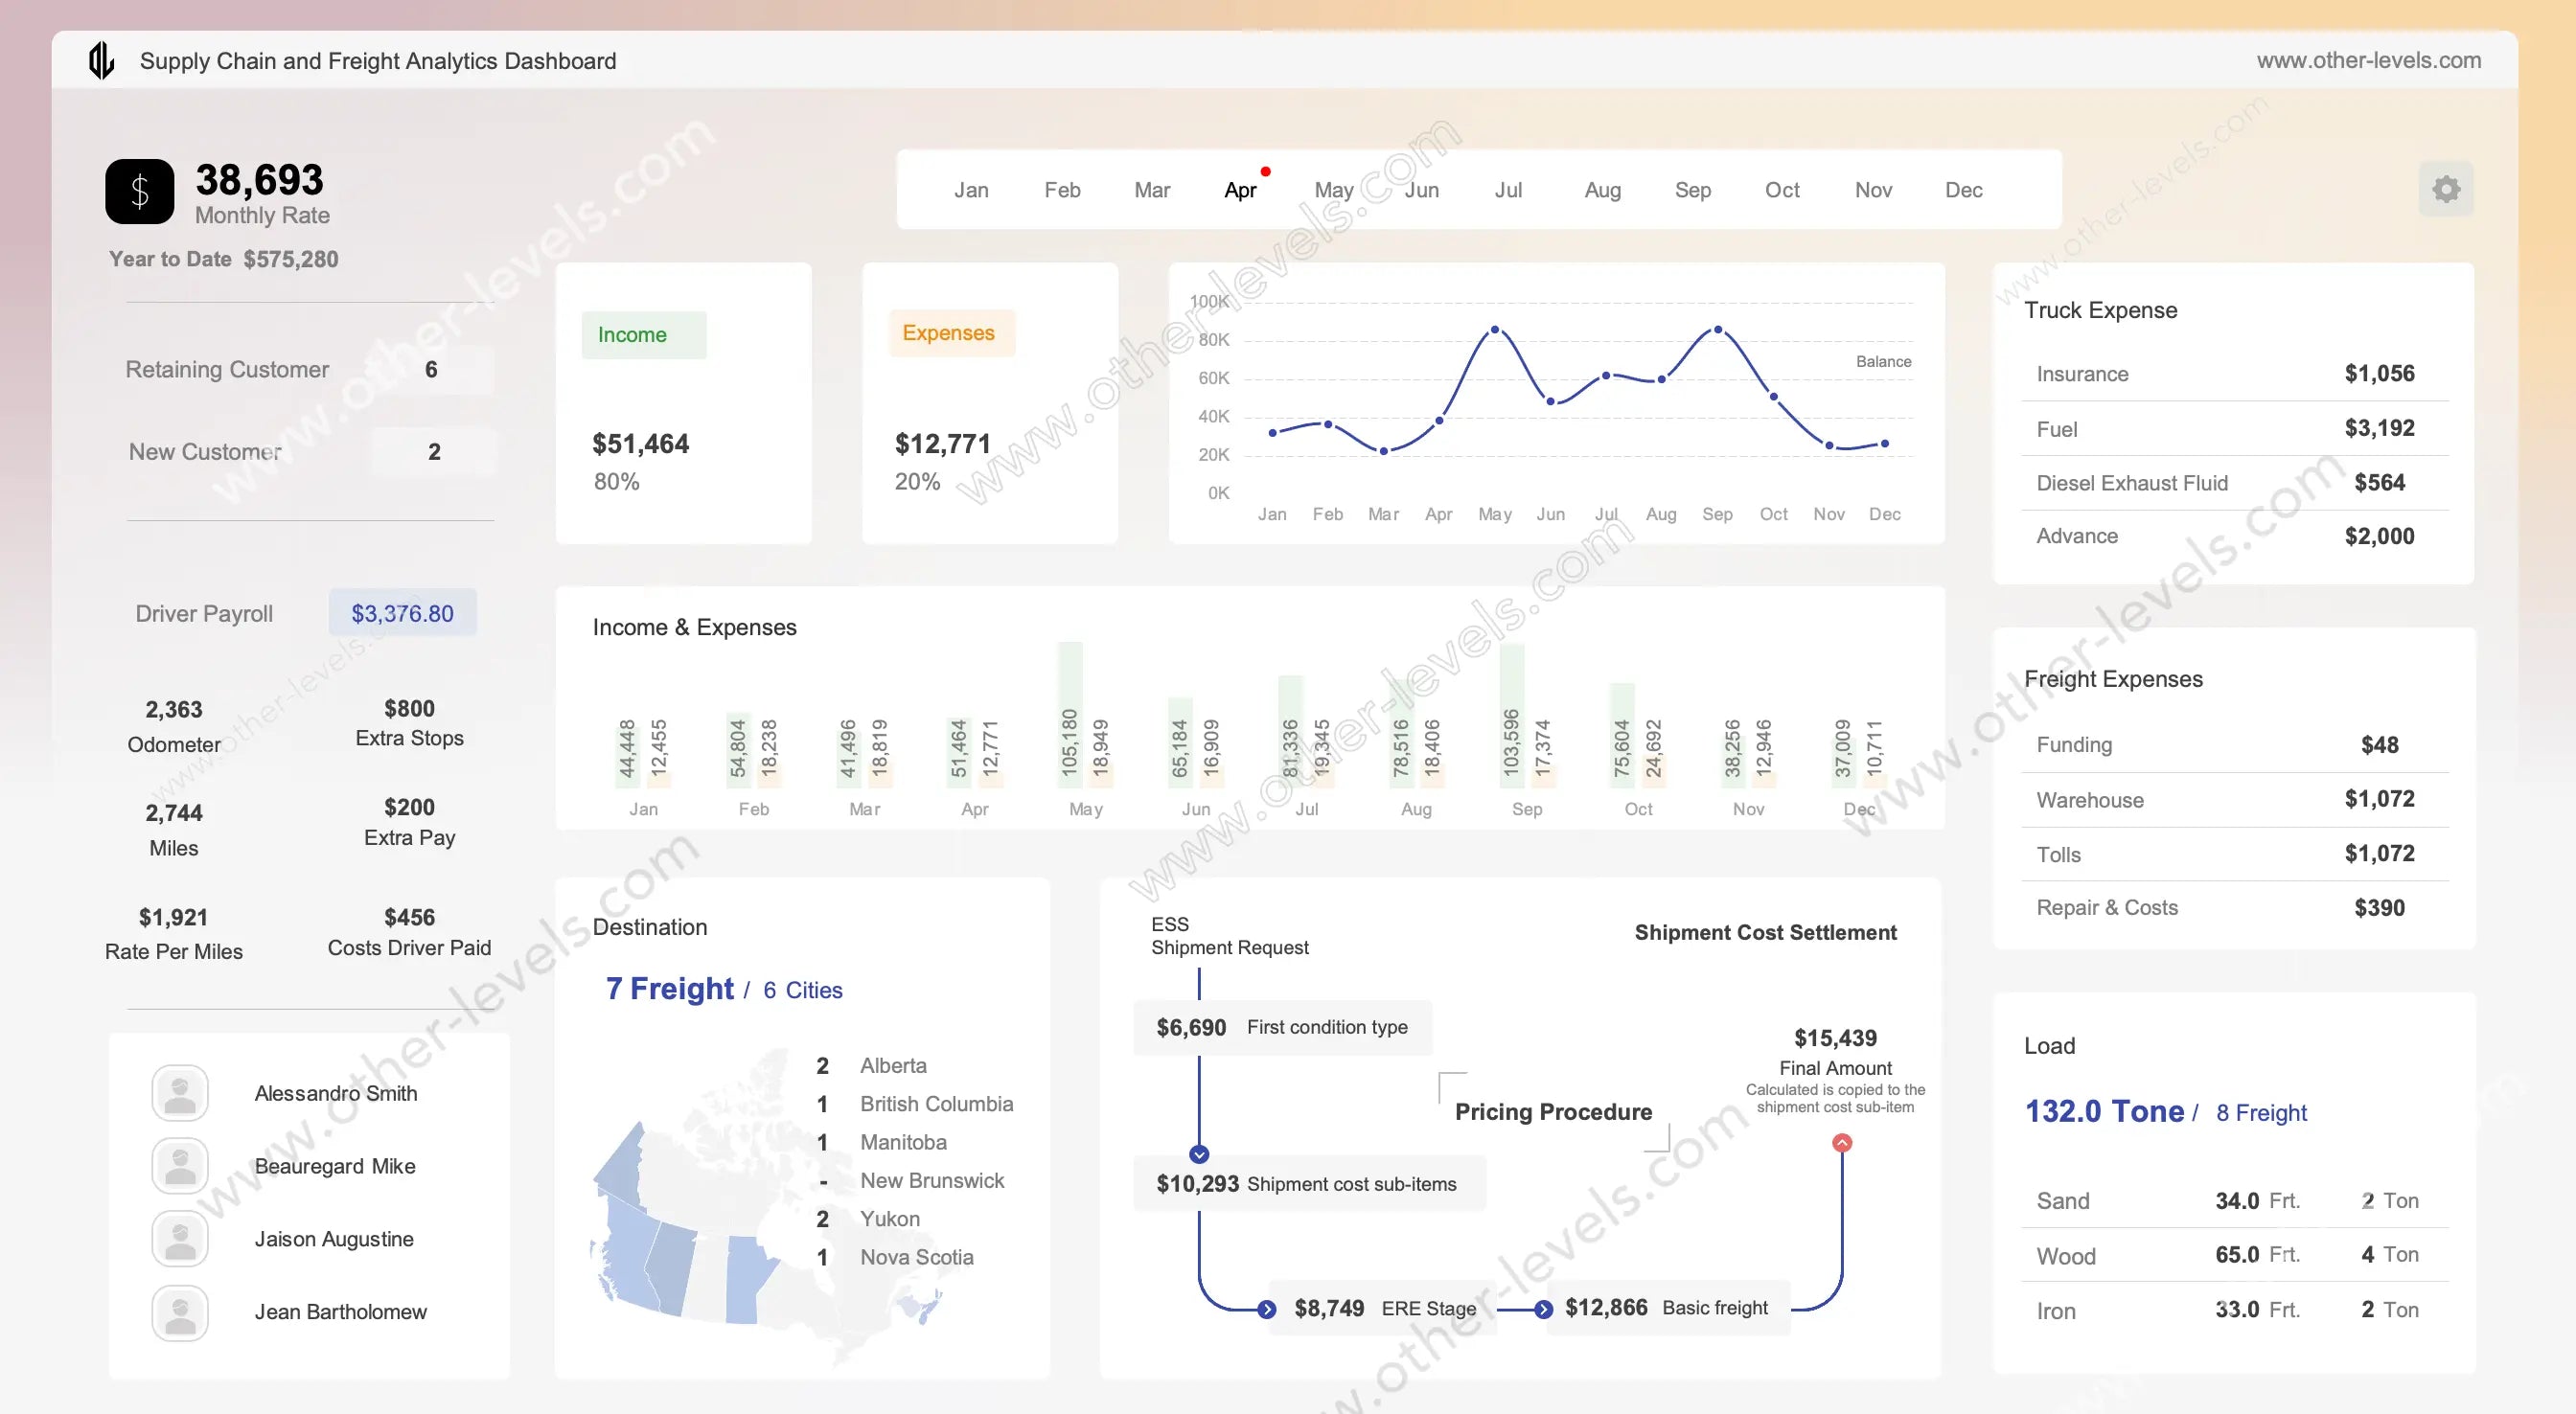
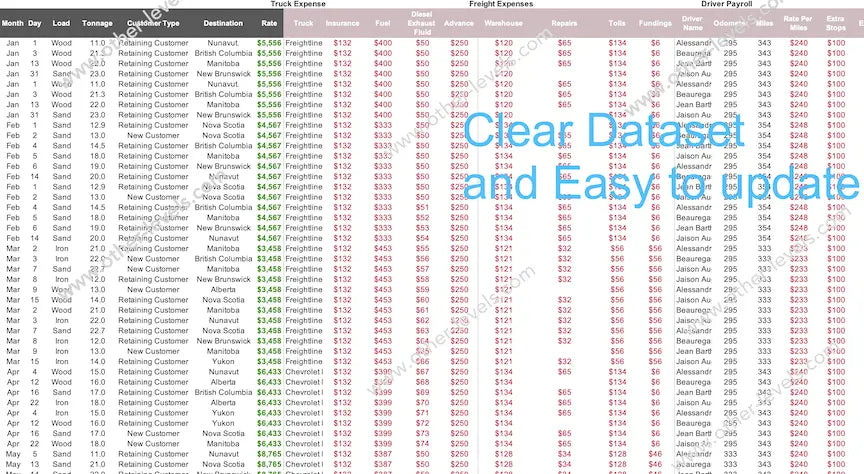
This Excel Dashboard turns messy logistics data into clear signals. If you’re a supply chain analyst or a supply chain manager, you’ll notice the pace right away: monthly results, YTD progress, and customer mix. In practice, it supports supply chain planning, supply chain finance, and everyday ops for teams delivering supply chain services. Data can come straight from your Spreadsheet or any report kept in an excel format for expense reports.
Global Controls
Monthly slicer
Scan one month or step through the year—fast, focused, and comparable.
Drivers slicer
Filter by driver to compare routes, effort, and costs without losing context.
KPI Cards
Monthly rate and year-to-date
Two headline KPIs show momentum now and progress so far. Simple, reliable.
Customer mix
Quick tiles for Retaining Customer and New Customer—easy churn and growth read.
Income and expenses split
Percent share cards line up finance and ops on the same story.
Trends and Comparisons
Balance (Monthly) — Line chart
See rises and dips over time; here’s the thing, planning usually starts here.
Income and Expenses (Monthly) — Clustered column chart
Two series, side by side. Classic kpi and dashboard review for margin sense. Great when you’re evaluating kpi dashboard software or curating multiple kpi dashboards into one supply chain kpi dashboard.
Cost Breakdown
Truck Expense — Category list/table
Fuel, insurance, DEF, advances—watch truck maintenance and running costs.
Freight Expenses — Category list/table
Warehouse, tolls, repairs, funding—spot patterns that shape rate decisions and freight analytics.
Operations
Driver payroll analysis
Driver payroll ties miles, rate per mile, extra stops, and reimbursables together. In practice, this is where coaching and incentives click.
Network View
Destination — Filled map with ranked list
Where freight concentrates and where it’s thin—useful even if you aim to be the best truck logistics company for freight analytics.
Cost Transparency
Pricing procedure — Shipment cost settlement (process flow)
From request to sub-items to final amount—clear logic for freight shipment cost talks with finance and customers.
Load Mix
Freight count and tonnage by material
What you move, how heavy it is—guides asset use and seasonal planning.
Use Cases and Research
Built for day-to-day reviews and for a supply chain management research report that needs live, defendable numbers.
Related Products
Extend the flow with Vendors Performance and Compliance Excel Dashboard for supplier risk and with Workflow Automation Tracker for approvals and handoffs.
Video Tutorial
Watch the full Supply Chain KPI Dashboard tutorial on our Other Levels YouTube Channel
Specifications
Get all essential details in one place. From features and package contents to software compatibility and skill level required, this section gives you a clear overview so you know exactly what to expect before download.
Template Features
Package Details
Software Compatibility
Skill Level Required
Intermediate
FAQs
Please read our FAQs page to find out more.
Are the templates fully customizable?
Yes, all our templates are fully customizable. You can adjust the layout, data, and design elements to fit your specific needs. Our templates are designed to be flexible, allowing you to easily tailor them to your preferences.
Can I order a product in any language?
Yes, we provide products in any language. Simply select the "Dashboard language change" Service and once your order is placed, you will receive it within 48 hours.
What happens if I choose the wrong monitor screen size for my dashboard?
If you choose the wrong screen size, the dashboard may not display correctly on your monitor. Elements could appear too large, too small, or misaligned, affecting the readability and usability of the dashboard. We recommend selecting the appropriate screen size to ensure optimal viewing and performance.
Do I need specific skills to use the advanced Excel dashboard templates?
Our advanced Excel dashboards are easy to use, the only thing you need to know is how to work with PivotTables. With basic knowledge of PivotTables, you'll be able to customize and fully utilize these templates effortlessly. "Please check the skill level required"
All dashboards are 100% editable Excel files. Learn how to use them through our video tutorials, included datasets, and lifetime access program.