✅ Instant Digital Delivery | 🔒 Secure Checkout | ⭐ Trusted by 1,000+ Professionals | 💬 24hr Support
Profit and Loss Statement Template – Excel Dynamic Chart Dashboard
Pairs well with
Profit and Loss Statement Template – Excel Dynamic Chart Dashboard
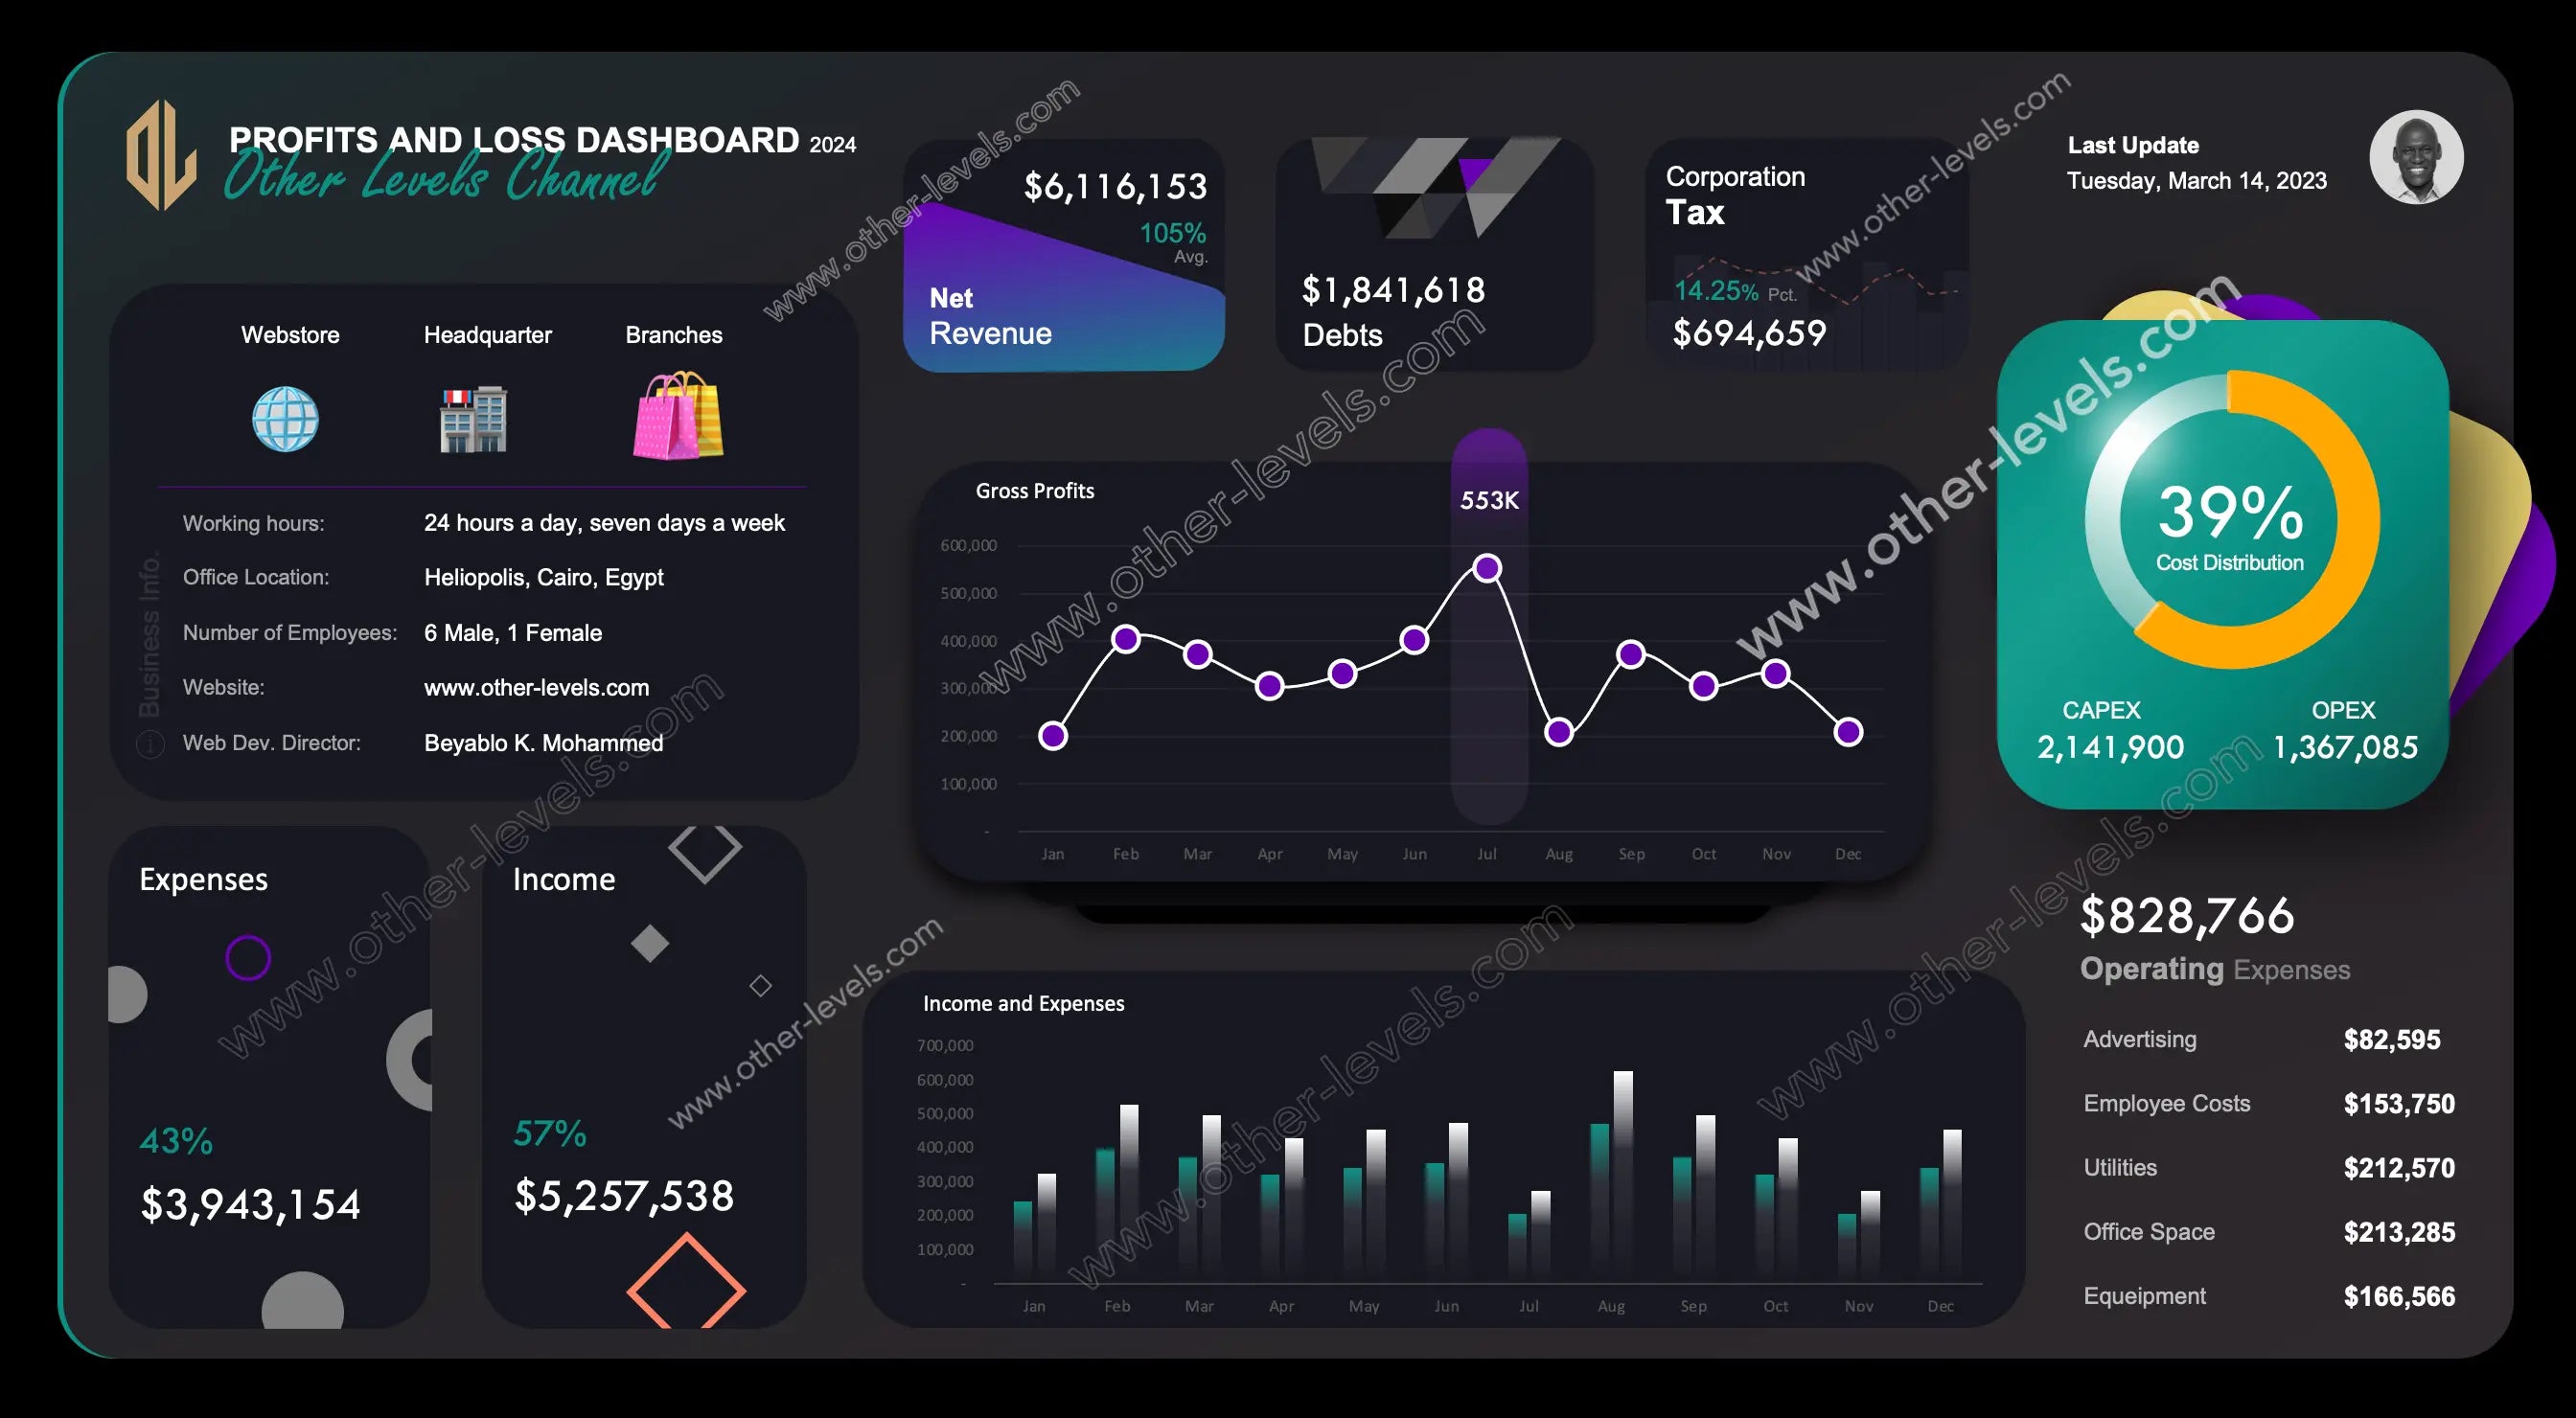
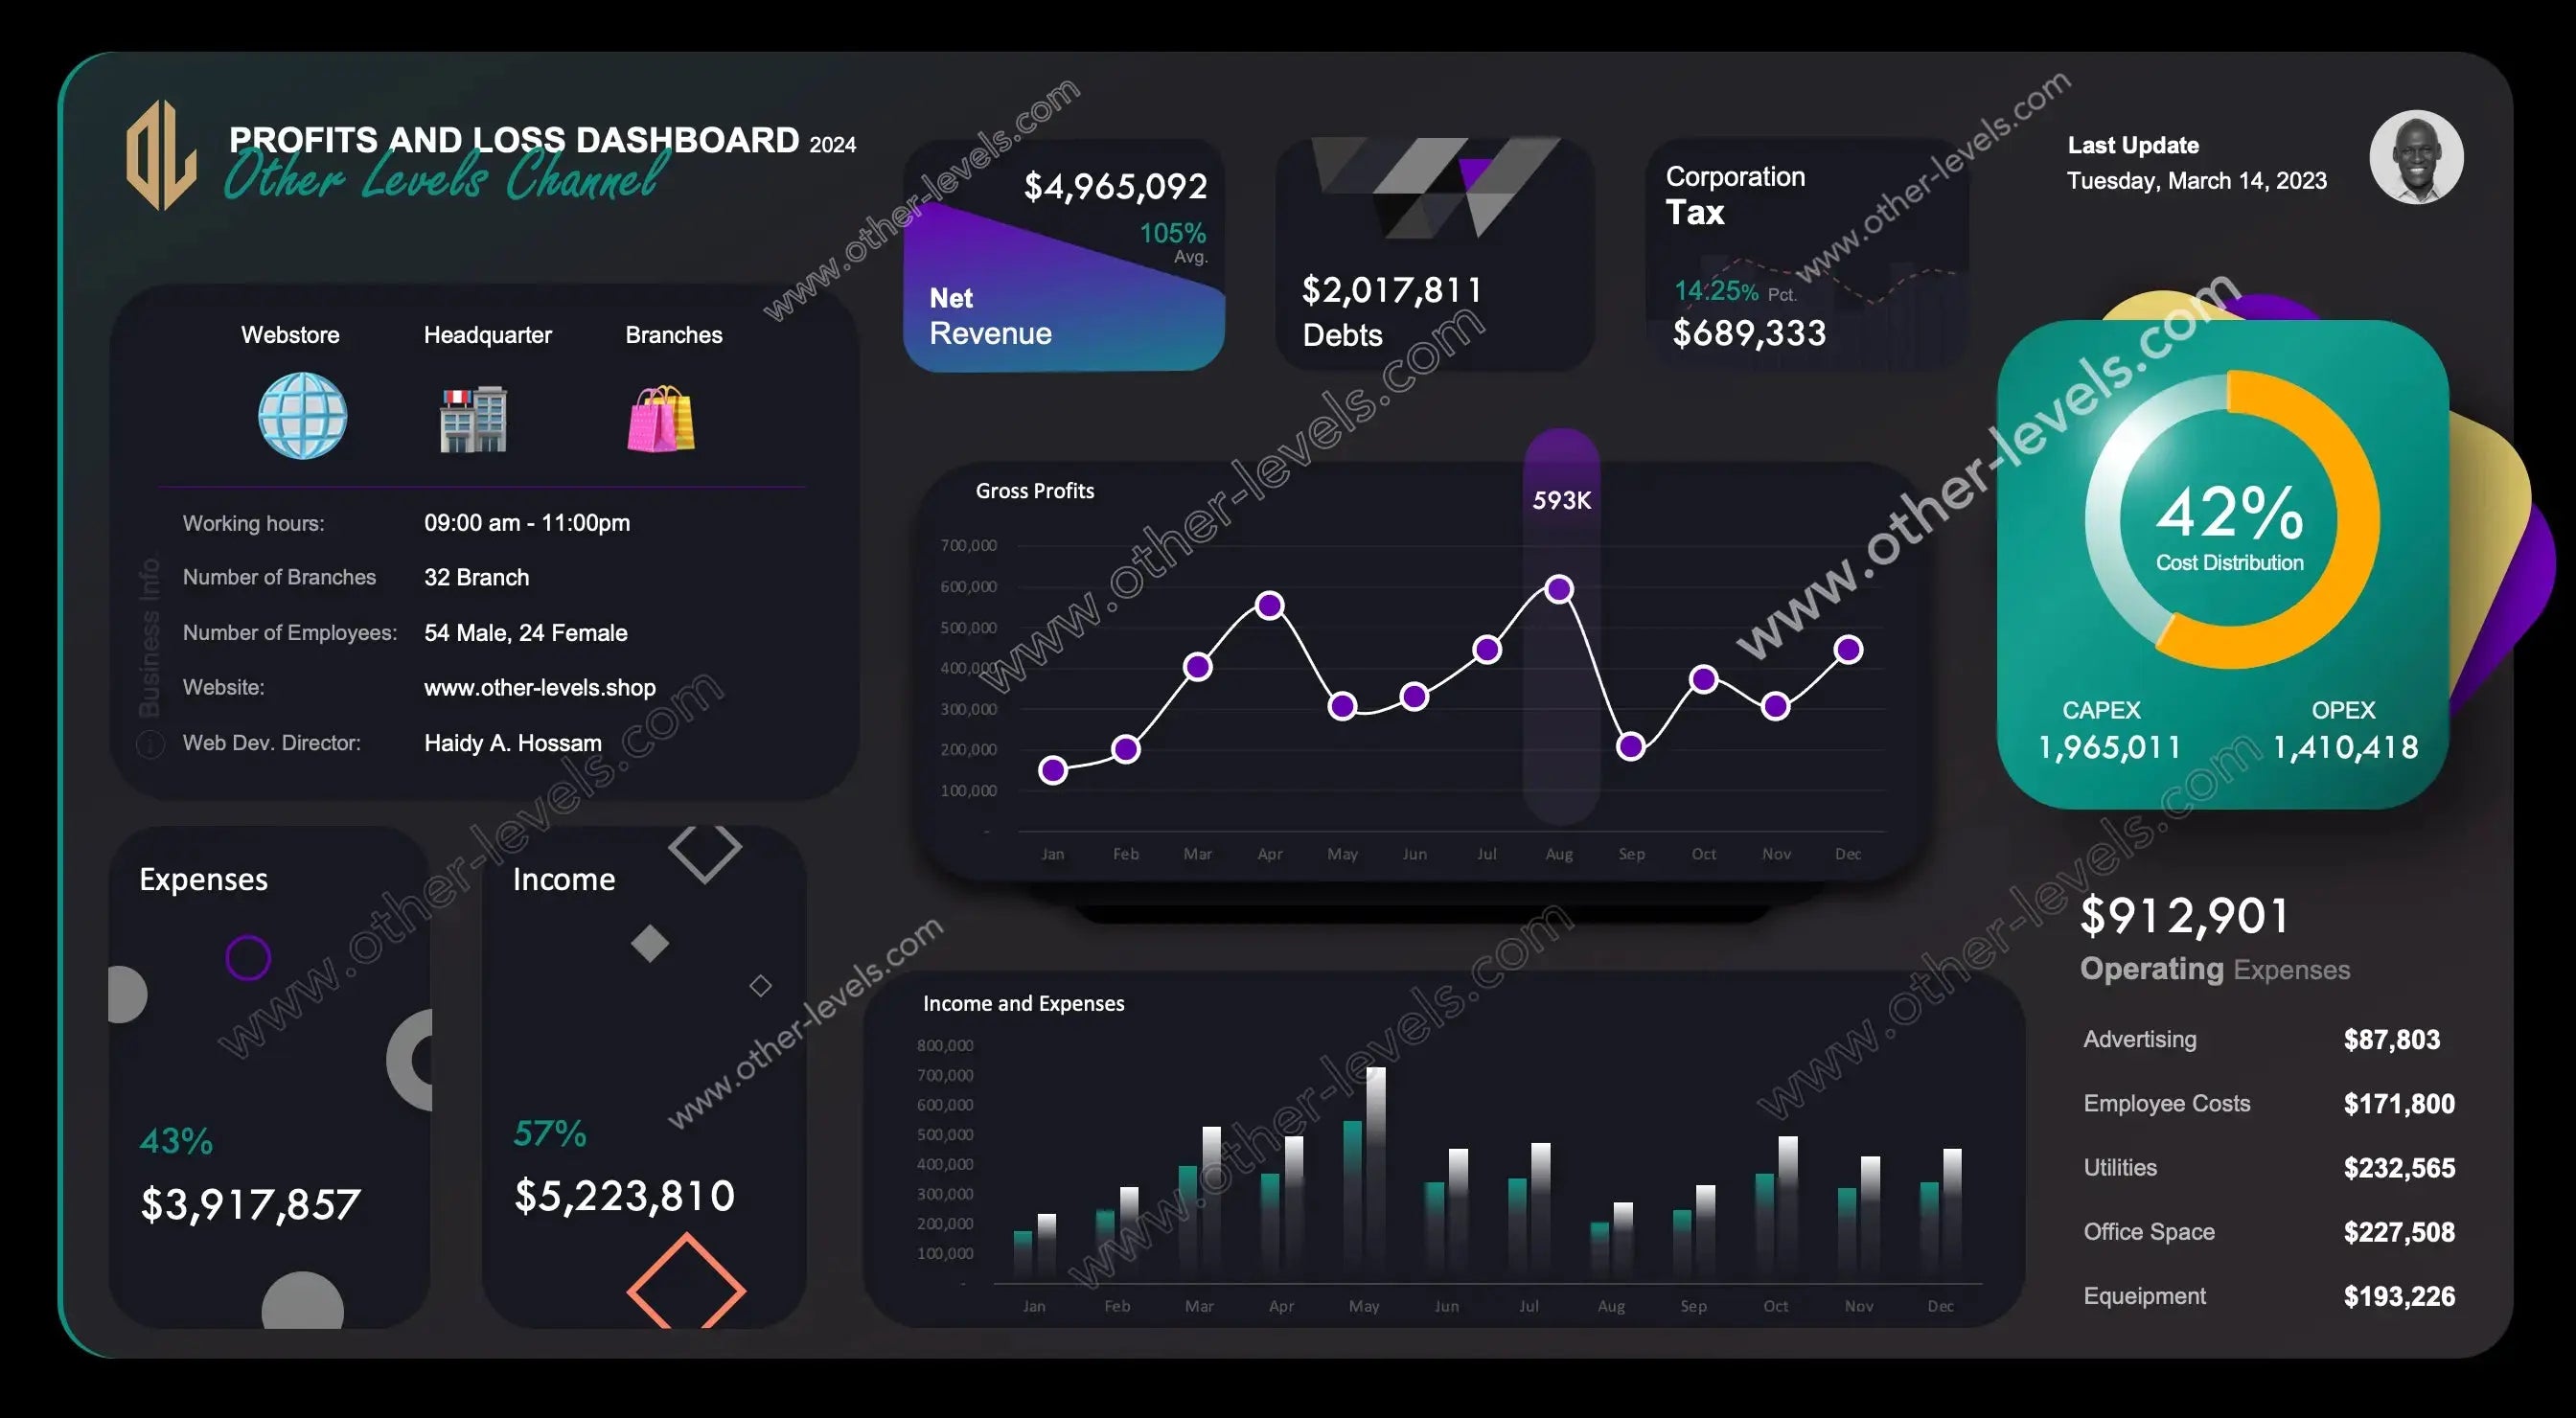
Gain full financial visibility with this Excel Dashboard built to simplify profit and loss reporting and turn raw data into decisions. The template unifies income, expenses, taxes, and gross profit inside an elegant dark-mode interface. Dynamic visuals, clean KPI cards, and automated links to your dataset make monthly reviews faster, clearer, and presentation-ready.
Visual Financial Analysis Made Simple
This financial dashboard excel consolidates your numbers into interactive charts and cards so teams can track trends and spot outliers quickly. It includes a donut-based cost distribution dashboard (CAPEX vs OPEX), a line chart for monthly gross profits, and clustered columns comparing income and expenses. Every element updates as you refresh data—no manual recalculation.
Excel Dashboard Features
- Dynamic line and column charts for monthly profit and loss statement excel analysis
- Editable donut chart for CAPEX/OPEX insight and cleaner storytelling
- Smart KPI cards for net revenue, debts, taxes, income, and expenses
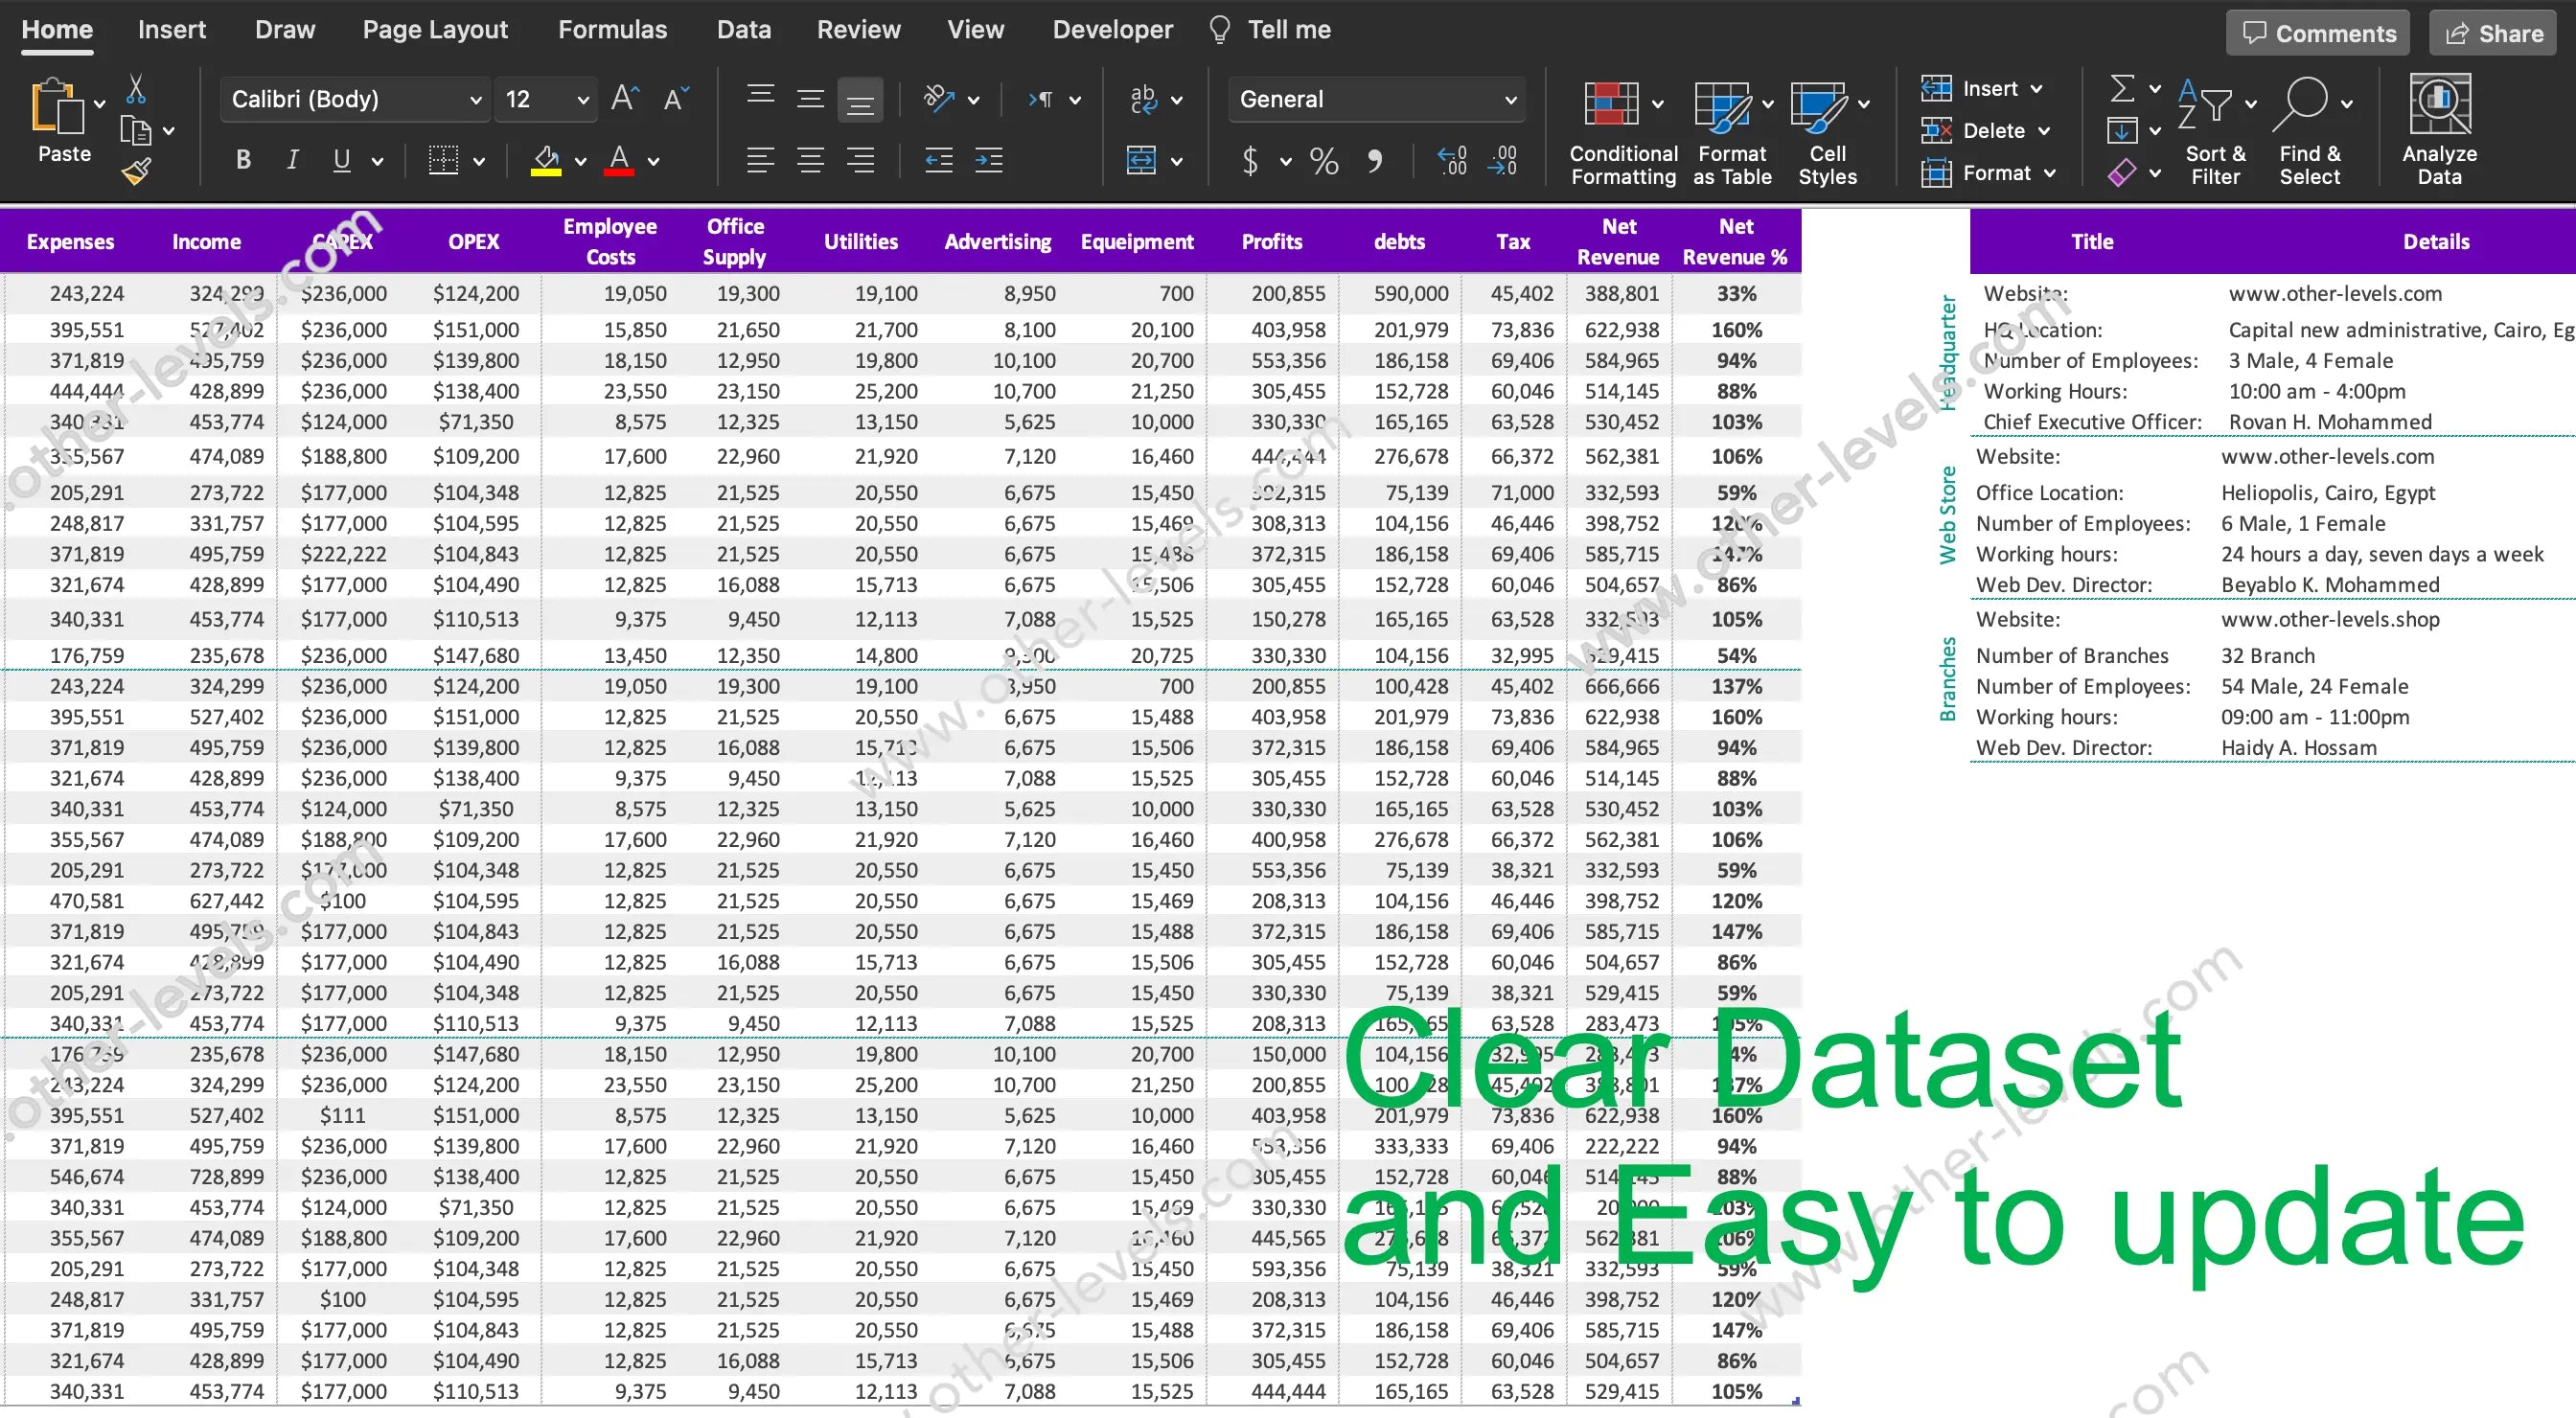
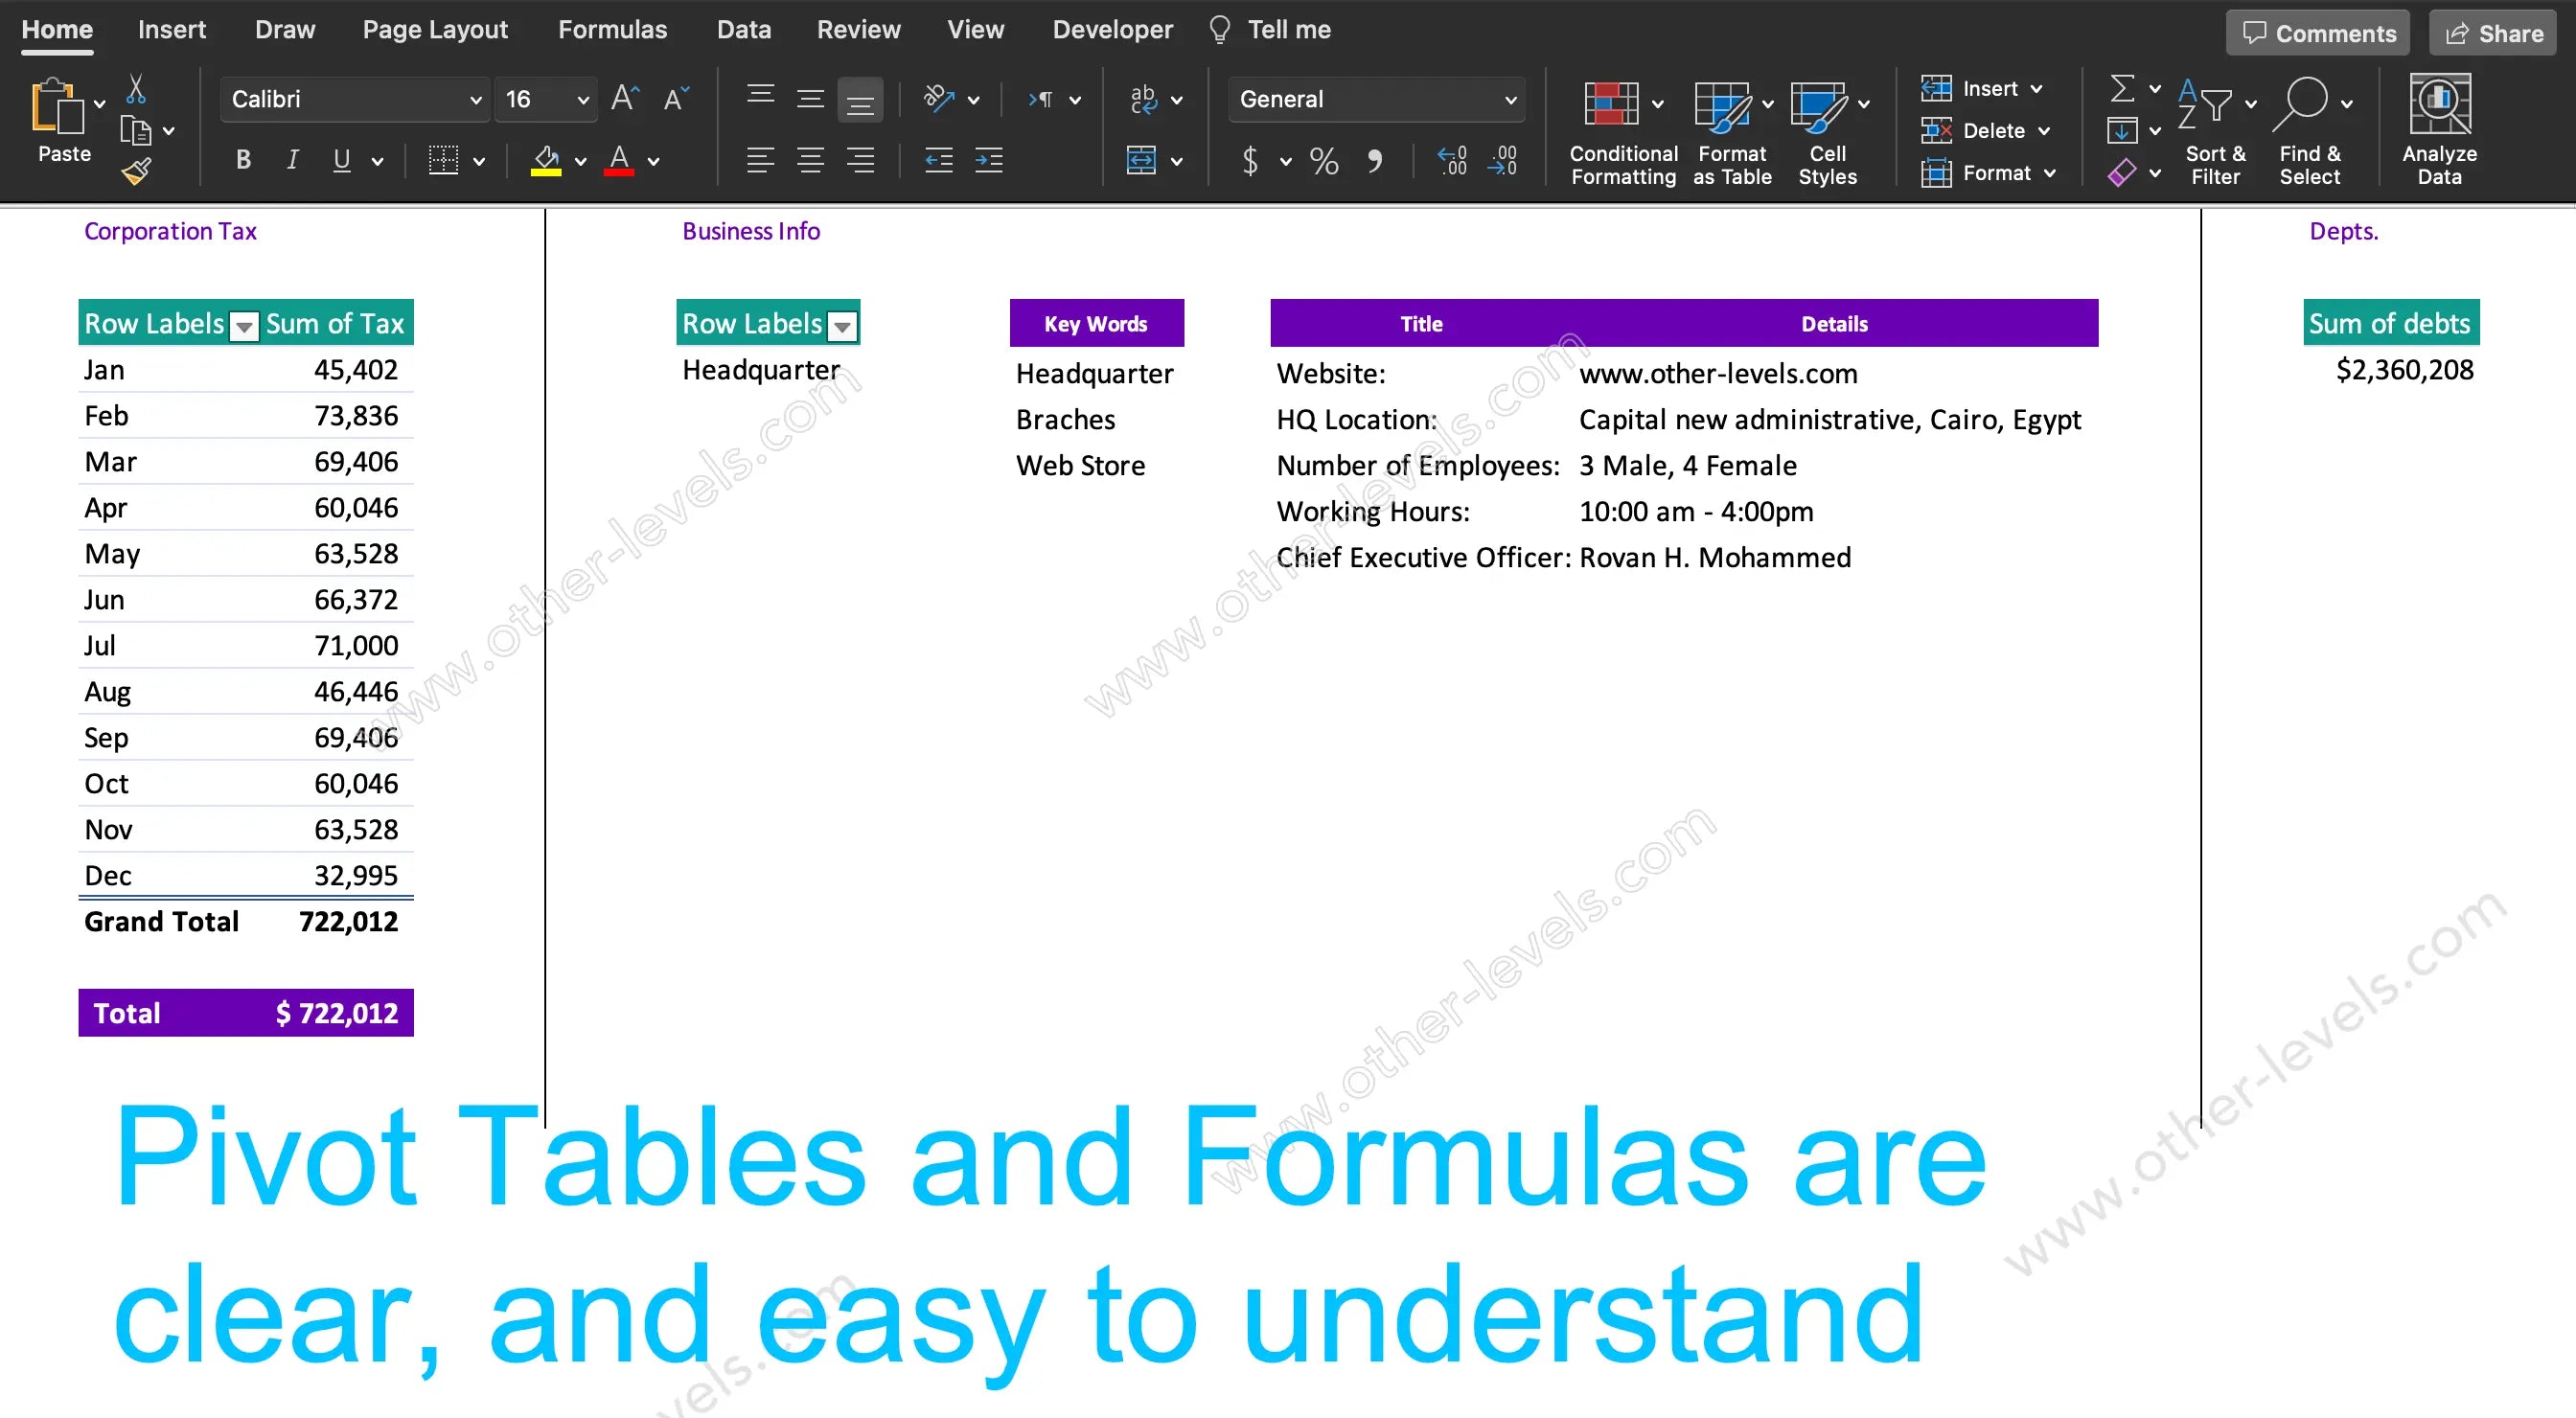
- Automated structure using formulas, pivot tables, and data links
- Modern dark-mode design optimized for meetings and reports
- Ideal for startups, finance teams, and SMEs needing an income statement template
Why Teams Choose This Template
The dynamic chart excel template reveals patterns at a glance, while the kpi financial dashboard highlights what matters for growth and cost control. Use it for monthly reviews, board decks, or branch-level comparisons without rebuilding charts each time.
Use Cases
- Monthly and annual performance tracking
- Management and client presentations
- Operational expense and revenue analysis
- Profitability reviews across projects or locations
Explore Related Excel Dashboards
Extend your reporting with the Profits & Loss Dashboard with creative slicer and dynamic indicator or analyze trends in depth using the Restaurants Sales Analytics Excel Dashboard. Both complement this Profit and Loss system for complete business insight.
Video Tutorial
Watch the full tutorial on our Other Levels YouTube Channel
Specifications
Get all essential details in one place. From features and package contents to software compatibility and skill level required, this section gives you a clear overview so you know exactly what to expect before download.
Template Features
Package Details
Software Compatibility
Skill Level Required
Intermediate
FAQs
Please read our FAQs page to find out more.
Are the templates fully customizable?
Yes, all our templates are fully customizable. You can adjust the layout, data, and design elements to fit your specific needs. Our templates are designed to be flexible, allowing you to easily tailor them to your preferences.
Can I order a product in any language?
Yes, we provide products in any language. Simply select the "Dashboard language change" Service and once your order is placed, you will receive it within 48 hours.
What happens if I choose the wrong monitor screen size for my dashboard?
If you choose the wrong screen size, the dashboard may not display correctly on your monitor. Elements could appear too large, too small, or misaligned, affecting the readability and usability of the dashboard. We recommend selecting the appropriate screen size to ensure optimal viewing and performance.
Do I need specific skills to use the advanced Excel dashboard templates?
Our advanced Excel dashboards are easy to use, the only thing you need to know is how to work with PivotTables. With basic knowledge of PivotTables, you'll be able to customize and fully utilize these templates effortlessly. "Please check the skill level required"
All dashboards are 100% editable Excel files. Learn how to use them through our video tutorials, included datasets, and lifetime access program.