✅ Instant Digital Delivery | 🔒 Secure Checkout | ⭐ Trusted by 1,000+ Professionals | 💬 24hr Support
Profits & Loss Dashboard with Creative Excel Slicer and Dynamic Chart
Pairs well with
Profit and Loss Statement Template – Excel Dynamic Chart Dashboard (Light Version)
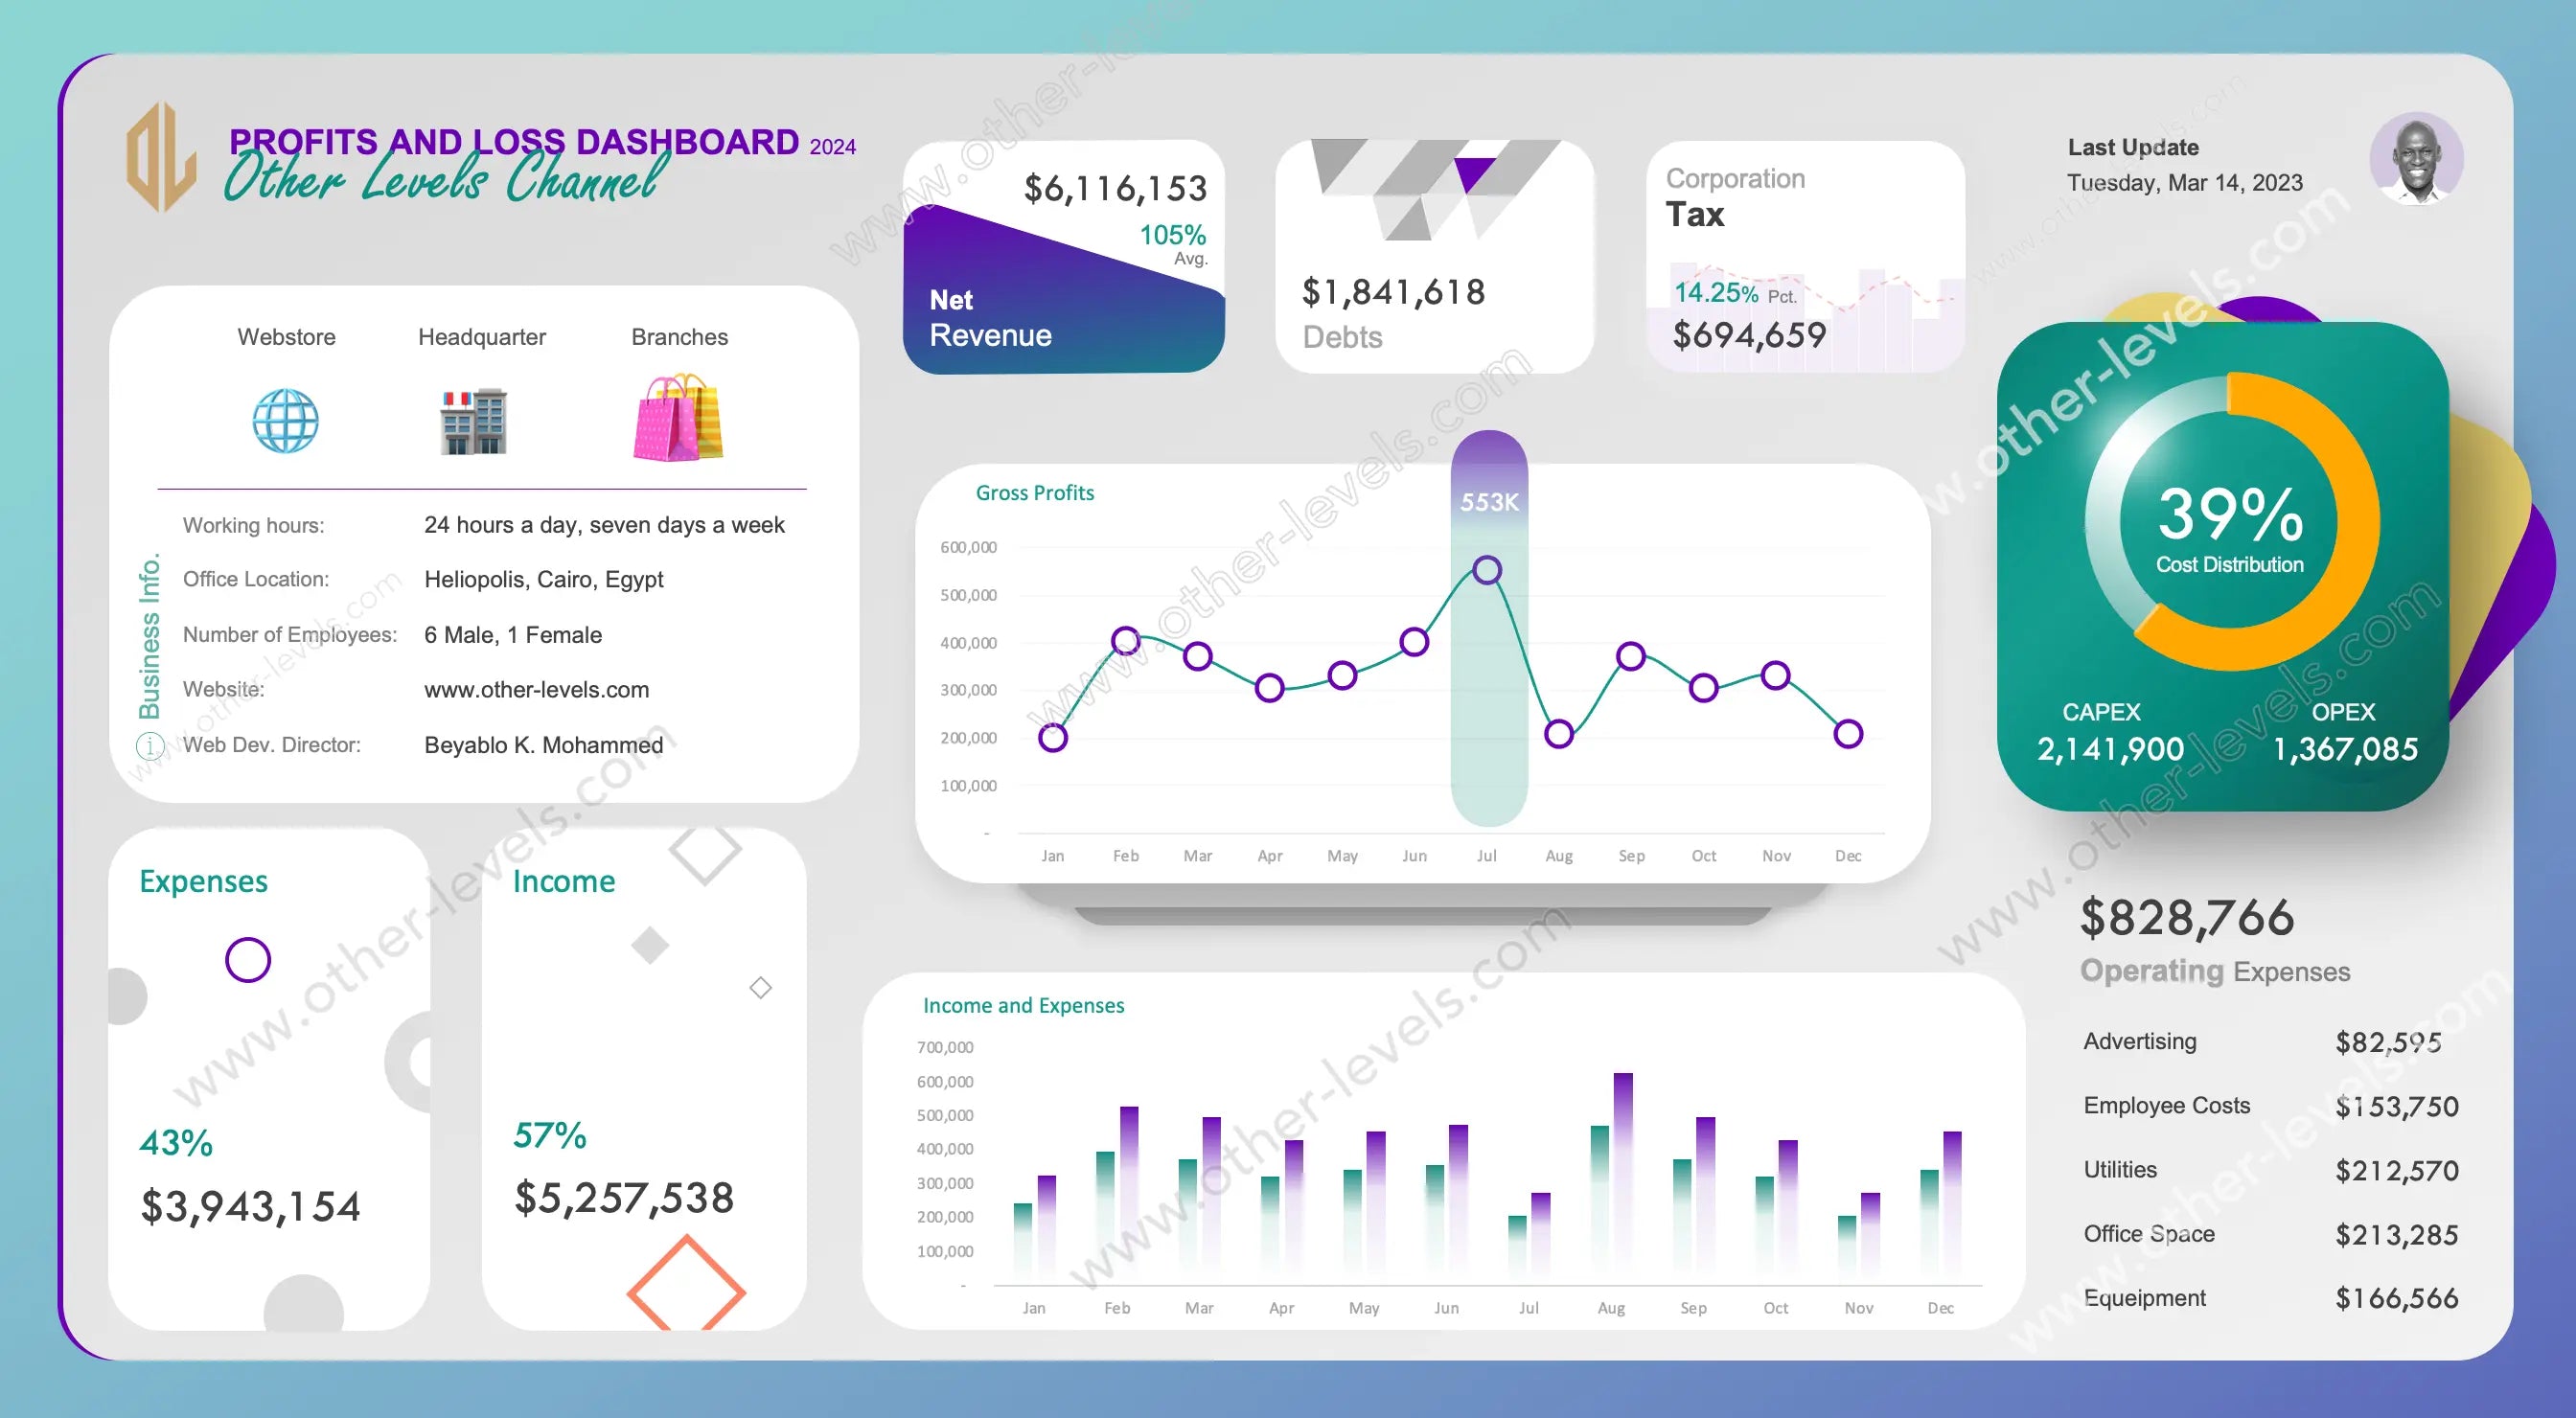
Bring clarity and precision to your financial reporting with this Excel Dashboard crafted in a clean, modern light mode design. The template helps you track income, expenses, profits, and cost allocations with interactive visuals that make data storytelling simple and professional. It’s ideal for business owners, accountants, and analysts who want insights presented with impact and simplicity.
Visual Financial Analysis Made Simple
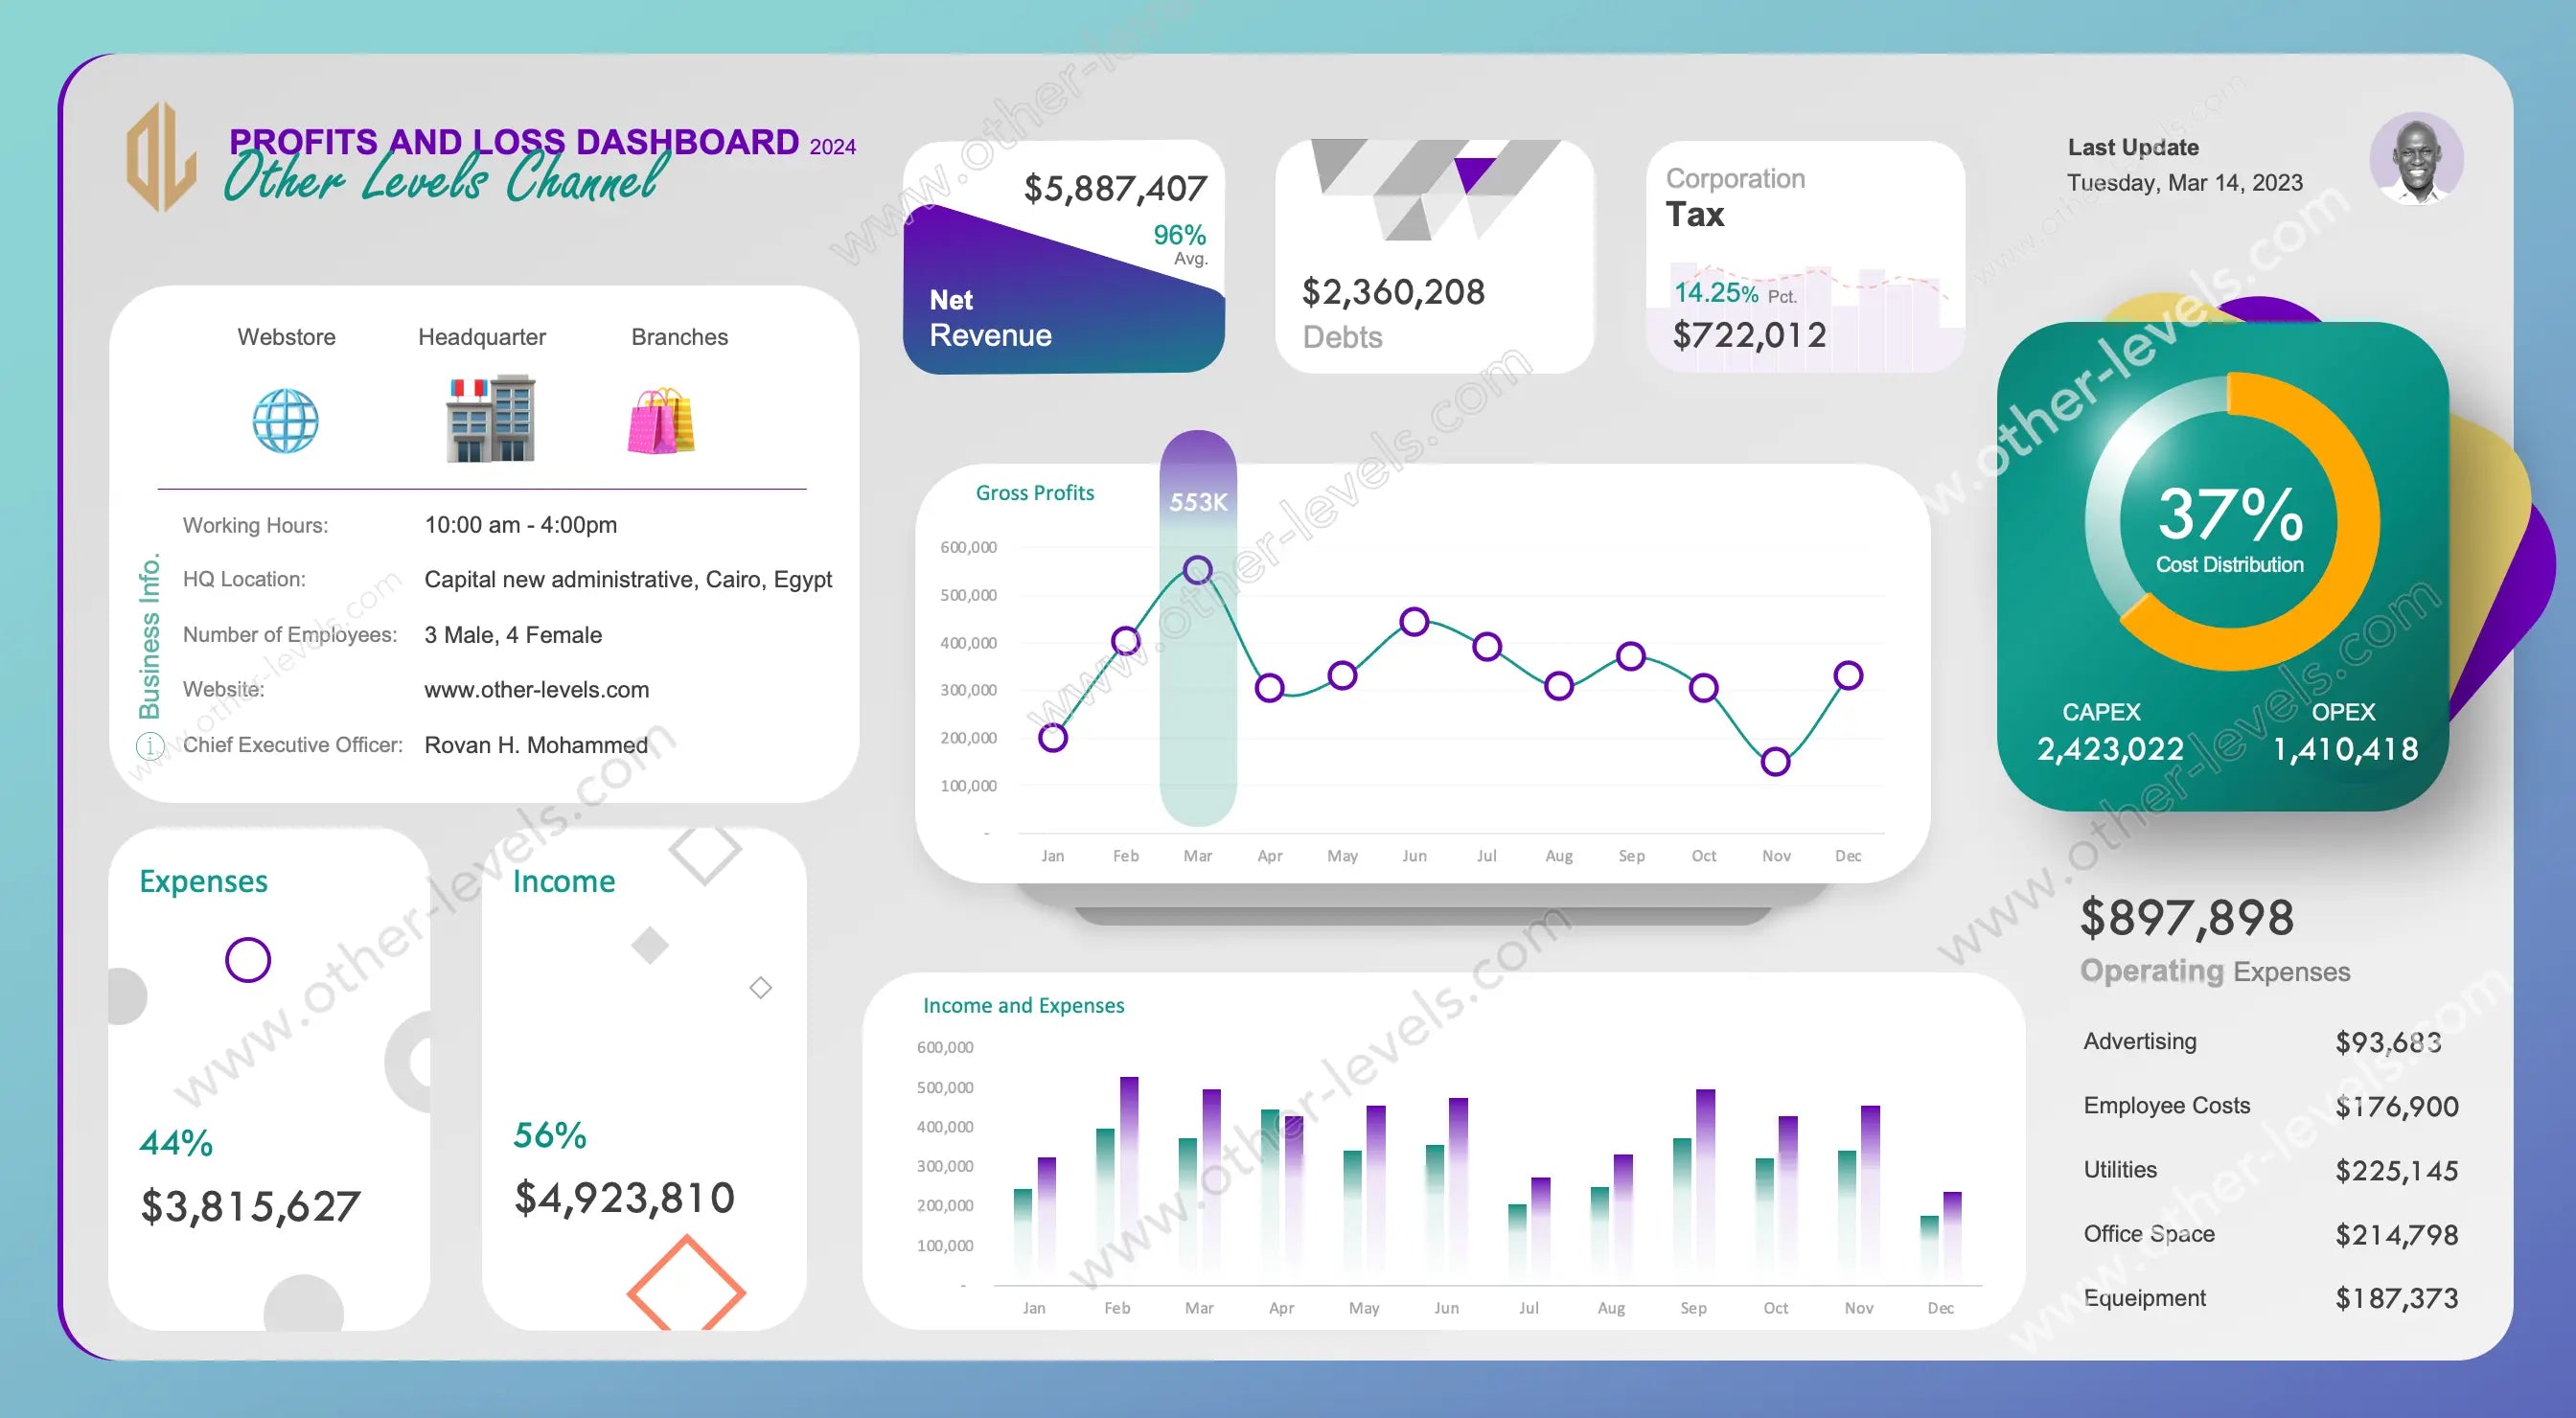
This financial dashboard excel template integrates income and expense data into dynamic visuals—making it easy to compare trends and evaluate profitability month by month. The light interface improves readability for print and presentation, while KPI cards emphasize net revenue, debts, taxes, and gross profit. Each chart refreshes automatically when your dataset updates.
Excel Dashboard Features
- Dynamic line and column charts for monthly profit and loss statement excel comparisons
- Editable donut chart for cost distribution dashboard insights (CAPEX vs OPEX)
- Smart KPI cards tracking income, expenses, and gross margin
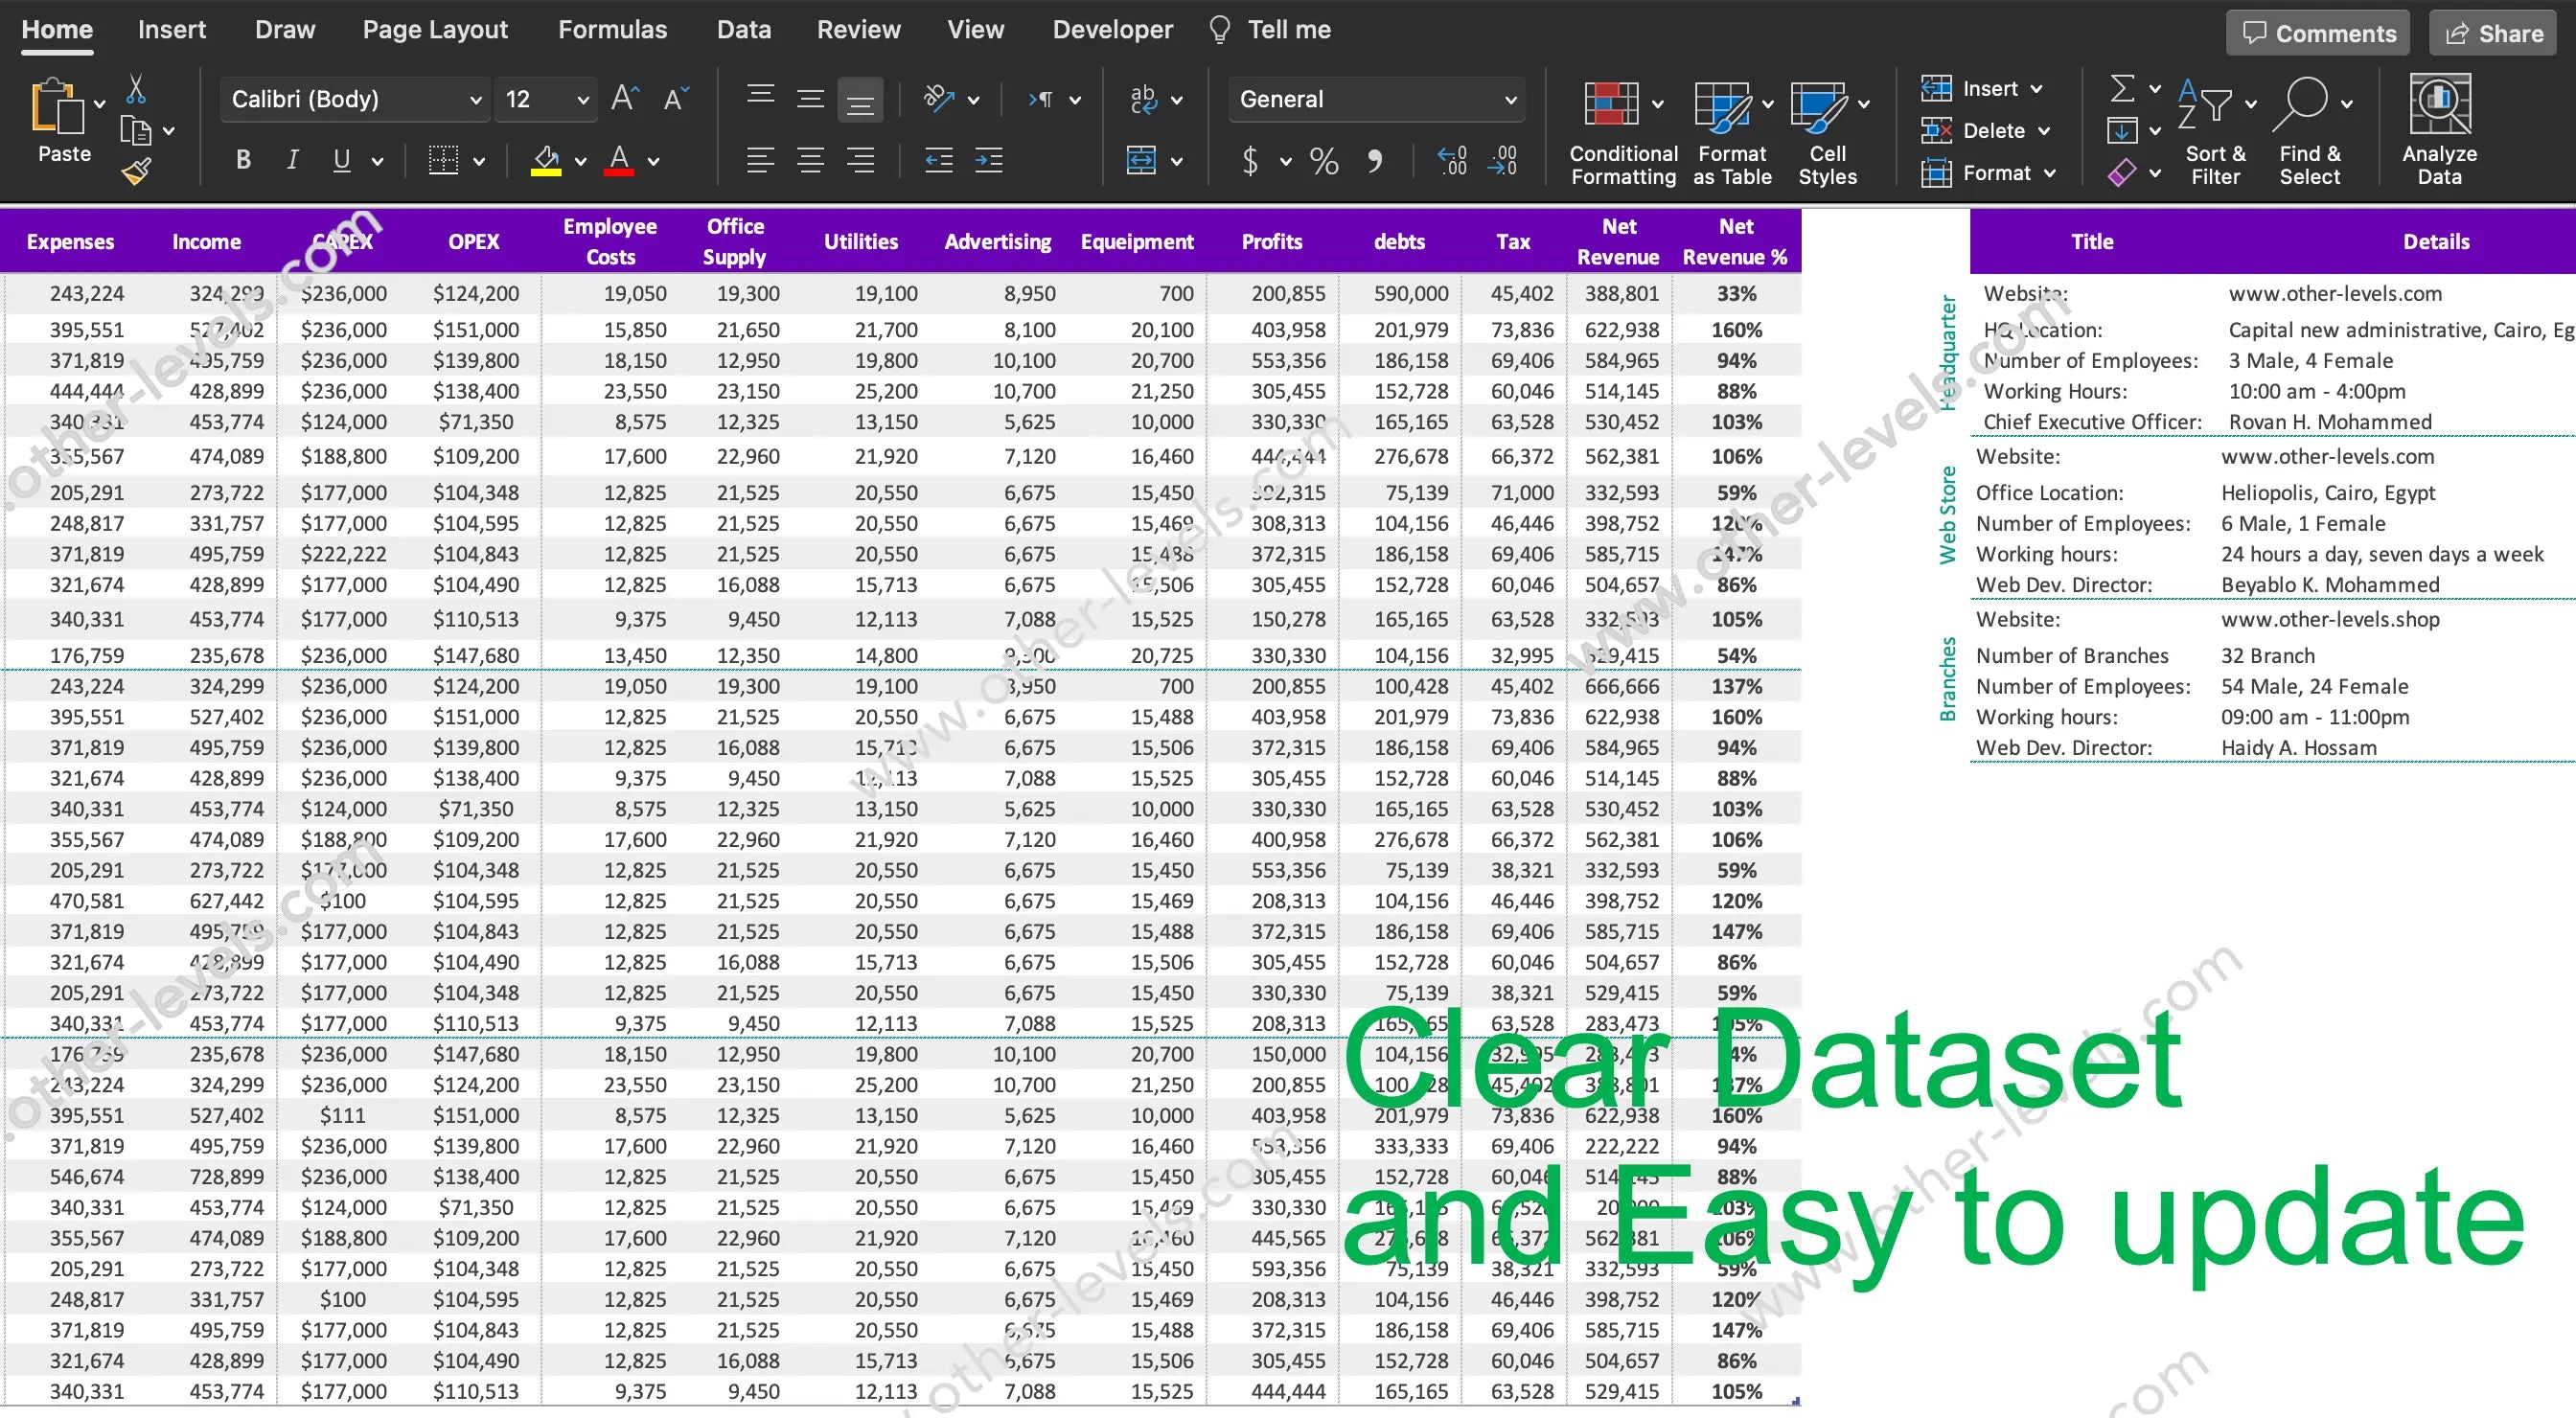
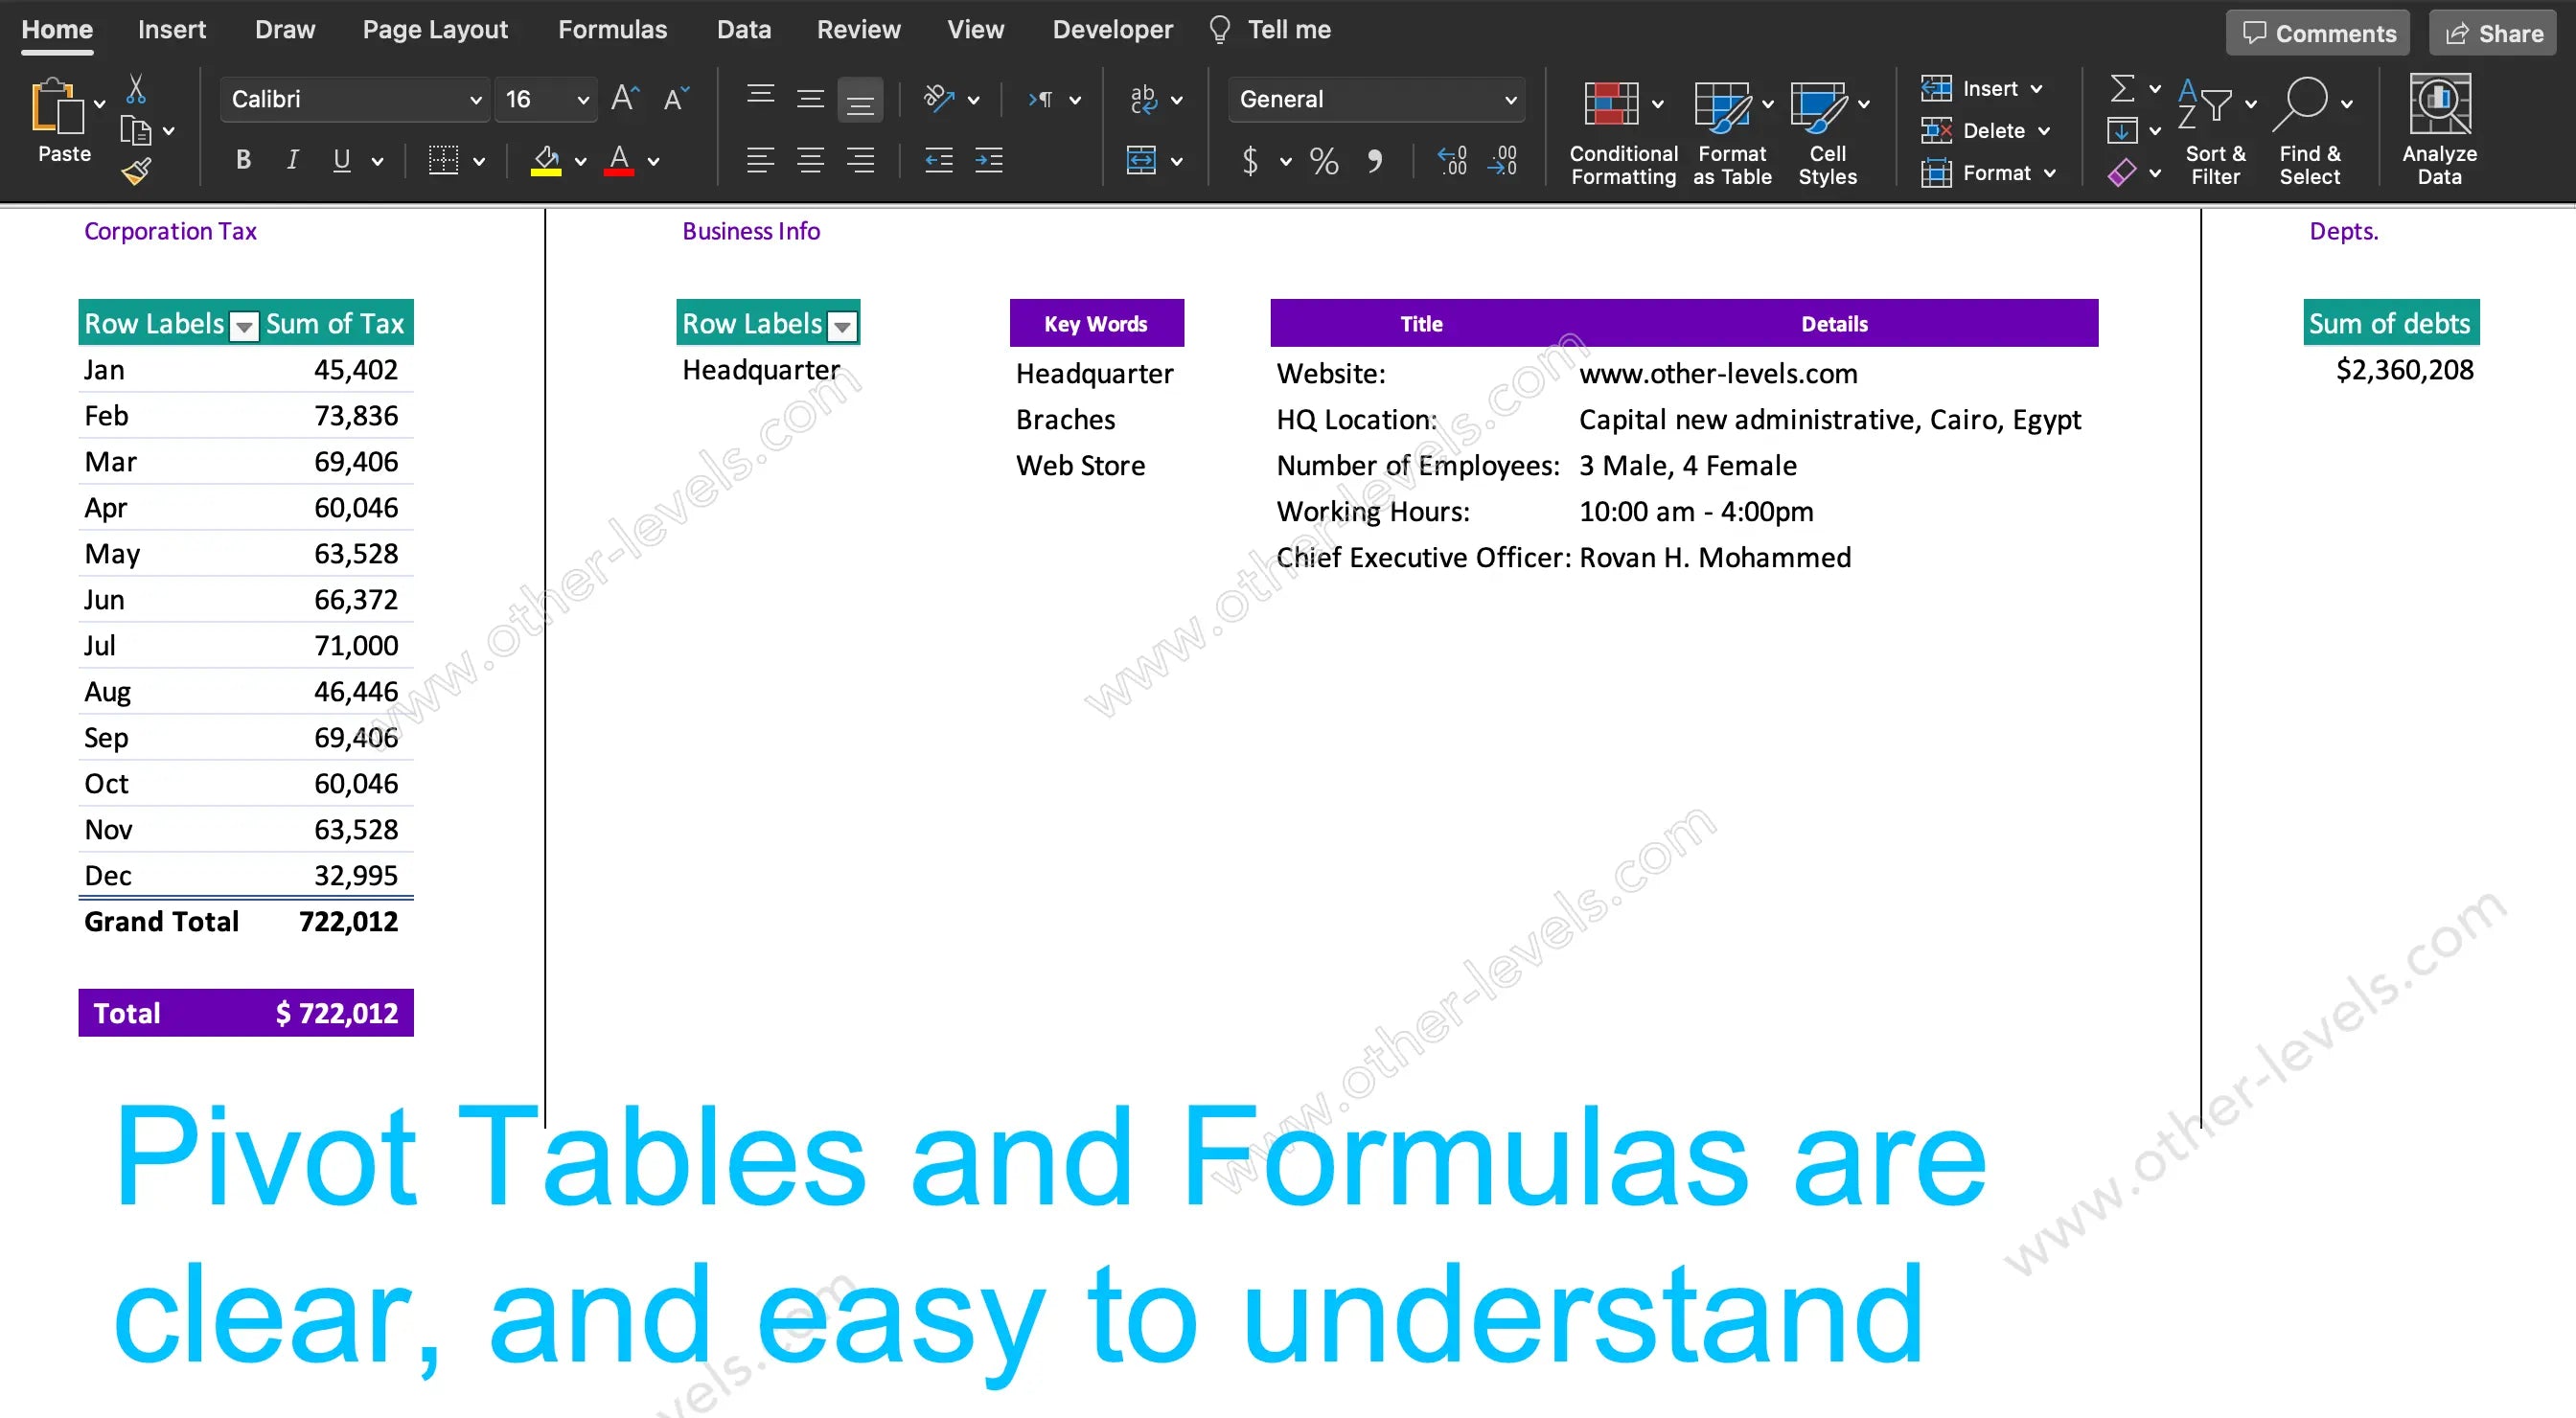
- Automated pivot-based calculations and refreshable data model
- Bright, clean layout optimized for white or presentation backgrounds
- Ideal for finance, startups, and accounting professionals
Why You’ll Love It
The dynamic chart excel template makes performance trends clear, while the kpi financial dashboard highlights what matters most for business growth. This version’s light color palette offers superior contrast in reports and printouts, keeping every metric easy to read and ready to share.
Use Cases
- Monthly financial statement reviews
- Corporate and team budget presentations
- Operational expense monitoring
- Branch or department profit tracking
Explore Related Excel Dashboards
Complete your financial toolkit with the Profits & Loss Dashboard with creative slicer and dynamic indicator, or explore data visualization ideas in the Restaurants Sales Analytics Excel Dashboard. Both pair perfectly with this Light Mode Profit and Loss Statement Template.
Video Tutorial
Watch the full tutorial on our Other Levels YouTube Channel
Specifications
Get all essential details in one place. From features and package contents to software compatibility and skill level required, this section gives you a clear overview so you know exactly what to expect before download.
Template Features
Package Details
Software Compatibility
Skill Level Required
Intermediate
FAQs
Please read our FAQs page to find out more.
Are the templates fully customizable?
Yes, all our templates are fully customizable. You can adjust the layout, data, and design elements to fit your specific needs. Our templates are designed to be flexible, allowing you to easily tailor them to your preferences.
Can I order a product in any language?
Yes, we provide products in any language. Simply select the "Dashboard language change" Service and once your order is placed, you will receive it within 48 hours.
What happens if I choose the wrong monitor screen size for my dashboard?
If you choose the wrong screen size, the dashboard may not display correctly on your monitor. Elements could appear too large, too small, or misaligned, affecting the readability and usability of the dashboard. We recommend selecting the appropriate screen size to ensure optimal viewing and performance.
Do I need specific skills to use the advanced Excel dashboard templates?
Our advanced Excel dashboards are easy to use, the only thing you need to know is how to work with PivotTables. With basic knowledge of PivotTables, you'll be able to customize and fully utilize these templates effortlessly. "Please check the skill level required"
All dashboards are 100% editable Excel files. Learn how to use them through our video tutorials, included datasets, and lifetime access program.