

Educational content only — not financial advice. Figures are as of late September 2026.
Amazon is one of the greatest stocks of all time. If you'd bought it in 1999 and held on, you'd be rich today. There's just one problem: between its 1999 high and late 2001, Amazon's stock fell more than 90% (CNBC). Would you have held on through that? Most people wouldn't — and that's the part of stock picking nobody puts in the success stories.
So: should you buy the whole market through the S&P 500, or pick individual stocks yourself? Here's the evidence, fairly, for both sides.
What the S&P 500 actually is
The S&P 500 tracks about 500 leading U.S. companies, covering roughly 80% of U.S. stock market value (S&P Dow Jones Indices). It isn't simply the 500 biggest companies. A committee selects members using rules — for example, a company must have positive earnings in its latest quarter and over the last four quarters combined, be very large, and have enough shares available to the public.
It's weighted by market value, so bigger companies count more. As of September 28, 2026, about 39% of the index sat in just 10 holdings, and NVIDIA (8.36%), Apple (7.46%) and Microsoft (5.71%) alone were over a fifth (State Street SPY holdings). An S&P 500 fund is diversified across ~500 companies, but more concentrated in a few giants than most people realize.
The index also cleans itself: shrinking or failing companies drop out and rising ones are added — about 20 additions a year on average from 2020 to 2024 (Nasdaq Dorsey Wright).
The 4% problem
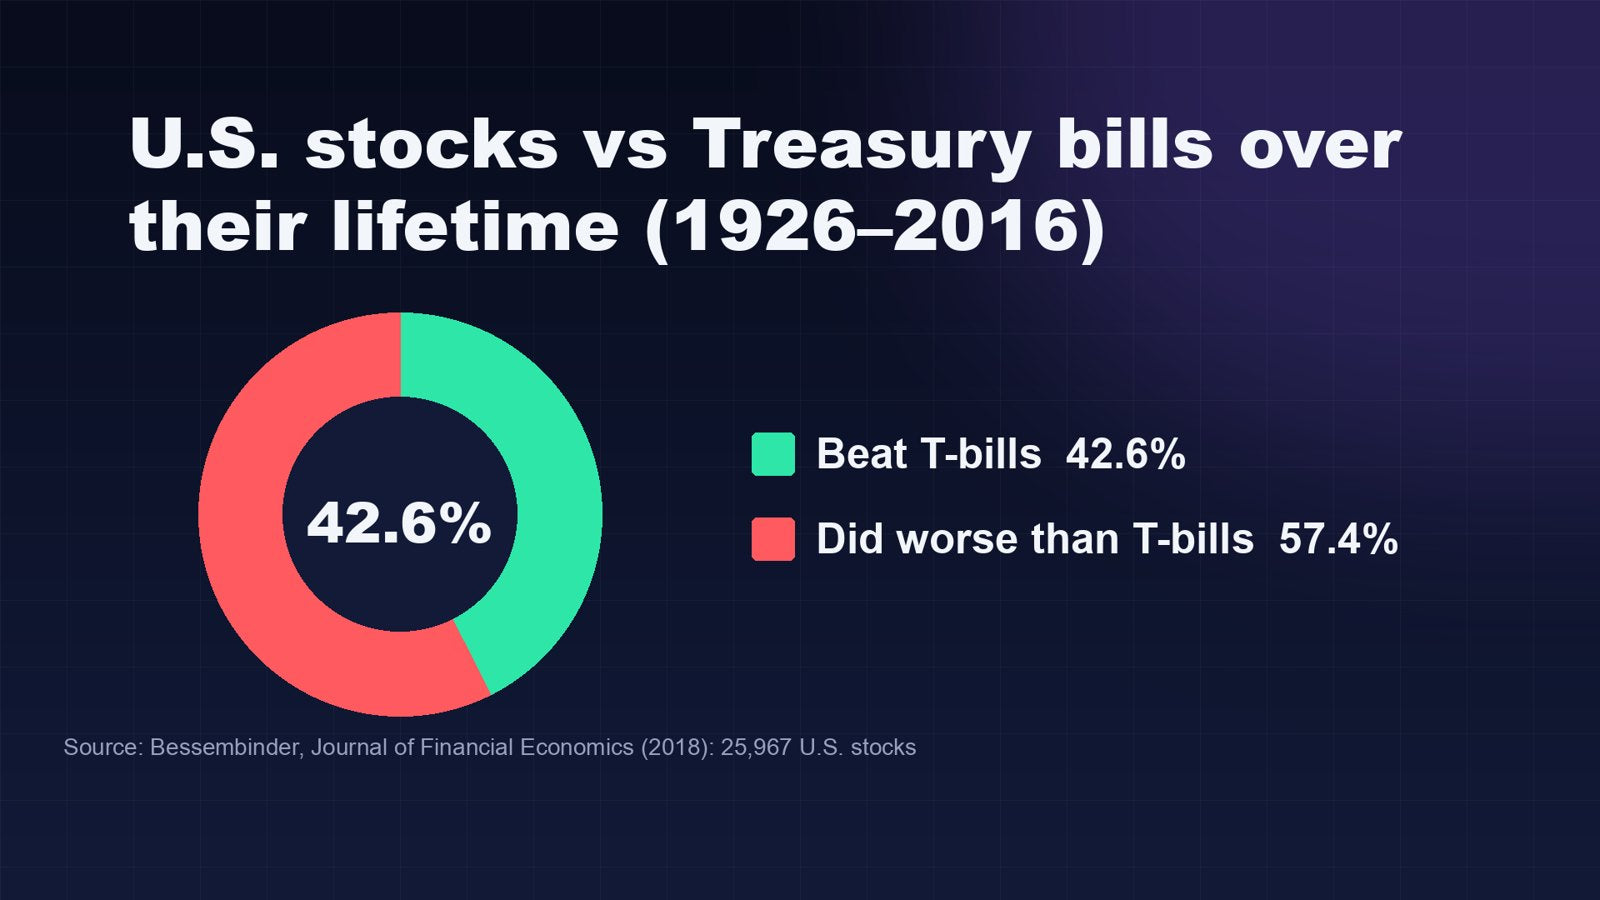
Professor Hendrik Bessembinder studied 25,967 U.S. stocks from 1926 to 2016. Only 42.6% beat one-month Treasury bills over their lifetime — most individual stocks did worse than cash. And the entire net gain of the U.S. market came from just 4% of companies (Journal of Financial Economics, 2018).
It's not just an American pattern. A follow-up study of 64,000+ global stocks (1990–2020) found that just 2.4% of companies created all of the $75.7 trillion in net wealth (Financial Analysts Journal, 2023).
If you own five or ten stocks, there's a real chance you miss the handful of superstars. An index fund can't miss them — it owns all of them (and the losers too).
Do the professionals beat the index?
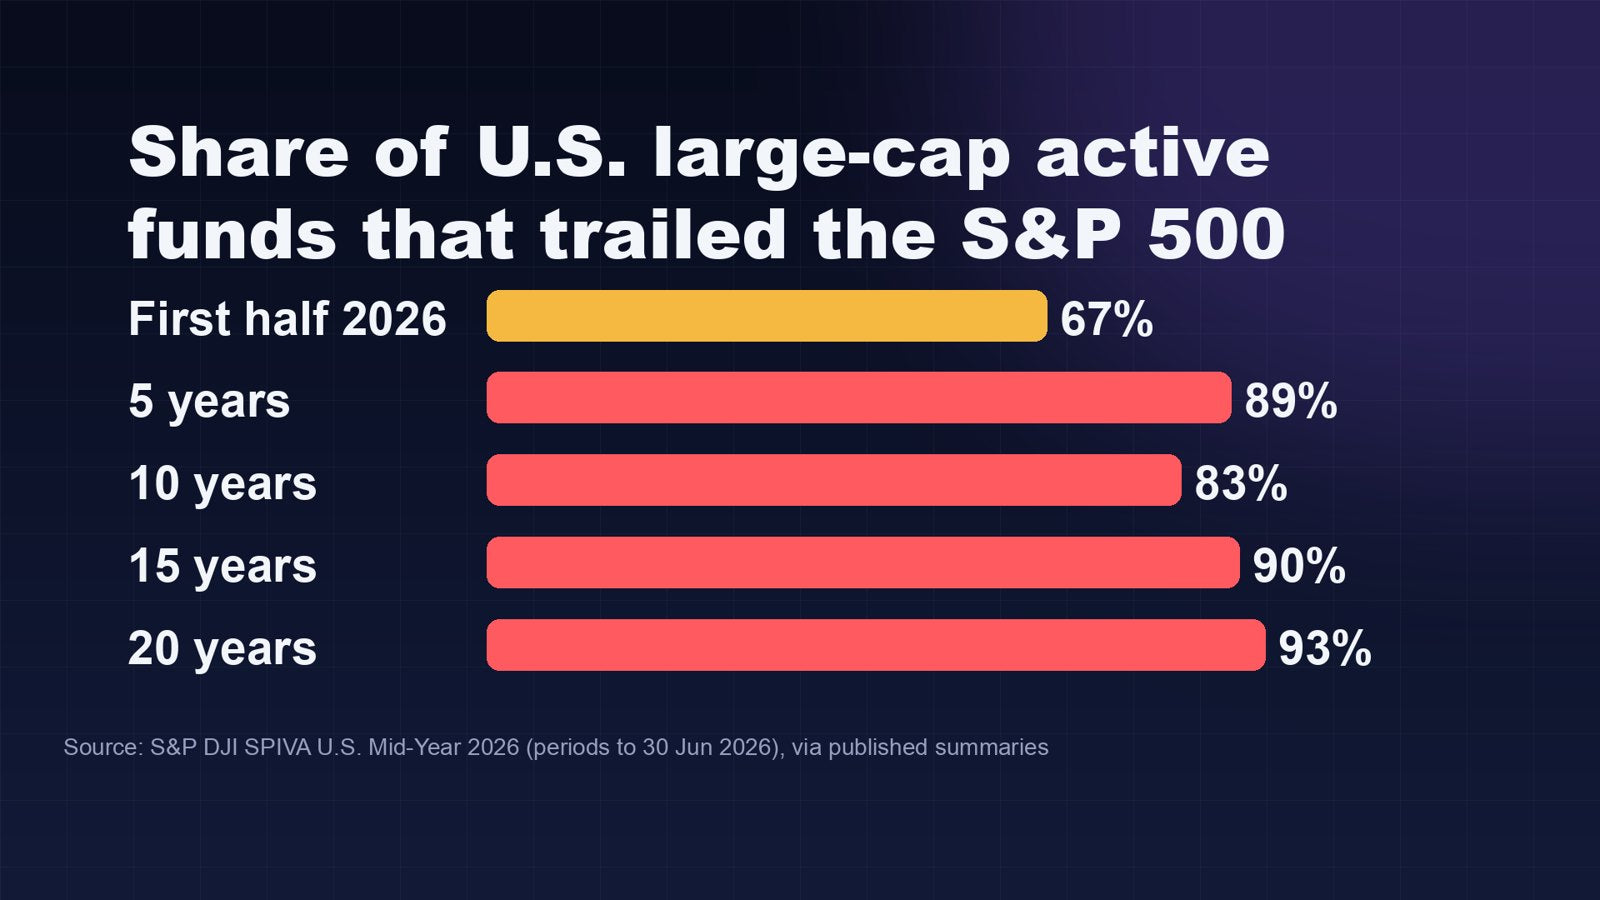
S&P Dow Jones Indices tracks this in its SPIVA reports. According to published summaries of the SPIVA U.S. Mid-Year 2026 report:
- 67% of large-cap U.S. active funds trailed the S&P 500 in the first half of 2026 — a period that was unusually favorable for stock pickers
- 89% over 5 years, 83% over 10 years, 90% over 15 years and 93% over 20 years
- Only about 37% of the funds that existed 20 years ago still exist — survivorship bias in action
It's global: in 2025, 88% of broad U.K. equity funds trailed their benchmark, and in Australia 87% trailed over 15 years (SPIVA Europe & Australia Year-End 2025).
Part of the reason is fees. The average dollar in active U.S. equity funds paid about 0.58% a year in 2025 (Morningstar 2026 U.S. Fund Fee Study), while S&P 500 ETFs like VOO and IVV cost 0.03%. Fees are one of the few things in investing you control.
Why winning stocks look easy — afterwards
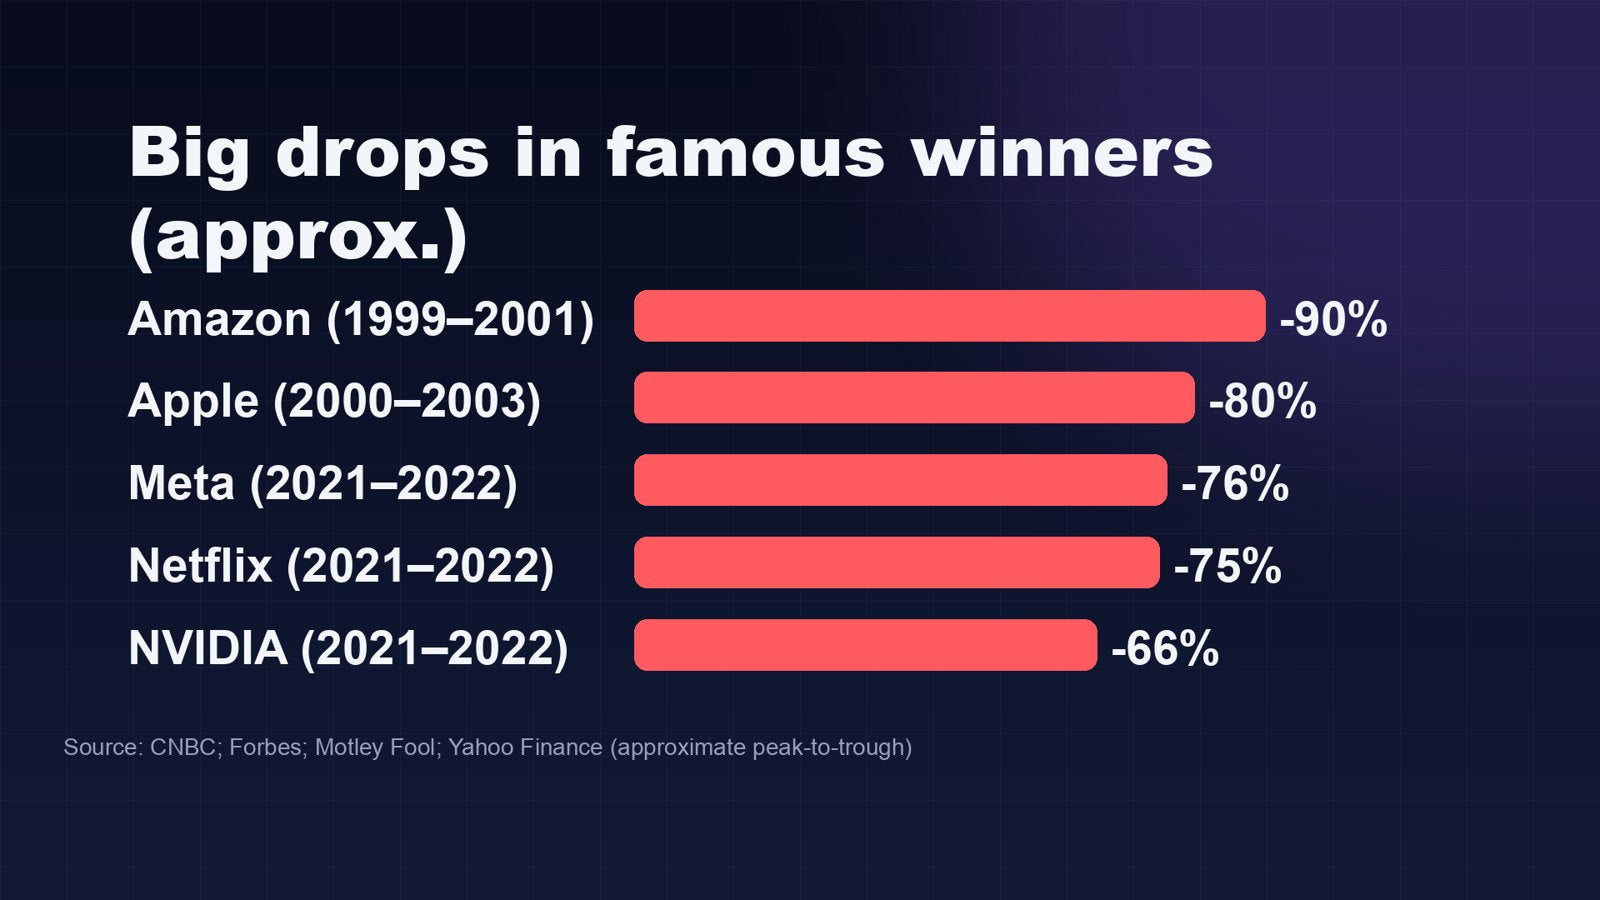
We only remember how famous winners ended. Amazon fell more than 90% after the dot-com bubble; Apple roughly 80% between 2000 and 2003; Meta about 76% and Netflix about 75% in 2021–2022; and NVIDIA fell 66% between late 2021 and October 2022. To earn the famous returns, you had to hold through those drops — often while headlines said the company was finished.
And some giants never came back: Enron went from about $90 to $0.26 before its 2001 bankruptcy; Lehman Brothers filed in 2008 with $639 billion in assets, the largest bankruptcy filing in U.S. history; General Electric was the world's most valuable company in 2000 and was removed from the Dow in 2018. That's survivorship bias: we study the survivors and forget the graveyard.
The behavior gap
Barber and Odean's classic study of 66,465 households (1991–1996) found the market returned about 17.9% a year, the average household 16.4% — and the most active traders just 11.4%. More recently, Morningstar's "Mind the Gap" 2026 estimated that fund investors earned about 1.2 percentage points a year less than their funds over the ten years to 2025, although other researchers argue the true timing cost is smaller. Notably, for broad large-blend funds — where S&P 500 index funds sit — the gap was about zero.
So who should do what?
Be fair to both sides. The index has weaknesses: it's concentrated in a few tech giants, it's U.S. large companies only, and its last ten years (about 15.4% a year to Aug 31, 2026) were well above its longer-run pace of about 11% a year since 1993 (State Street). Those strong years may not repeat.
- An index approach tends to suit people who want low cost, little time spent, broad diversification, and are happy with the market's return.
- Stock picking can suit people who genuinely enjoy research, can stomach 50%+ drops, accept they may underperform, and keep it to money they can afford to get wrong.
Many people combine the two: a diversified index core for the money that really matters, and a small slice for individual ideas. That's an illustration of a common structure, not a recommendation.
📊 Track your portfolio with our Excel dashboard templates.
▶️ Watch the full video on our YouTube channel. Previous: If I Had $10,000 to Invest in 2026 · Next: Who Actually Makes the Money From AI?
Sources
- S&P Dow Jones Indices — S&P 500 index page and methodology; press release Jun 4, 2026; SPIVA U.S. Mid-Year 2026 and Year-End 2025; SPIVA Europe and Australia Year-End 2025 (some figures via published summaries)
- State Street — SPY holdings (Sep 28, 2026) and index returns (Aug 31, 2026); iShares IVV; Vanguard VOO
- Morningstar — 2026 U.S. Fund Fee Study; "Mind the Gap" 2026; Fulkerson et al., Financial Analysts Journal 82(3), May 2026
- Bessembinder (2018), Journal of Financial Economics; Bessembinder, Chen, Choi & Wei (2023), Financial Analysts Journal
- Barber & Odean (2000), "Trading Is Hazardous to Your Wealth", Journal of Finance 55(2)
- CNBC (Dec 18, 2018); Forbes (Jan 19, 2024); Motley Fool (Jun 30, 2024); History.com; Britannica; Nasdaq; Nasdaq Dorsey Wright (Aug 27, 2025)
Disclaimer: Educational content only — not financial or investment advice. Past performance does not guarantee future results. Some figures come from published summaries of the original reports; check the latest versions.

Share:
If I Had $10,000 to Invest in 2026, This Is What I'd Do
AI Companies Are Spending $700 Billion. Who Actually Makes the Money?