


Free Excel Dashboard Maker
Turn any Excel or CSV file into an instant dashboard with KPIs, charts and insights. Free online dashboard creator, no sign-up, and your data never leaves your browser.
My Dashboard
Made free with other-levels.comTrend
Top 10
Breakdown
Quick insights
What would you like to do next?
Pick the option that fits you best.
Try another file
Upload a different Excel or CSV file and build a new dashboard in seconds.
Get this dashboard in Excel
The same KPIs, charts, colors and insights as an editable Excel file. Your download link arrives right after payment.
Only the totals shown above are sent to build your file, never your raw data.Let our team build it
A fully interactive Excel, Google Sheets or Power BI dashboard on your live data that updates by itself.
See custom dashboards →Want this as a real Excel or Power BI dashboard?
This free tool gives you a quick picture. We build fully interactive dashboards that update when your data changes, with slicers, drill-downs and your branding.
Upload your file
Excel (.xlsx, .xls) or CSV. Your data is read inside your browser and is never sent to our servers.
We detect your columns
Dates, numbers and categories are found automatically. Change any of them from the menus.
Get your dashboard
KPIs, trend, top 10, share and insights in seconds. Get it as an editable Excel file, or let our team build it on your live data.
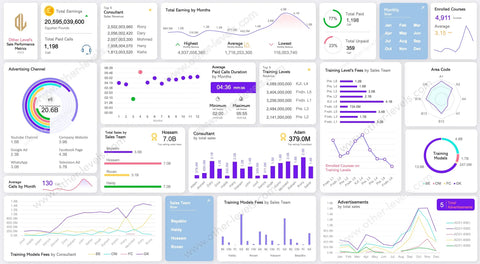
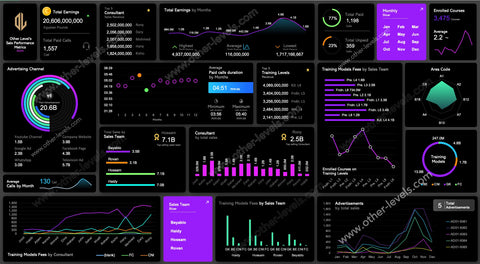
A free online dashboard creator for every team
Use the Excel dashboard generator with any table. Here are the most popular dashboards people make:
Sales dashboard
Revenue by month, top products, regions and sales reps from your sales export.
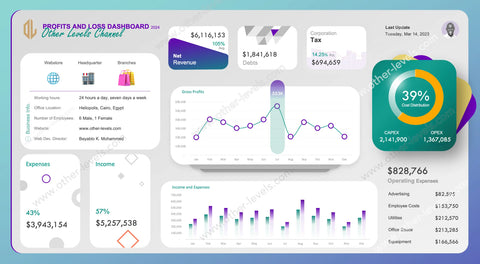
Finance & expense dashboard
Income, expenses and profit by category or cost center, from your accounting export.
HR dashboard
Headcount, salaries, hires and turnover by department from your employee list.
Project dashboard
Tasks, budget and progress by project, owner or status from your tracker.
Inventory dashboard
Stock value, units and movement by product, warehouse or supplier.
KPI dashboard
Any KPI over time, ranked by team, branch or channel in one clear view.
Want a ready-made, fully editable file instead? Browse 100+ Excel dashboard templates or get unlimited access to all of them.
Frequently asked questions
Is the dashboard maker really free?
Yes. Using the dashboard maker is free and you can create as many dashboards as you want. If you want an editable Excel, Google Sheets or Power BI version built on your data, you can order it as a custom dashboard.
Is my data safe?
Your file is processed entirely in your browser. It is not uploaded, stored or seen by anyone, including us.
What should my file look like?
A simple table: one row of column headers at the top (for example Date, Region, Product, Sales) and one record per row below it.
How do I turn an Excel sheet into a dashboard?
Upload the file above. The tool finds your date, number and category columns, then builds KPI cards, a trend chart, a top 10 ranking, a share chart and written insights. You can change any column from the menus.
Can I convert a CSV file into charts?
Yes. CSV files work the same way as Excel files, including exports from Shopify, QuickBooks, Google Sheets, HR systems and CRMs.
Can I get an editable Excel or Power BI version?
Yes. Browse our ready-made Excel dashboard templates, or order a custom dashboard in Excel, Google Sheets or Power BI, built on your own data.