

Educational content only — not financial advice. Figures are as of late September 2026 and will change.
Imagine someone hands you $10,000 today, and you won't need it for at least five years. Most people jump straight to the exciting question: which stock, which coin, what's about to take off? That's the wrong first question. Here's the order I would actually think about it in, step by step, using real data. The same framework works for $1,000 or $100,000.
Step 1: Before investing, kill expensive debt
According to the Federal Reserve, the average U.S. credit card rate was 22.15% on accounts that were charged interest in Q2 2026 (20.94% across all accounts). Paying off a card that charges 22% is like earning a guaranteed 22% return, with zero market risk. No stock market reliably gives you that.
FINRA, the U.S. brokerage regulator, calls paying down high-interest debt "one of the best ways to improve your financial foundation." If you carry expensive debt, that's where the first dollars go.
Step 2: Build the safety net (and make it earn something)
A common rule of thumb is an emergency fund of three to six months of living expenses (FINRA). The CFPB makes a fair point: the right amount depends on your situation. A freelancer may want more; someone with a very stable job may need less.
Why does this matter for investing? Because the worst time to sell your investments is in the middle of a crash, just because your car broke down. The emergency fund protects your investments from your life.
The good news in 2026: cash pays something again. The Fed raised its target range to 3.75–4.00% on September 16, 2026.
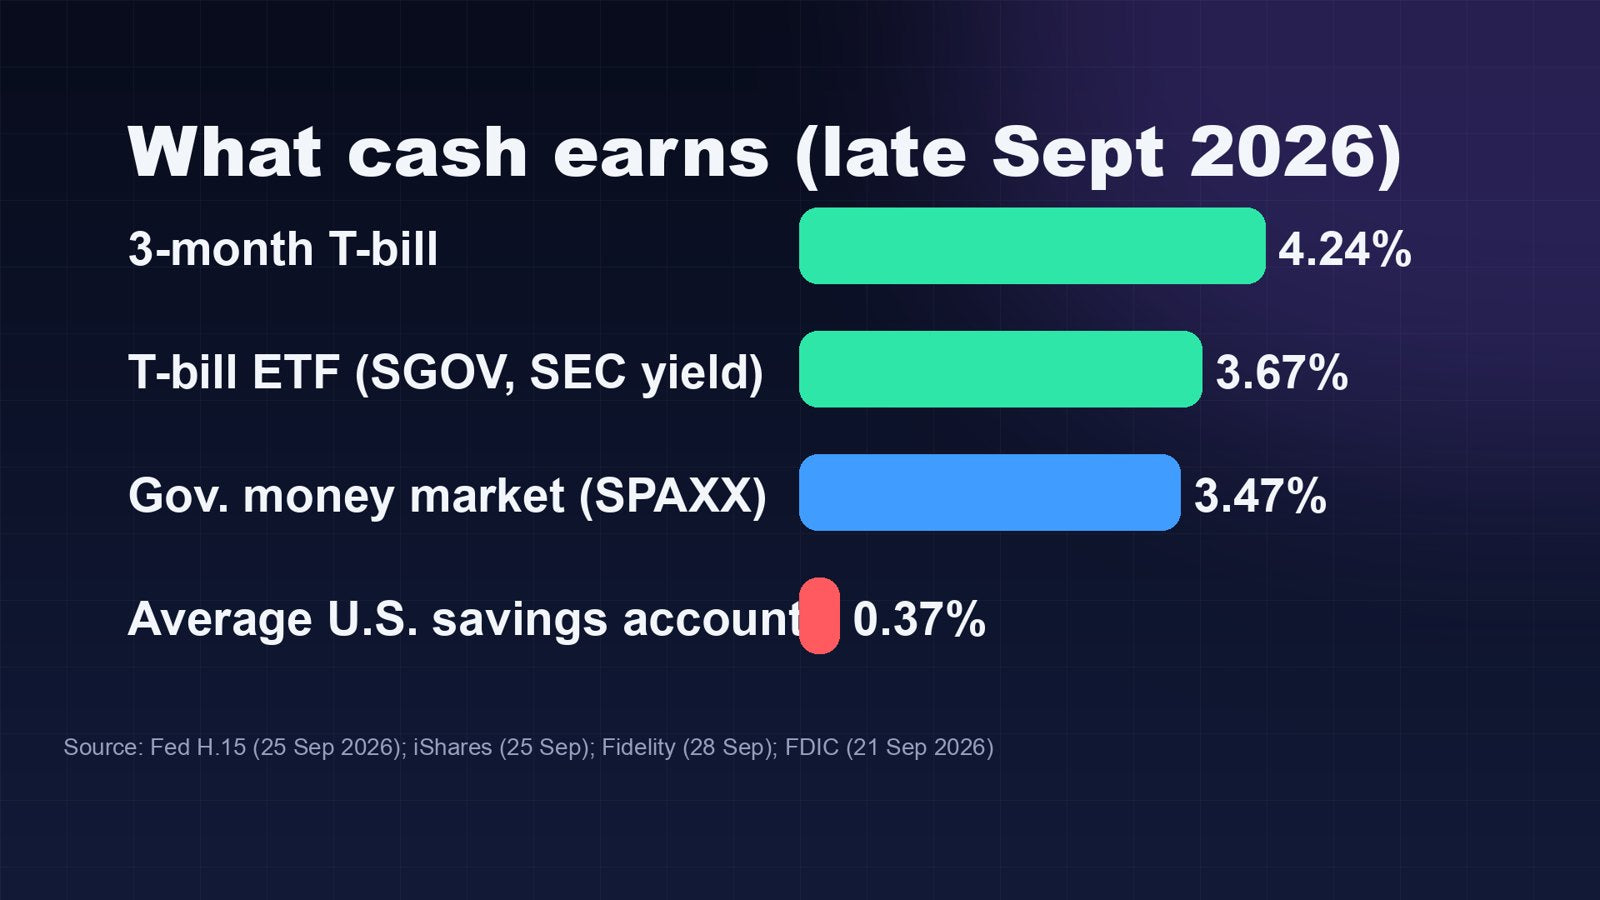
- 3-month Treasury bill: 4.24% (Fed H.15, Sep 25, 2026)
- T-bill ETF (SGOV, 30-day SEC yield): 3.67%
- Government money market fund (Fidelity SPAXX, 7-day yield): 3.47%
- Average U.S. savings account: just 0.37% (FDIC, Sep 21, 2026)
If your emergency fund sits in a basic big-bank savings account, it's probably earning far less than it could.
Step 3: Be honest about time and risk
Two questions: When will you need this money? And how big a drop could you live through without panicking?
Since 1928, the S&P 500 (with dividends) had a negative calendar year 26 times in 98 years — about one year in four. Some were brutal: roughly −37% in 2008 and −18% in 2022. From the October 2007 peak to the March 2009 bottom, the index fell about 57%.
If your $10,000 became $5,000 for a while, would you hold on? If not, you need less in stocks and more in steady assets. There's no shame in that. The best plan is the one you can actually stick with.
But look at the long run:
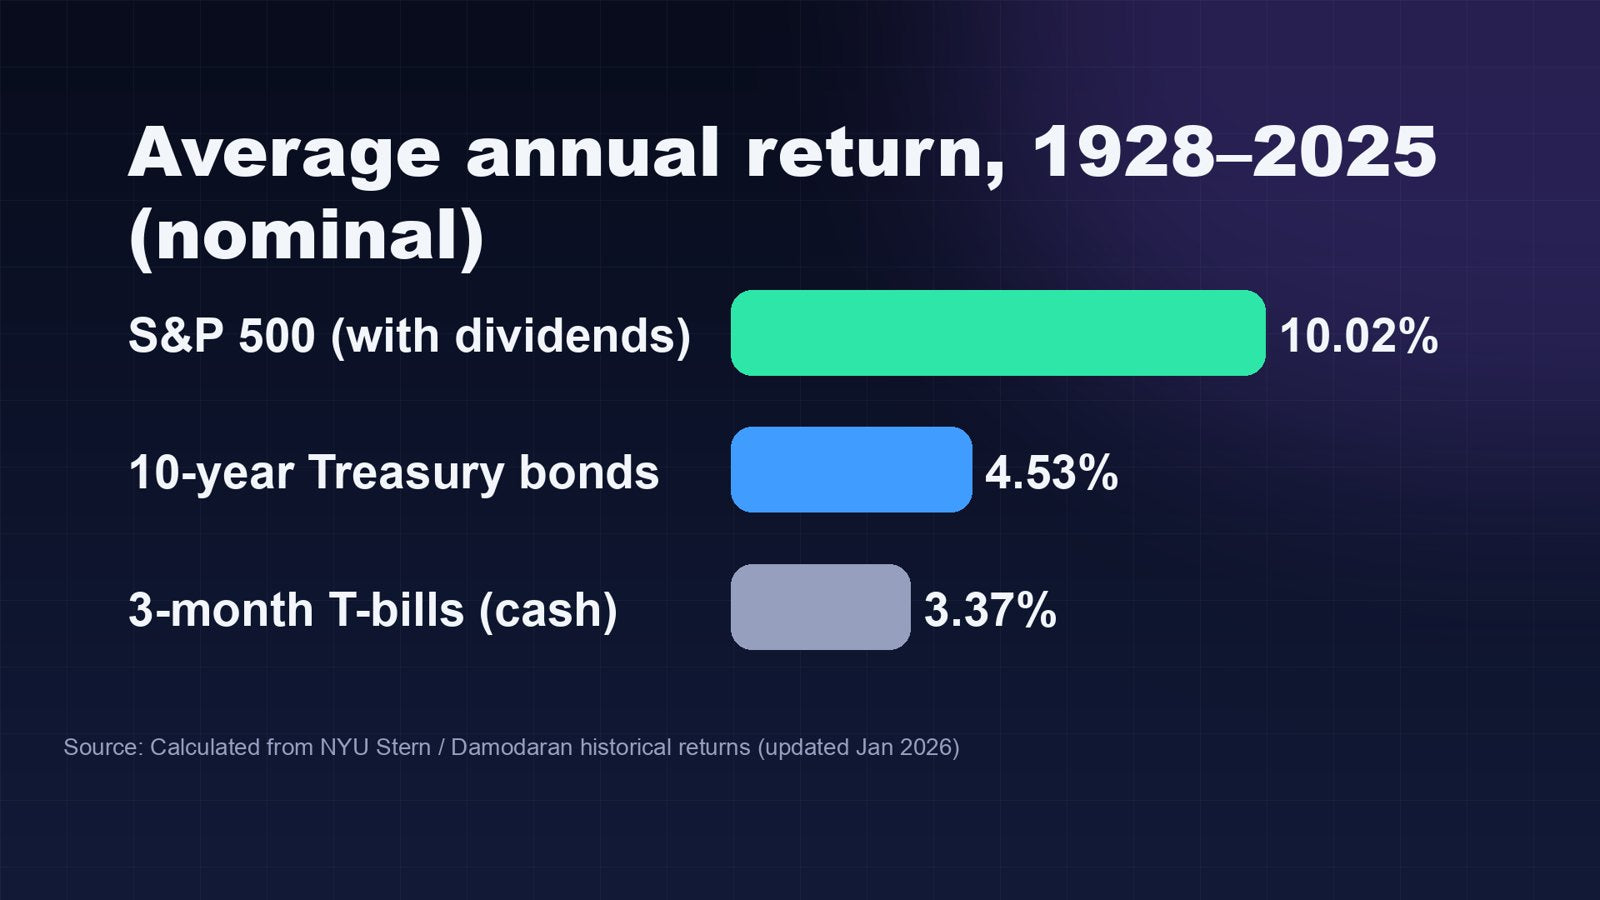
From 1928 to 2025, the S&P 500 compounded at about 10% a year before inflation, versus about 4.5% for 10-year Treasuries and 3.4% for T-bills (calculated from NYU Stern / Damodaran data). $100 invested in 1928 grew to more than $1.1 million in stocks by the end of 2025, versus about $2,578 in T-bills (nominal). Higher long-run returns are the reward for surviving short-run pain.
Step 4: Don't hunt for "the next big stock"
Professor Hendrik Bessembinder studied every U.S. stock since 1926 (Journal of Financial Economics, 2018). The majority of stocks had lifetime returns below one-month Treasury bills, and the best-performing 4% of companies explained the entire net gain of the U.S. stock market.
If you own a handful of stocks, there's a real chance you miss the few superstars that do the heavy lifting. If you own the whole market, you own them by design. And it has never been cheaper:
- VOO / IVV (S&P 500), VTI / ITOT (total U.S.), BND / AGG (U.S. bonds): 0.03% a year — about $3 a year on $10,000
- VXUS (international): 0.05%; SPY: 0.0945%
- U.K./Europe: Vanguard FTSE All-World UCITS: 0.14%; iShares Core S&P 500 UCITS (CSPX): 0.07%
One total-market fund like VTI holds about 3,500 U.S. companies; VXUS holds nearly 8,800 outside the U.S. (Vanguard, Aug 31, 2026). These are examples, not recommendations.
An educational example: how I might split $10,000
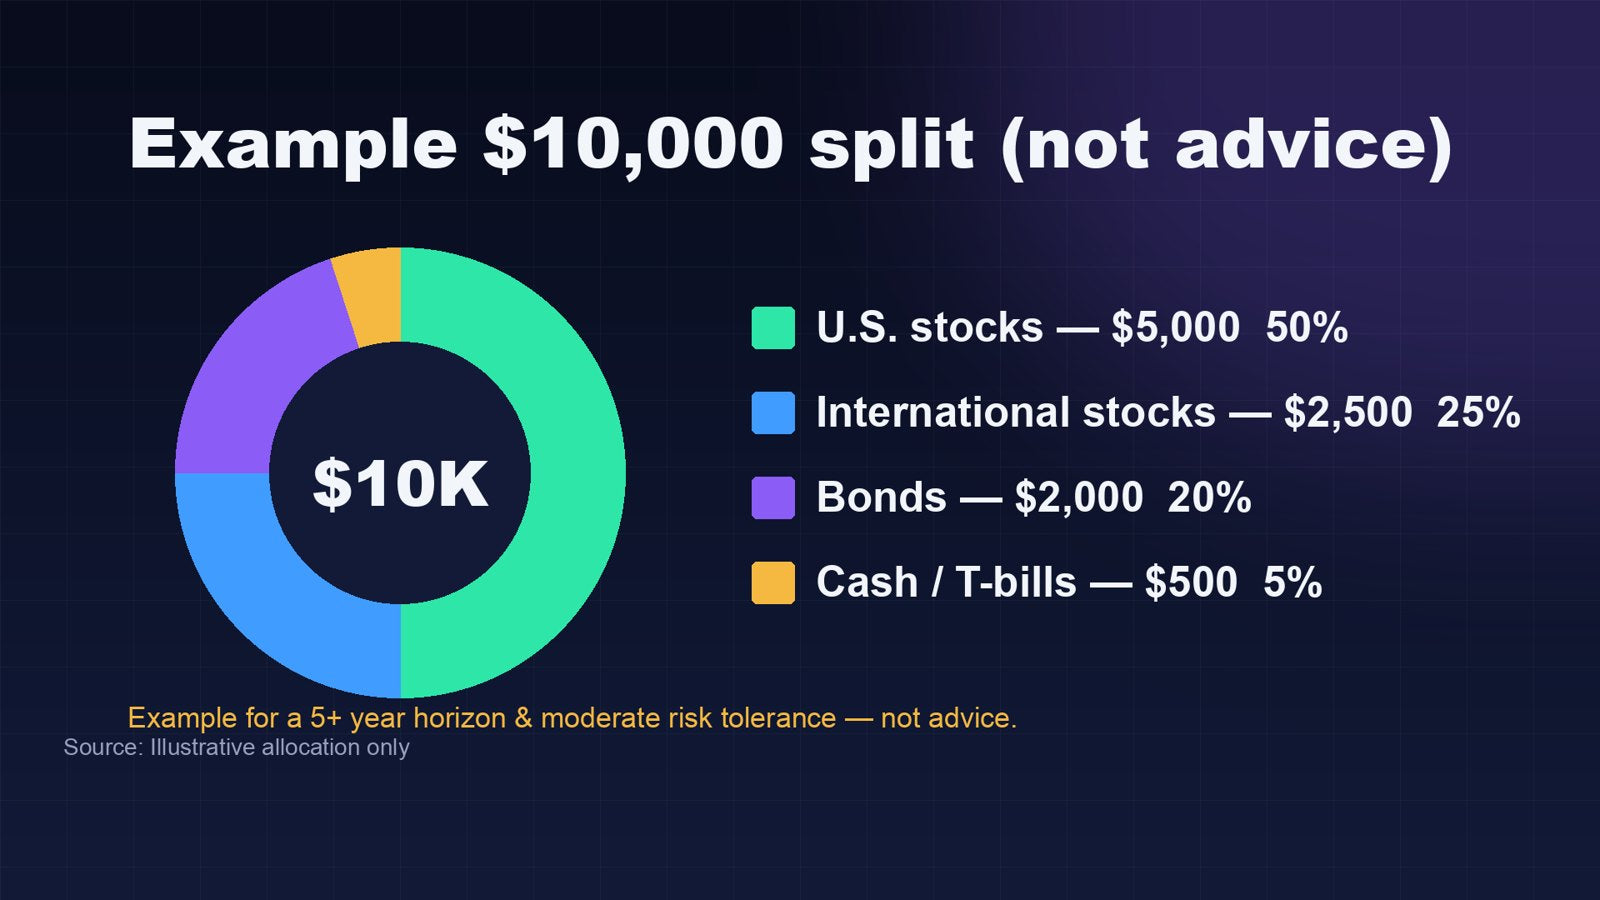
For someone with a five-year-plus horizon and moderate risk tolerance, an example split might be:
- 50% ($5,000) — broad U.S. stock index
- 25% ($2,500) — international stocks
- 20% ($2,000) — bonds (total bond market or Treasuries)
- 5% ($500) — cash / T-bills, on top of the emergency fund
Why international? The U.S. is about 63.6% of global stock market value (MSCI ACWI, Aug 31, 2026) — over a third of the world's big companies are elsewhere, and nobody knows which country will lead the next decade.
Why bonds? They usually hold up better when stocks fall, which makes a portfolio easier to live with. Not always: in 2022, stocks and bonds fell together. Diversification reduces risk; it doesn't remove it.
More nervous, or need the money sooner? Turn the dial toward bonds and cash. Longer horizon and calmer nerves? Toward stocks. The structure stays the same; only the dial changes.
Step 5: The part that decides everything — behavior
At the end of September 2026 the S&P 500 closed at 7,683.69 (Sep 28), about 1.5% below its August 13 record. Many people ask whether it's a bad time to start. Nobody can reliably time the market. If investing everything at once feels hard, dollar-cost averaging — investing in equal chunks over several months — won't guarantee a better result, but it can make the start easier emotionally.
Then do the boring things that work: automate a monthly contribution, rebalance once or twice a year, ignore daily headlines, and never invest money you'll need soon.
Investing vs speculating: investing is owning productive businesses for years. Speculating is betting on what a price will do next week. Both exist — just don't confuse one for the other.
The $10,000 framework, in one list
- Pay off expensive debt
- Build an emergency fund (3–6 months) that earns something
- Know your time horizon and risk tolerance
- Own low-cost, diversified index funds instead of hunting for one winner
- Automate and stay the course
📊 Want to track it? Browse our Excel dashboard templates — including personal finance and budget trackers.
▶️ Watch the full video on our YouTube channel: Other Level's. Next in the series: S&P 500 vs Picking Individual Stocks.
Sources
- Federal Reserve — FOMC statement, Sep 16, 2026; H.15 Selected Interest Rates (Sep 25, 2026); G.19 Consumer Credit (released Sep 8, 2026)
- FDIC — National Rates and Rate Caps (Sep 21, 2026)
- FINRA — Financial Foundations; CFPB — An essential guide to building an emergency fund
- Fidelity (SPAXX), iShares (SGOV, IVV, ITOT, IXUS, AGG), Vanguard (VOO, VTI, VXUS, BND, FTSE All-World UCITS), State Street (SPY, BIL) product pages, Apr–Sep 2026
- NYU Stern, A. Damodaran — Historical Returns on Stocks, Bonds and Bills (updated Jan 2026)
- Bessembinder, H. (2018). "Do Stocks Outperform Treasury Bills?" Journal of Financial Economics 129(3)
- MSCI ACWI Index factsheet (Aug 31, 2026); S&P 500 levels via FRED (SP500)
Disclaimer: This article is for educational purposes only and is not financial, investment, tax or legal advice. The allocation shown is an illustrative example, not a recommendation. Past performance does not guarantee future results. Investing involves risk, including loss of principal. Consider speaking with a licensed financial professional about your situation.

Share:
S&P 500 vs Picking Individual Stocks: What Actually Makes Sense?