✅ Instant Digital Delivery | 🔒 Secure Checkout | ⭐ Trusted by 1,000+ Professionals | 💬 24hr Support
Product Management Metrics - Sales Tracker Excel Dashboard
Pairs well with
Overview Product Management Metrics and Sales Tracker Excel Dashboard
Meet your new command center. This Product Management Metrics Excel Dashboard from Other Levels sits at the heart of our Dashboard Templates line. It pulls your numbers together, makes sense of them, and shows what to do next. Here’s the thing: you don’t need to overthink it. You load your data, pick a year or a salesperson, and the insights pop. For deeper engagement insights, pair this with the Customer Engagement & Sales Metrics Report.
You’ll notice the flow right away. Clear charts. Clean tables. Fast filters. It’s built for real work—sales analysis, sales data analysis, and tracking sales growth without the noise. In practice, you’ll see sales kpis, a tidy data model, and practical sales metrics to track day to day. That means better calls, faster decisions, and a stronger customer focus backed by real metrics.
What’s Inside
The dashboard has three focused sections. Each one answers a different question you face every week. Think of it as three lenses on the same story.
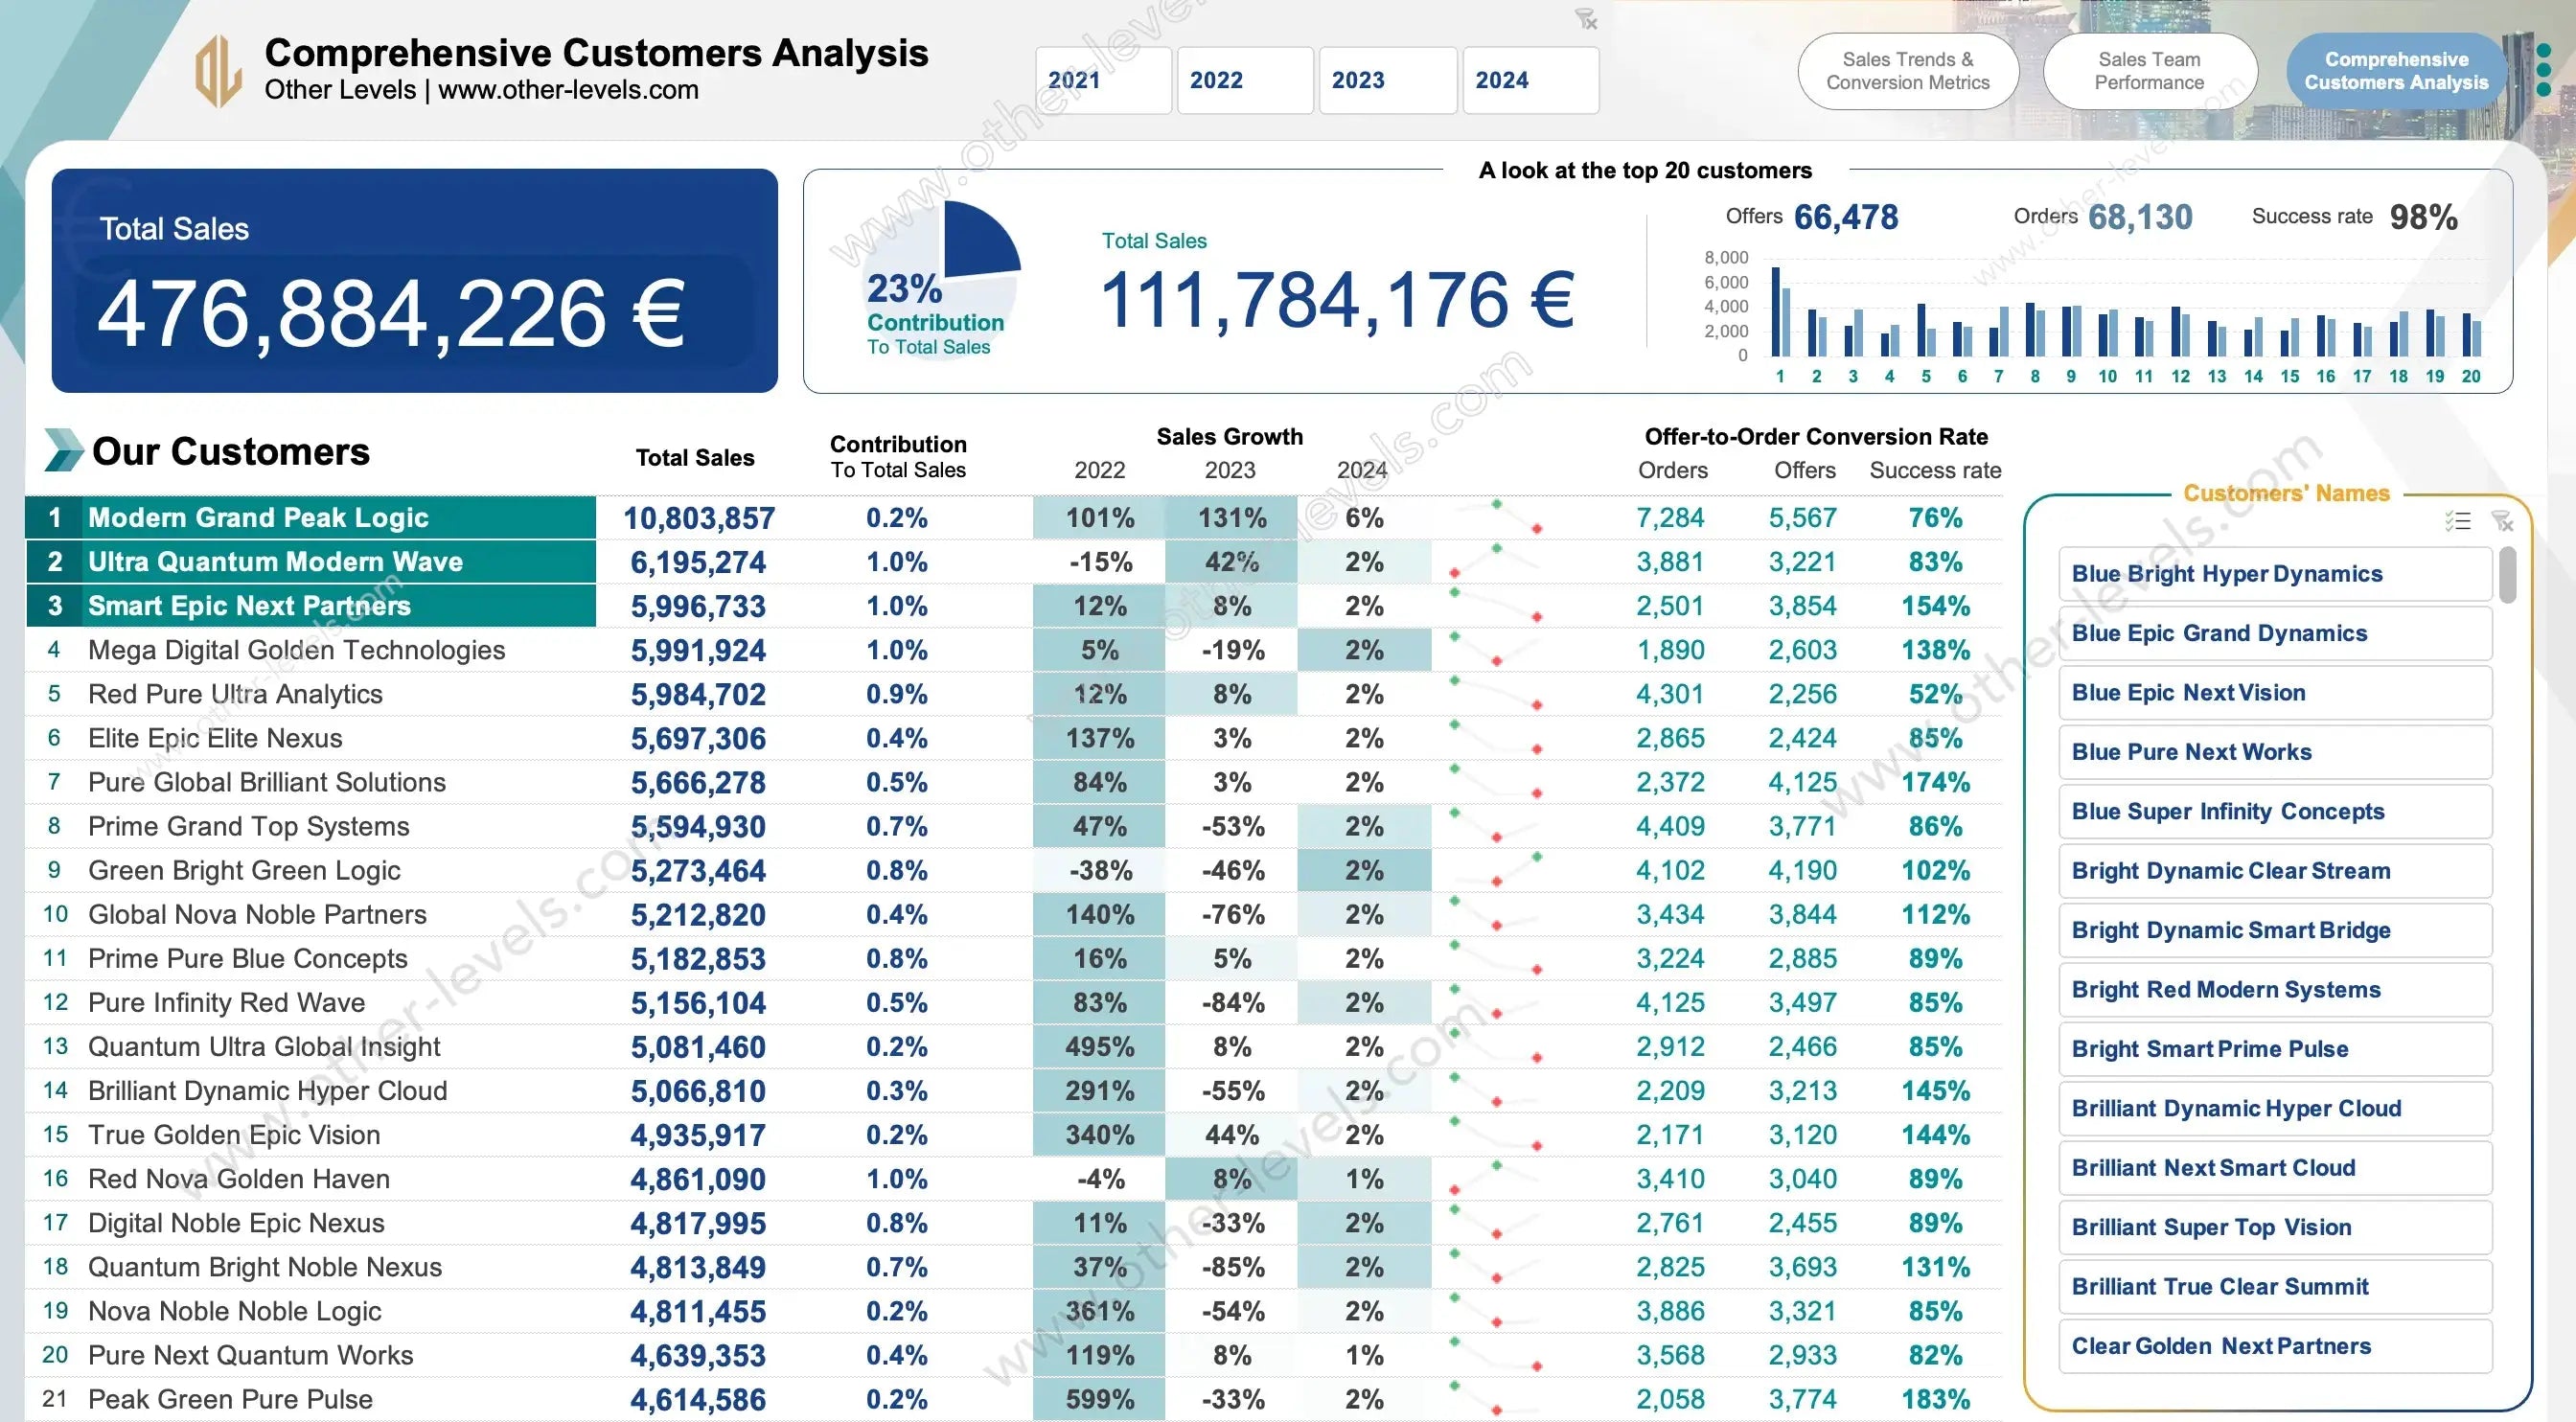
1) Customers Analysis
-
Comprehensive Customer Table — a quick scan that shows:
- All Customers
- Total Sales
- Customer Contribution to Total Sales
- Sales Growth for 3 Years
- Offer-to-Order Conversion Rate
- Customer Names Filter
- Yearly Filter
-
Top 20 Customers — zoom into the heavy hitters:
- Total Sales
- Contribution to Total Sales
- Yearly Filter
- Orders and Offers per Top 20 Customers
Here’s the thing: this is where patterns jump out. You’ll notice who’s growing, who’s stalling, and where to lean in next.
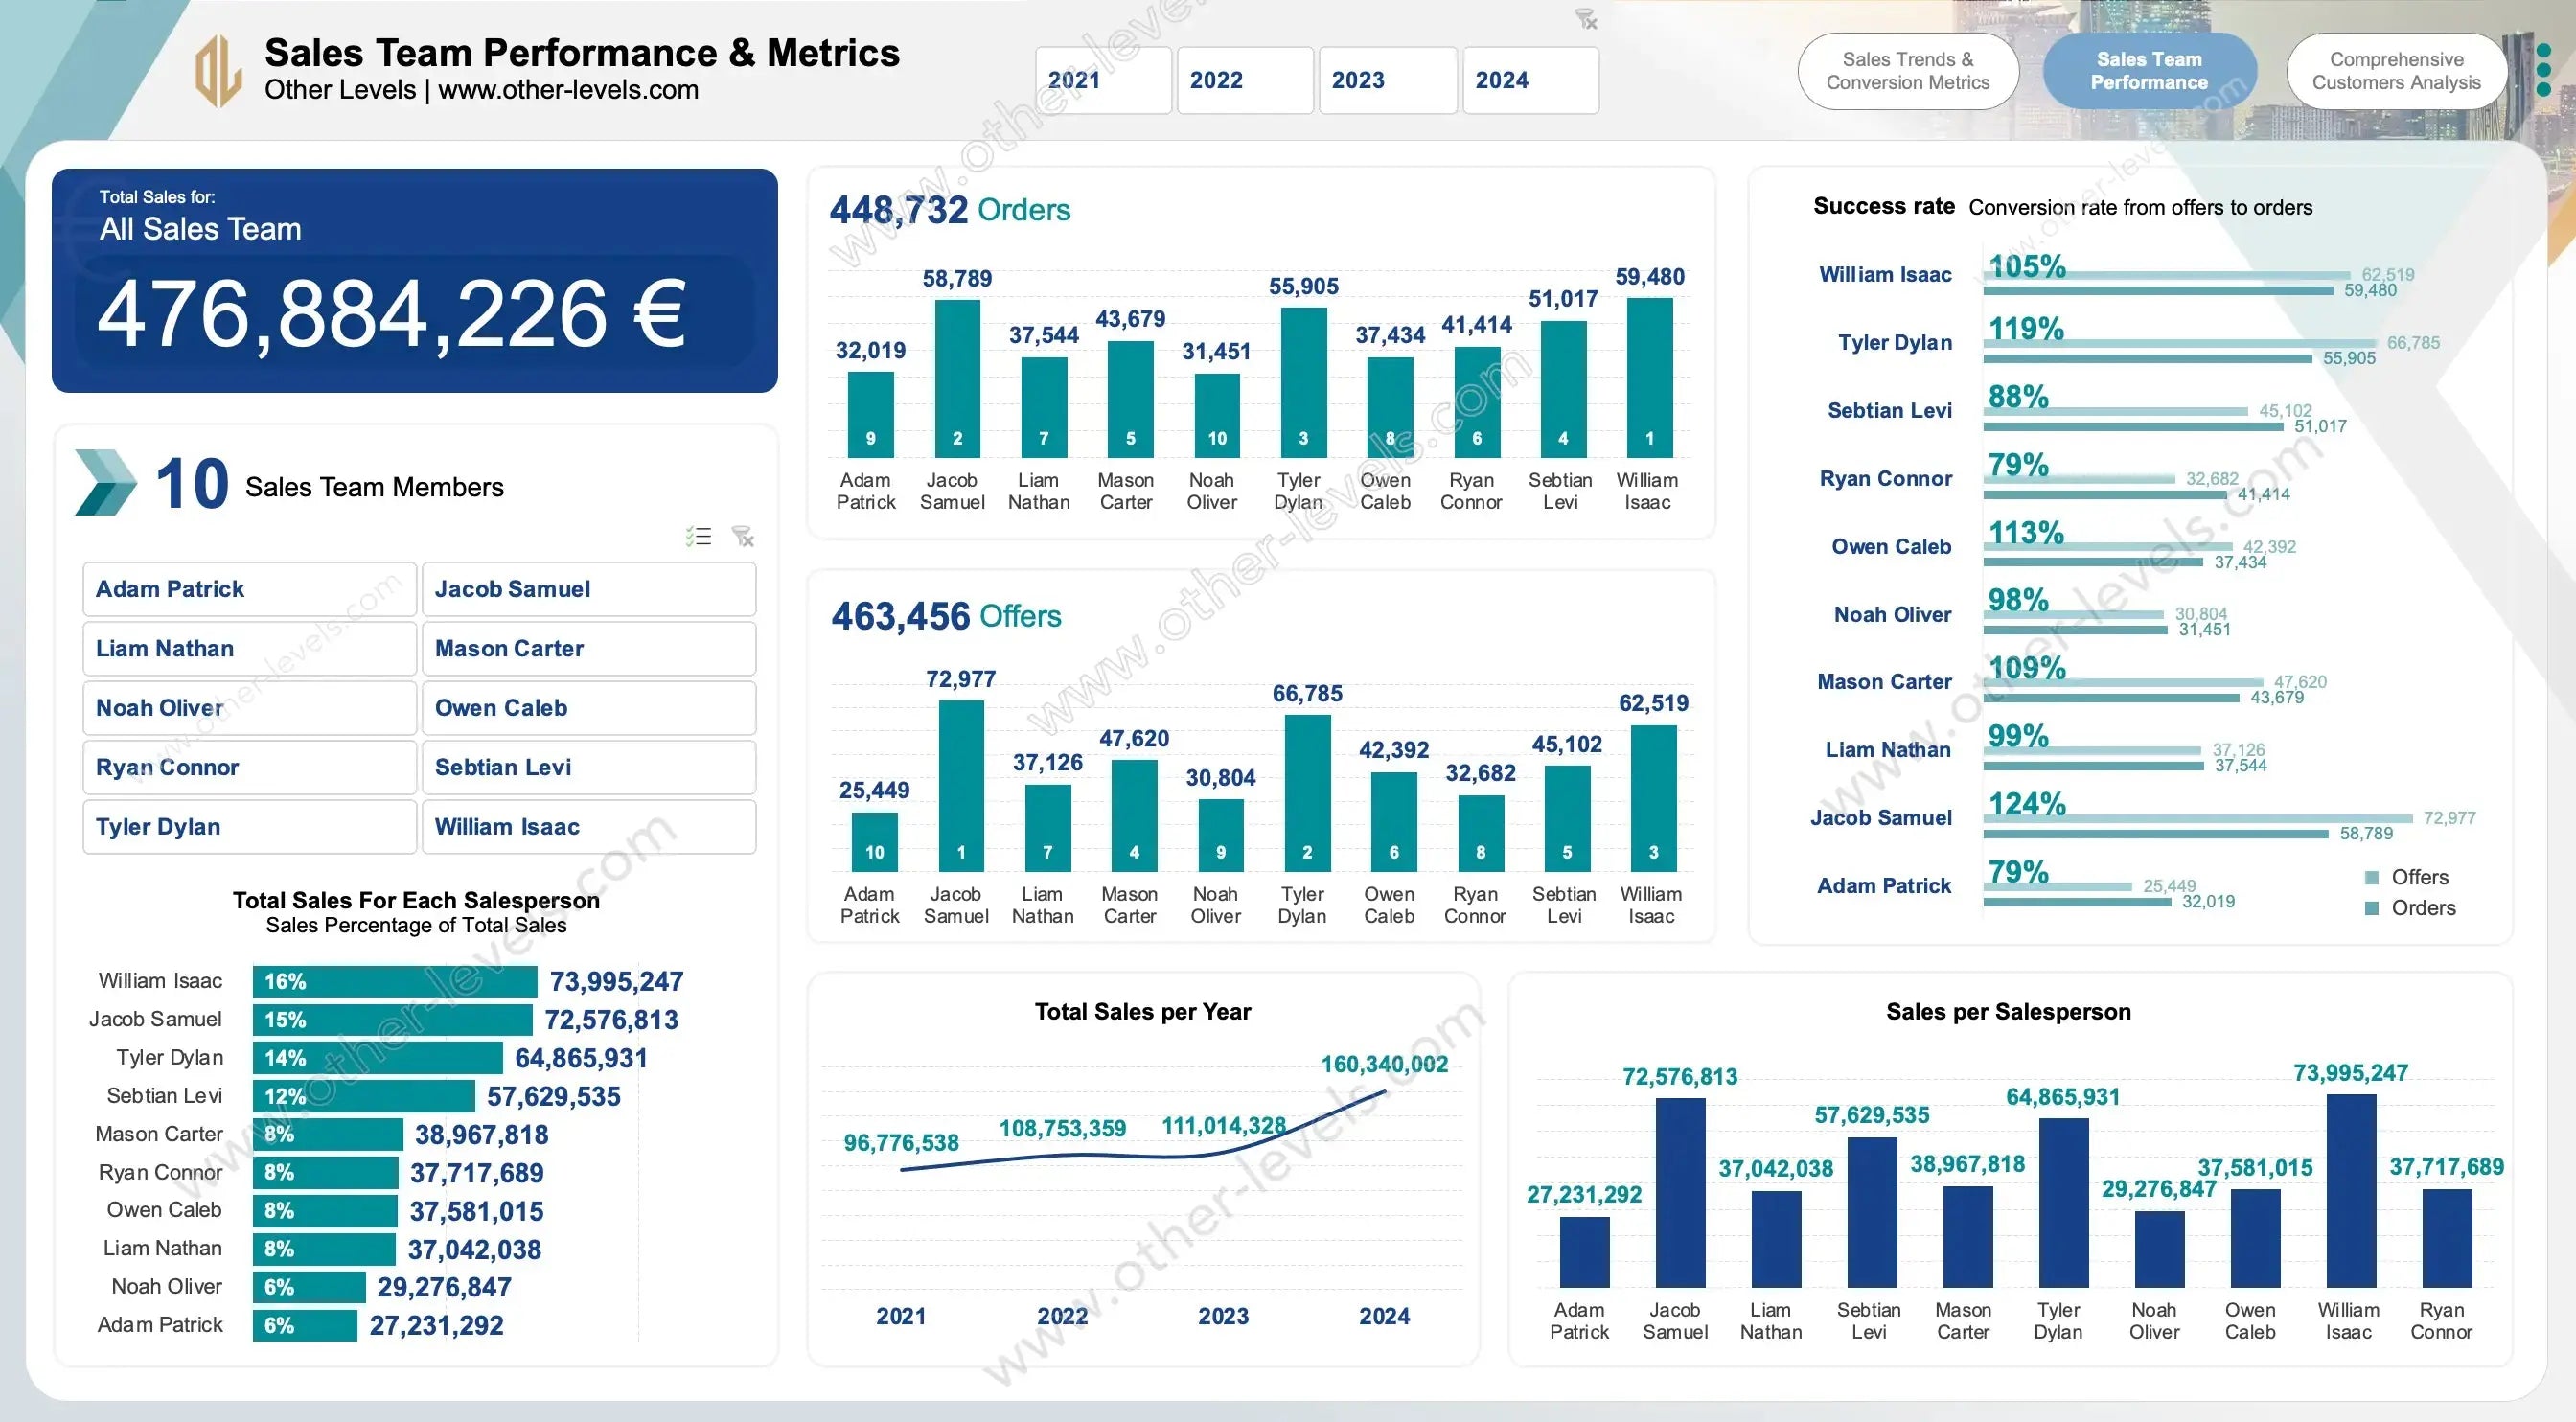
2) Sales Team Performance & Metrics
-
Total Sales Overview — at a glance:
- Total Sales for All Team Members
- Total Sales for Each Salesperson
- Sales Percentage of Total Sales
-
Sales Charts and Metrics — simple, readable visuals:
- Total Sales per Year line chart
- Orders by Salesperson column chart
- Offers by Salesperson column chart
-
Additional Sales Metrics — the levers you control:
- Total Orders
- Total Offers
- Total Sales Team Members
- Sales per Salesperson
- Success Rate (Conversion Rate from Offers to Orders)
- Average order value
-
Filters that keep you fast:
- Yearly Filter for all metrics
- Salesperson Filter for all metrics
In practice, this is gold for a salesperson manager. It also helps shape better salesperson strategies—who needs coaching, who needs capacity, and where the next win is likely to come from.
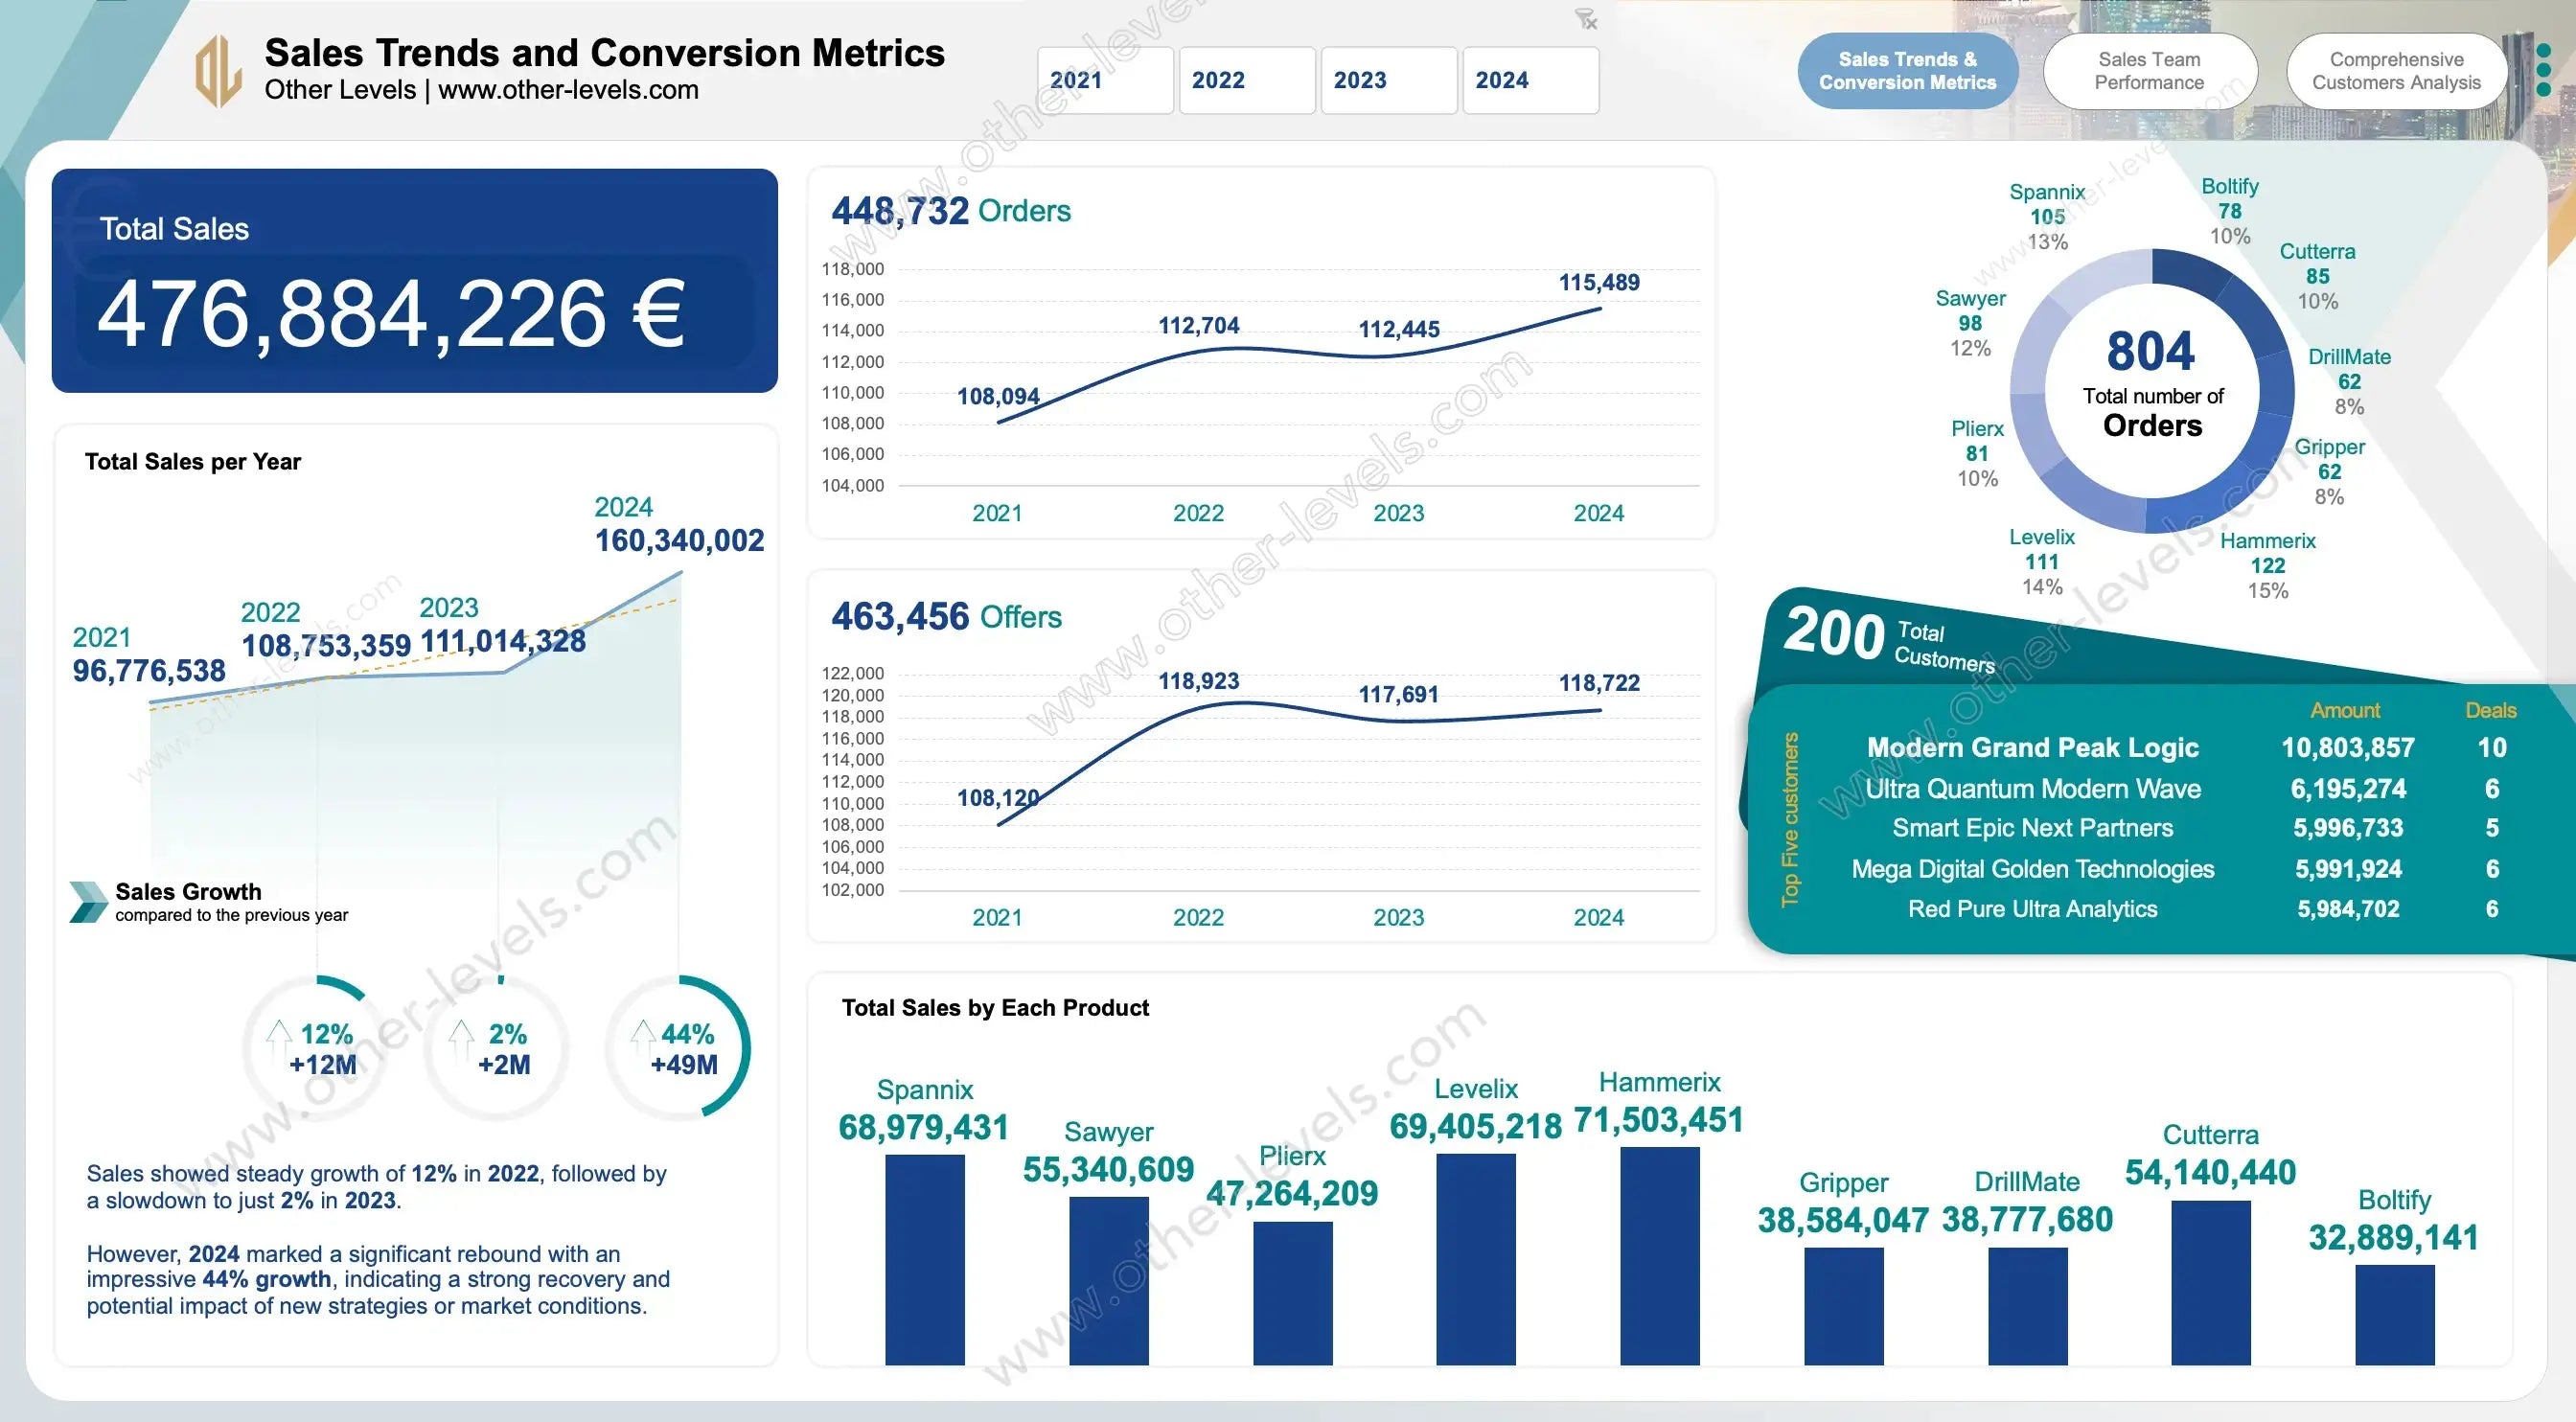
3) Sales Trends & Conversion Metrics
-
Sales Overview — the headline numbers:
- Total Sales
- Total Sales per Year line chart
- Growth Sales Compared to Previous Year
-
Offers and Orders — see momentum clearly:
- Offers per Year line chart
- Total Offers
- Orders per Year line chart
- Total Orders
-
Product & Customer Metrics — where the revenue lives:
- Sales by Products column chart
- Total Orders by Products pie chart
- Total Customers
- Top Five Customers
- Growth Sales Analysis
- Yearly Filter for everything above
Story time. Monday morning, you open the Trends view. One product line is bending upward. Another is flat. With one click, you pivot to customers and see exactly who’s driving it. When you’re ready to turn insights into a plan, use the Sales Analysis & Action Plans Roadmap Excel Dashboard to align targets and track execution.
Why Teams Like It
- Clarity — clean visuals, quick reads, no fluff.
- Speed — filters do the heavy lifting in seconds.
- Focus — the right sales metrics and sales kpis lined up in one view.
- Action — turn trends into targets, not just charts.
Customization & Data Model
Everything is editable. Add new metrics. Tweak the layout. Swap fields. The underlying data model keeps it stable while you iterate. Want deeper analysis? Go ahead and create pivottable in excel from the same data. You’ll keep the visuals tight while exploring details on the side.
It’s flexible enough for any sales org—small team, big territory, or multiple product lines. Use it to guide reviews, plan targets, and sharpen execution. In practice, this becomes your shared source of truth for sales metrics to track and steady sales growth.
Video Tutorial: Sales Dashboard in Excel
Watch the full tutorial on our Other Levels YouTube Channel
Specifications
Get all essential details in one place. From features and package contents to software compatibility and skill level required, this section gives you a clear overview so you know exactly what to expect before download.
Template Features
Package Details
Software Compatibility
Skill Level Required
Intermediate
FAQs
Please read our FAQs page to find out more.
Are the templates fully customizable?
Yes, all our templates are fully customizable. You can adjust the layout, data, and design elements to fit your specific needs. Our templates are designed to be flexible, allowing you to easily tailor them to your preferences.
Can I order a product in any language?
Yes, we provide products in any language. Simply select the "Dashboard language change" Service and once your order is placed, you will receive it within 48 hours.
What happens if I choose the wrong monitor screen size for my dashboard?
If you choose the wrong screen size, the dashboard may not display correctly on your monitor. Elements could appear too large, too small, or misaligned, affecting the readability and usability of the dashboard. We recommend selecting the appropriate screen size to ensure optimal viewing and performance.
Do I need specific skills to use the advanced Excel dashboard templates?
Our advanced Excel dashboards are easy to use, the only thing you need to know is how to work with PivotTables. With basic knowledge of PivotTables, you'll be able to customize and fully utilize these templates effortlessly. "Please check the skill level required"
All dashboards are 100% editable Excel files. Learn how to use them through our video tutorials, included datasets, and lifetime access program.