

Advanced Sales Intelligence Dashboard - Excel Sales Insights
Pairs well with

Advanced Sales Intelligence Dashboard - Excel Sales Insights
Advanced Sales Intelligence Dashboard - Excel Sales Insights
Transform your sales data into actionable insights with the Modern Sales Analytics System Dashboard, an innovative Excel Dashboard from Other Levels. Designed for modern businesses, this comprehensive tool provides a detailed analysis of sales performance, revenue metrics, and key performance indicators (KPIs) to support informed decision-making.
Comprehensive Sales Metrics
This dashboard empowers businesses by tracking essential metrics like Total Sales, Cost of Revenue, and Revenue Percentages across Three Regions. Monitor daily sales performance, analyze trends by Month, Day, or Day Name, and get real-time updates with the Last Dashboard Update feature.
Detailed Evaluation Tools
Evaluate performance effectively with built-in KPIs, Evaluation Scores, and Key Evaluation Questions. Gain a clear understanding of customer behavior, product performance, and retail success using features like Web Store Visitors & Sales and Top Products with Descriptions.
Streamlined Reporting & Visualization
Interactive elements, including Hyperlinked Menus, allow seamless navigation through 8 different analysis sheets. Visualize sales data by Branch Name, Warehouse, and Retail Items for granular insights into product and location performance. The dashboard also includes a summary of Retail Sales Notes, making it easier to capture key takeaways.
Customizable and Ready-to-Use
With five clean, pre-designed sheets, this dashboard is ready for immediate use. Customizable and user-friendly, it’s perfect for tracking Device Targets, Actual Sales, and comparing data against your goals.
Why Choose This Dashboard?
Whether you’re a retail manager, sales executive, or business analyst, the Modern Sales Analytics System Dashboard simplifies complex data into actionable insights. Elevate your reporting and boost your business strategy with this cutting-edge Excel Dashboard from Other Levels.
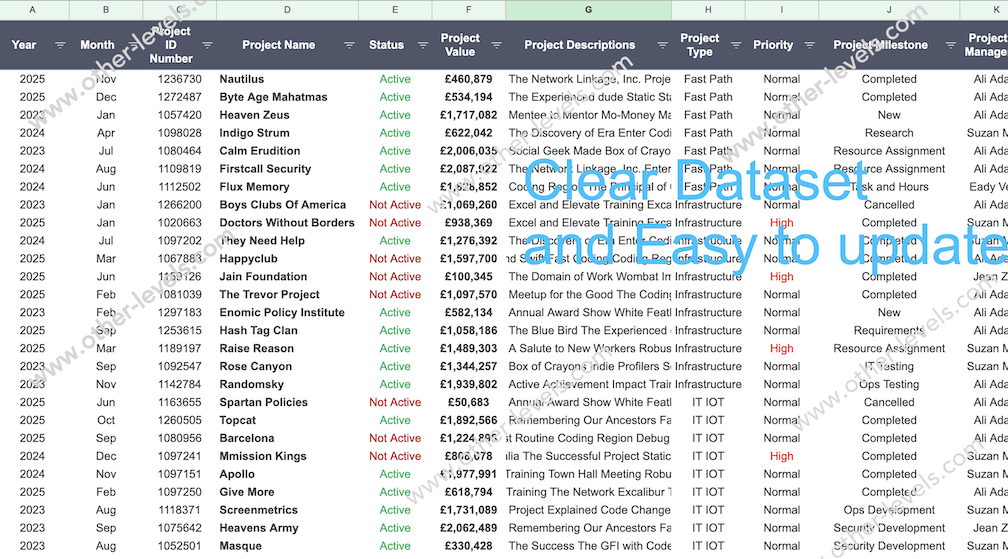
This Excel template is designed for users who have experience working with Data Tables in Microsoft Excel. To modify and fully utilize this template, you will need to:
- Understand Structured References: Data Tables use structured references instead of regular cell references, which are essential for formulas and calculations.
- Add or Edit Rows/Columns: Use the built-in table tools to add or modify rows and columns without breaking formulas or formatting.
- Apply Filters and Sorts: Leverage the table’s built-in filter and sorting features to view and analyze data effectively.
- Maintain Table Integrity: Avoid deleting or altering table structures without understanding their dependencies in linked charts, dashboards, or formulas.
Key Features
- 8 Menu Hyperlinks
- Products sales
- Cost of Revenue
- Revenue per day
- Last dashboard Update
- Cost of revenue refers to the total cost
- Retail Sales
- key performance indicator
- Month, Day, and Day Name
- Branch Name
- Total Sales
- Customers
- KPIs
- Score
- Evaluation Type
- Typical key evaluation questions
- Total Evaluation
- Evaluation Score
- warehouse Name & Sales
- retail Items & Sales
- Retail Sales Notes
- Web store Visitors & Sales
- Top Products & Products Description
- Number of Sales
- Actual 1 & 2
- Devices Target & Actual
- Three different regions
- Total Revenue & Re venue Percentages
- Fife clean sheets ready to use
Template Features
Package Details
Software Compatibility
Skill Level Required
Advanced
FAQs
Please read our FAQs page to find out more.
Are the templates fully customizable?
Yes, all our templates are fully customizable. You can adjust the layout, data, and design elements to fit your specific needs. Our templates are designed to be flexible, allowing you to easily tailor them to your preferences.
Can I order a product in any language?
Yes, we provide products in any language. Simply select the "Other Language" option from the product options during your purchase. Once your order is placed, you will receive it within 48 hours.
What happens if I choose the wrong monitor screen size for my dashboard?
If you choose the wrong screen size, the dashboard may not display correctly on your monitor. Elements could appear too large, too small, or misaligned, affecting the readability and usability of the dashboard. We recommend selecting the appropriate screen size to ensure optimal viewing and performance.
Do I need any specific skills to use the dashboards?
Yes, to effectively use our advanced Excel dashboards, you must have at least a basic understanding of PivotTables. This will help you customize and analyze the data efficiently.
Do you provide services to add our own data to the purchased templates?
No, we do not offer services to input your specific data into the purchased templates. The templates are fully customizable, allowing you to easily add your own data.
Do I need specific skills to use the advanced Excel dashboard templates?
Our advanced Excel dashboards are easy to use, the only thing you need to know is how to work with PivotTables. With basic knowledge of PivotTables, you'll be able to customize and fully utilize these templates effortlessly. "Please check the skill level required"
Can I showcase these templates on websites or online platforms?
No, it is against our copyright policy to showcase these templates on websites, social media, or any online platforms. The templates are for your personal use only and are not permitted for public display or distribution.


