
Service Level Management Overview Excel Dashboard SLA
Pairs well with

Service Level Management Overview Excel Dashboard SLA
Service Level Management Overview Excel Dashboard SLA
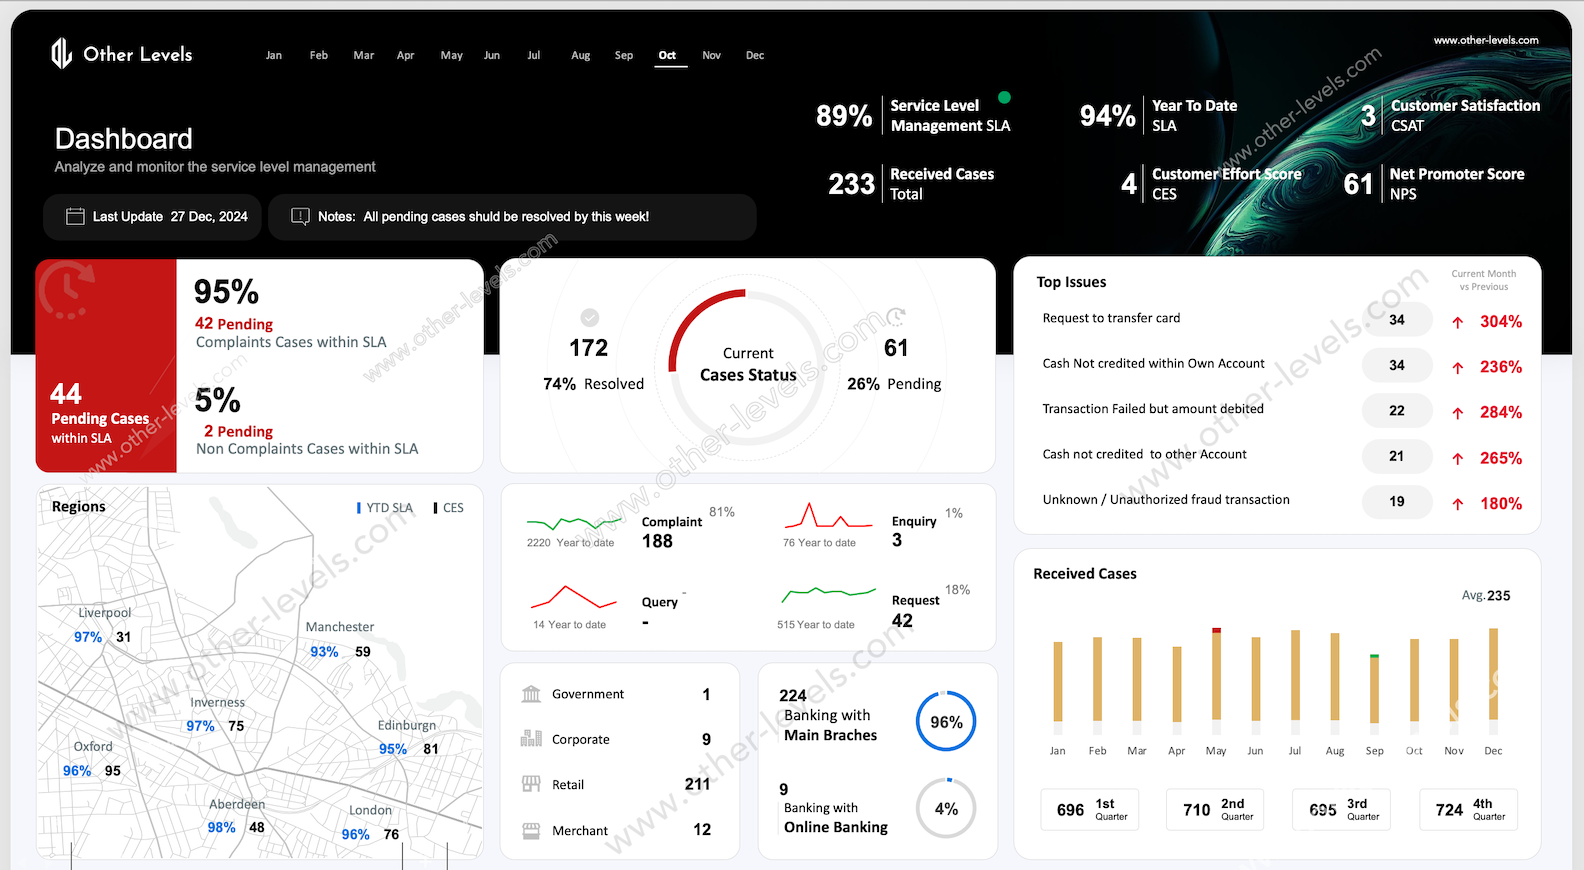
Optimize your service delivery with the SLA Service Level Management Dashboard, a comprehensive Excel Dashboard designed to provide actionable insights into service performance. Tailored for businesses focused on customer satisfaction and operational excellence, this dashboard empowers you to track, analyze, and improve your Service Level Agreements (SLAs).
The dashboard delivers an intuitive overview of SLA compliance, including metrics like Year-to-Date SLA Percentage, Pending Cases, and Resolved Case Rates. Gain insights into monthly and quarterly trends for received cases, helping you identify patterns and improve resource allocation.
For customer-focused organizations, the dashboard also tracks essential satisfaction metrics such as Customer Satisfaction (CSAT), Customer Effort Score (CES), and Net Promoter Score (NPS). Understand feedback trends by region and sector, ensuring targeted improvements to enhance customer experience.
Its interactive slicers allow for real-time data segmentation by month, region, or case type, enabling users to focus on specific areas of interest. Visual comparisons of top issues across current and previous months provide actionable insights, helping businesses address recurring challenges effectively.
Designed for sectors like banking and online services, the SLA Service Level Management Dashboard highlights performance by sector and tracks cases by branches and regions. This makes it an indispensable tool for managers aiming to streamline operations, enhance satisfaction, and achieve SLA targets consistently.
Choose the SLA Service Level Management Dashboard by Other Levels to transform raw data into actionable strategies. Elevate your service standards and exceed customer expectations with this robust, user-friendly solution.
Key Features
- Pending Complaints cases within SLA
- Pending Non Complaints cases within SLA
- Service Level Management SLA Percentage
- Year to date SLA
- Total of Received Cases
- Customer Satisfaction (CSAT)
- Customer Effort Score (CES)
- Net Promoter Score (NPS)
- Current Cases Status
- Resolver Cases percentages
- Pending Cases
- Received Cases per month
- Received Cases per Quarter
- Feedback Type
- Cases by Sectors
- Banking With Branches and Online
- Top Five Issues with comparison showing Current Month vs Previous
- Received Customer Effort Score (CES) by Regions
- Received Cases by Regions
- Monthly Slicer
Template Features
Package Details
Software Compatibility
Skill Level Required
Beginner
FAQs
Please read our FAQs page to find out more.
Are the templates fully customizable?
Yes, all our templates are fully customizable. You can adjust the layout, data, and design elements to fit your specific needs. Our templates are designed to be flexible, allowing you to easily tailor them to your preferences.
Can I order a product in any language?
Yes, we provide products in any language. Simply select the "Other Language" option from the product options during your purchase. Once your order is placed, you will receive it within 48 hours.
What happens if I choose the wrong monitor screen size for my dashboard?
If you choose the wrong screen size, the dashboard may not display correctly on your monitor. Elements could appear too large, too small, or misaligned, affecting the readability and usability of the dashboard. We recommend selecting the appropriate screen size to ensure optimal viewing and performance.
Do I need any specific skills to use the dashboards?
Yes, to effectively use our advanced Excel dashboards, you must have at least a basic understanding of PivotTables. This will help you customize and analyze the data efficiently.
Do you provide services to add our own data to the purchased templates?
No, we do not offer services to input your specific data into the purchased templates. The templates are fully customizable, allowing you to easily add your own data.
Do I need specific skills to use the advanced Excel dashboard templates?
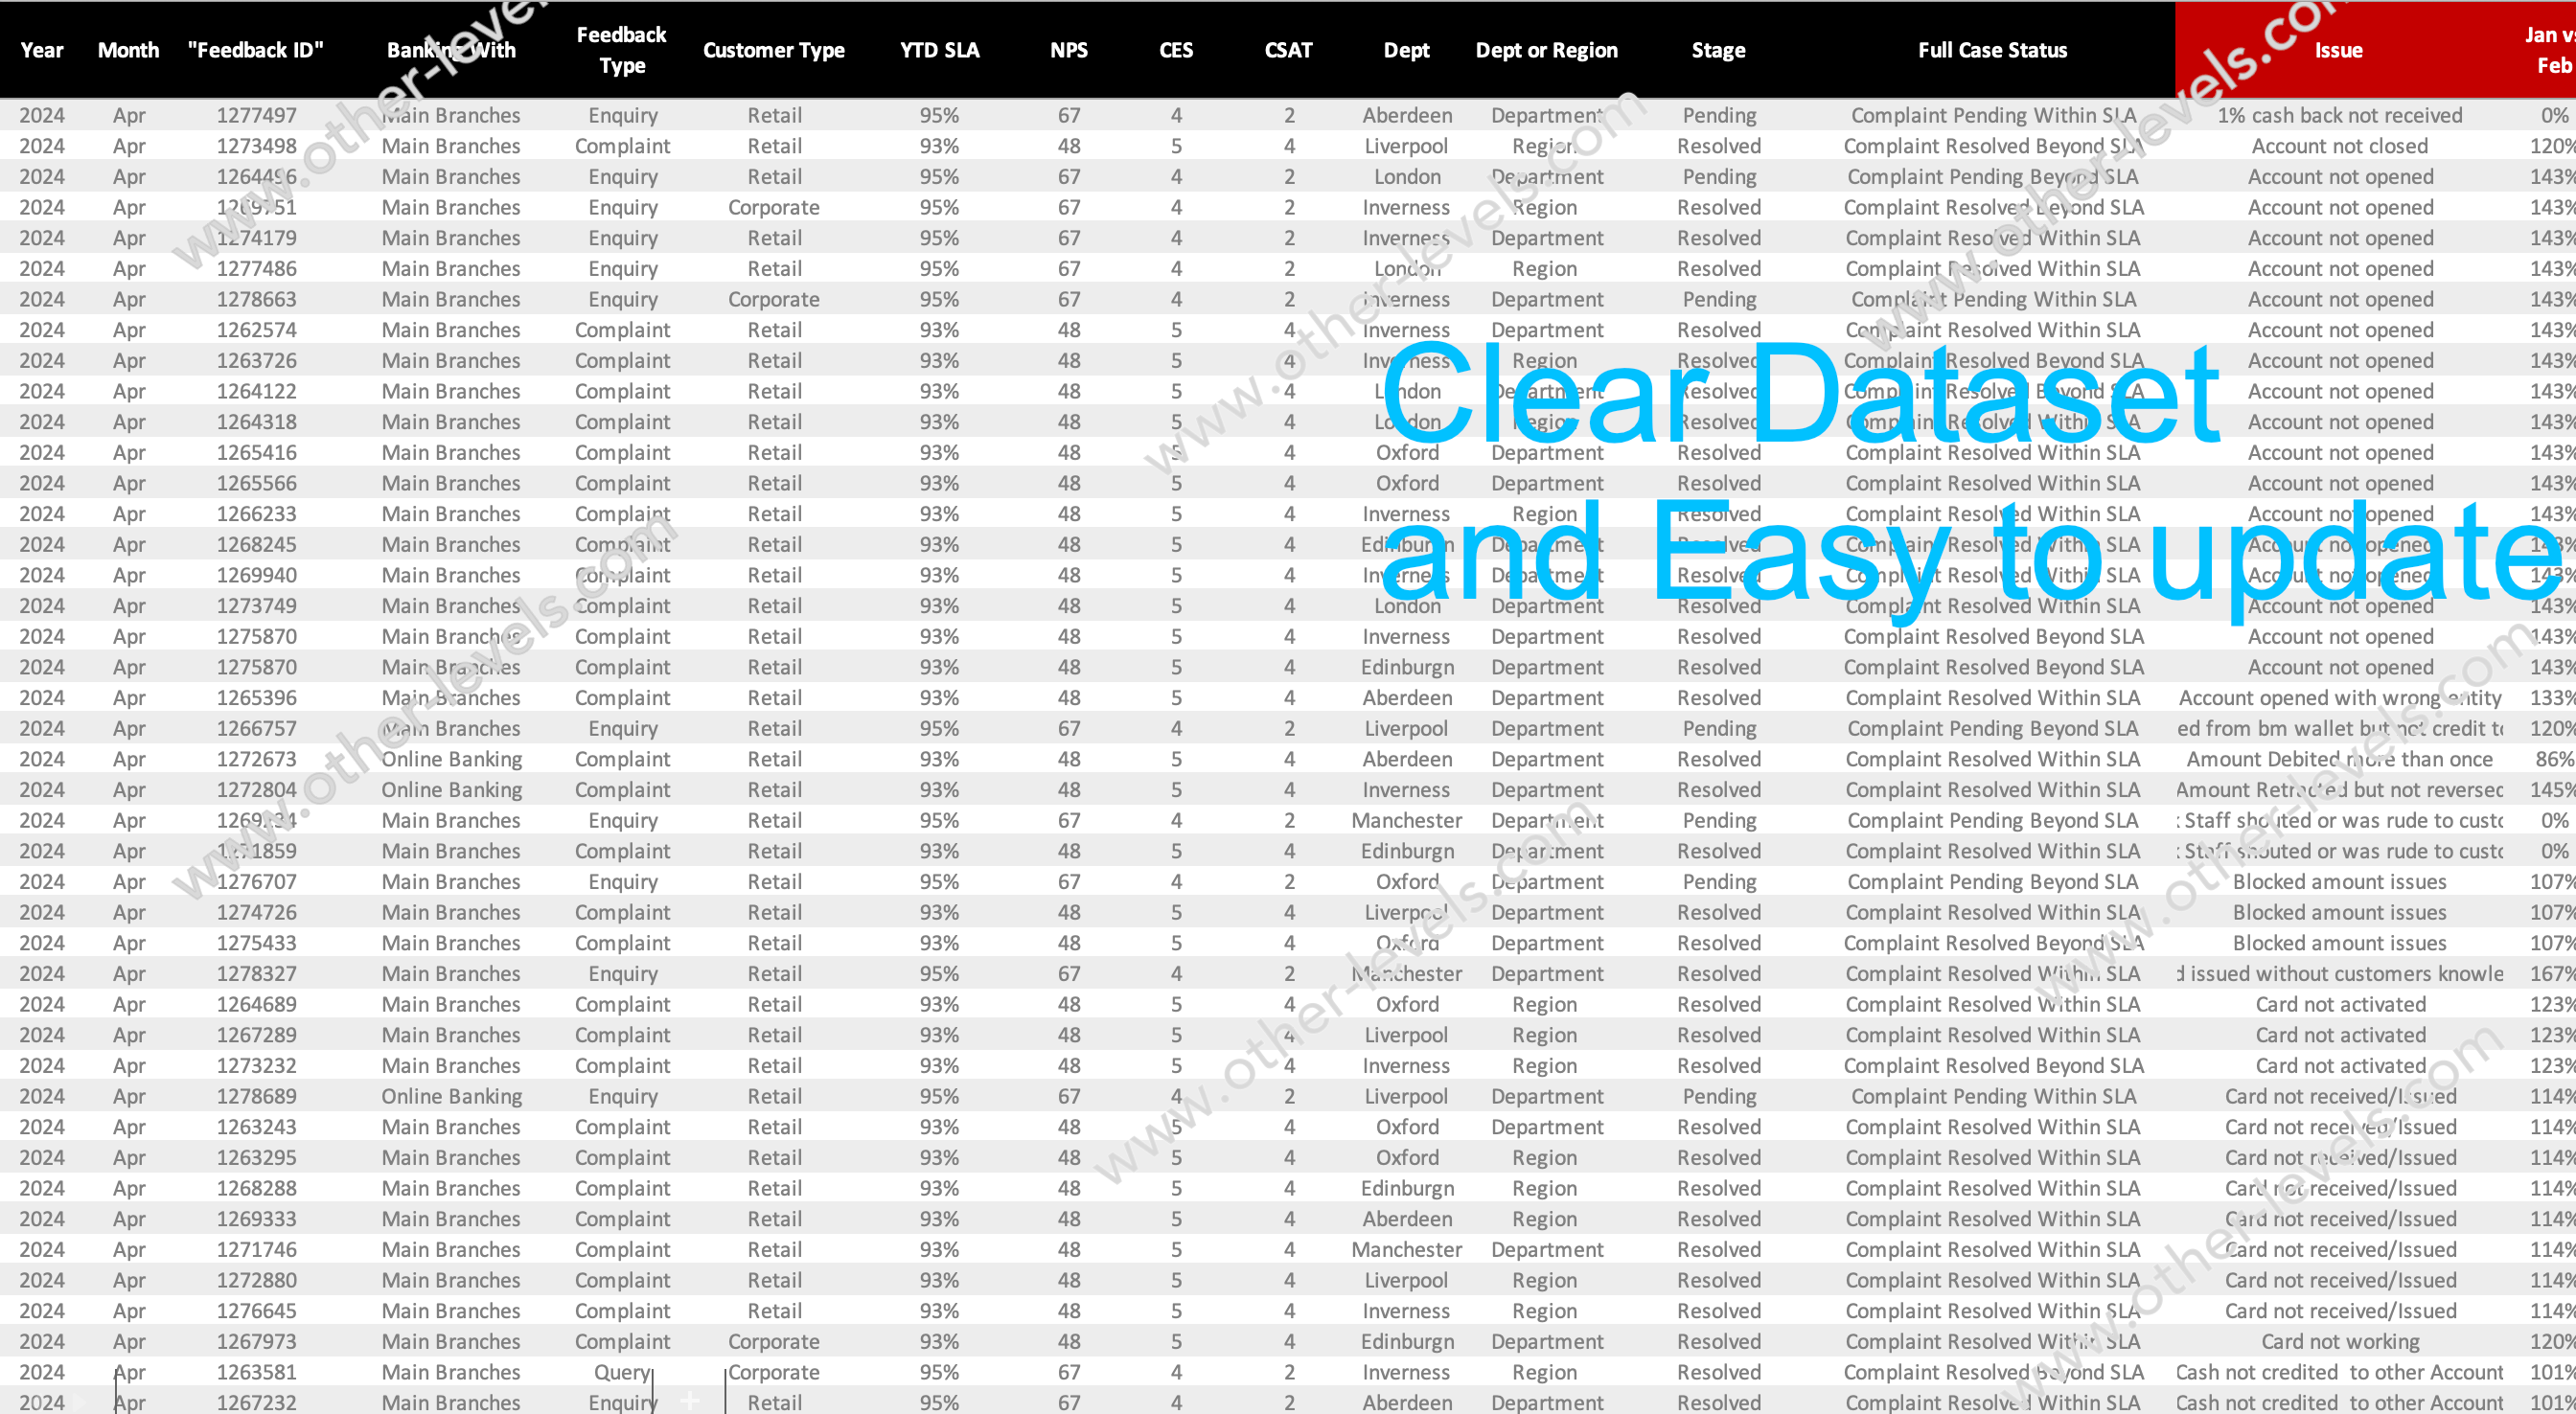
Our advanced Excel dashboards are easy to use, the only thing you need to know is how to work with PivotTables. With basic knowledge of PivotTables, you'll be able to customize and fully utilize these templates effortlessly. "Please check the skill level required"
Can I showcase these templates on websites or online platforms?
No, it is against our copyright policy to showcase these templates on websites, social media, or any online platforms. The templates are for your personal use only and are not permitted for public display or distribution.
Business Templates
Shop the Analytical Look
Services Requests Management Power BI Dashboard Template
Project Status Tracking Excel Dashboard
Comprehensive Project Management Performance Excel Dashboard
Interactive Call Center PowerPoint Dashboard


