Service Level Agreement Summary Excel Dashboard
Pairs well with

Service Level Agreement Summary Excel Dashboard
Service Level Agreement Summary Excel Dashboard
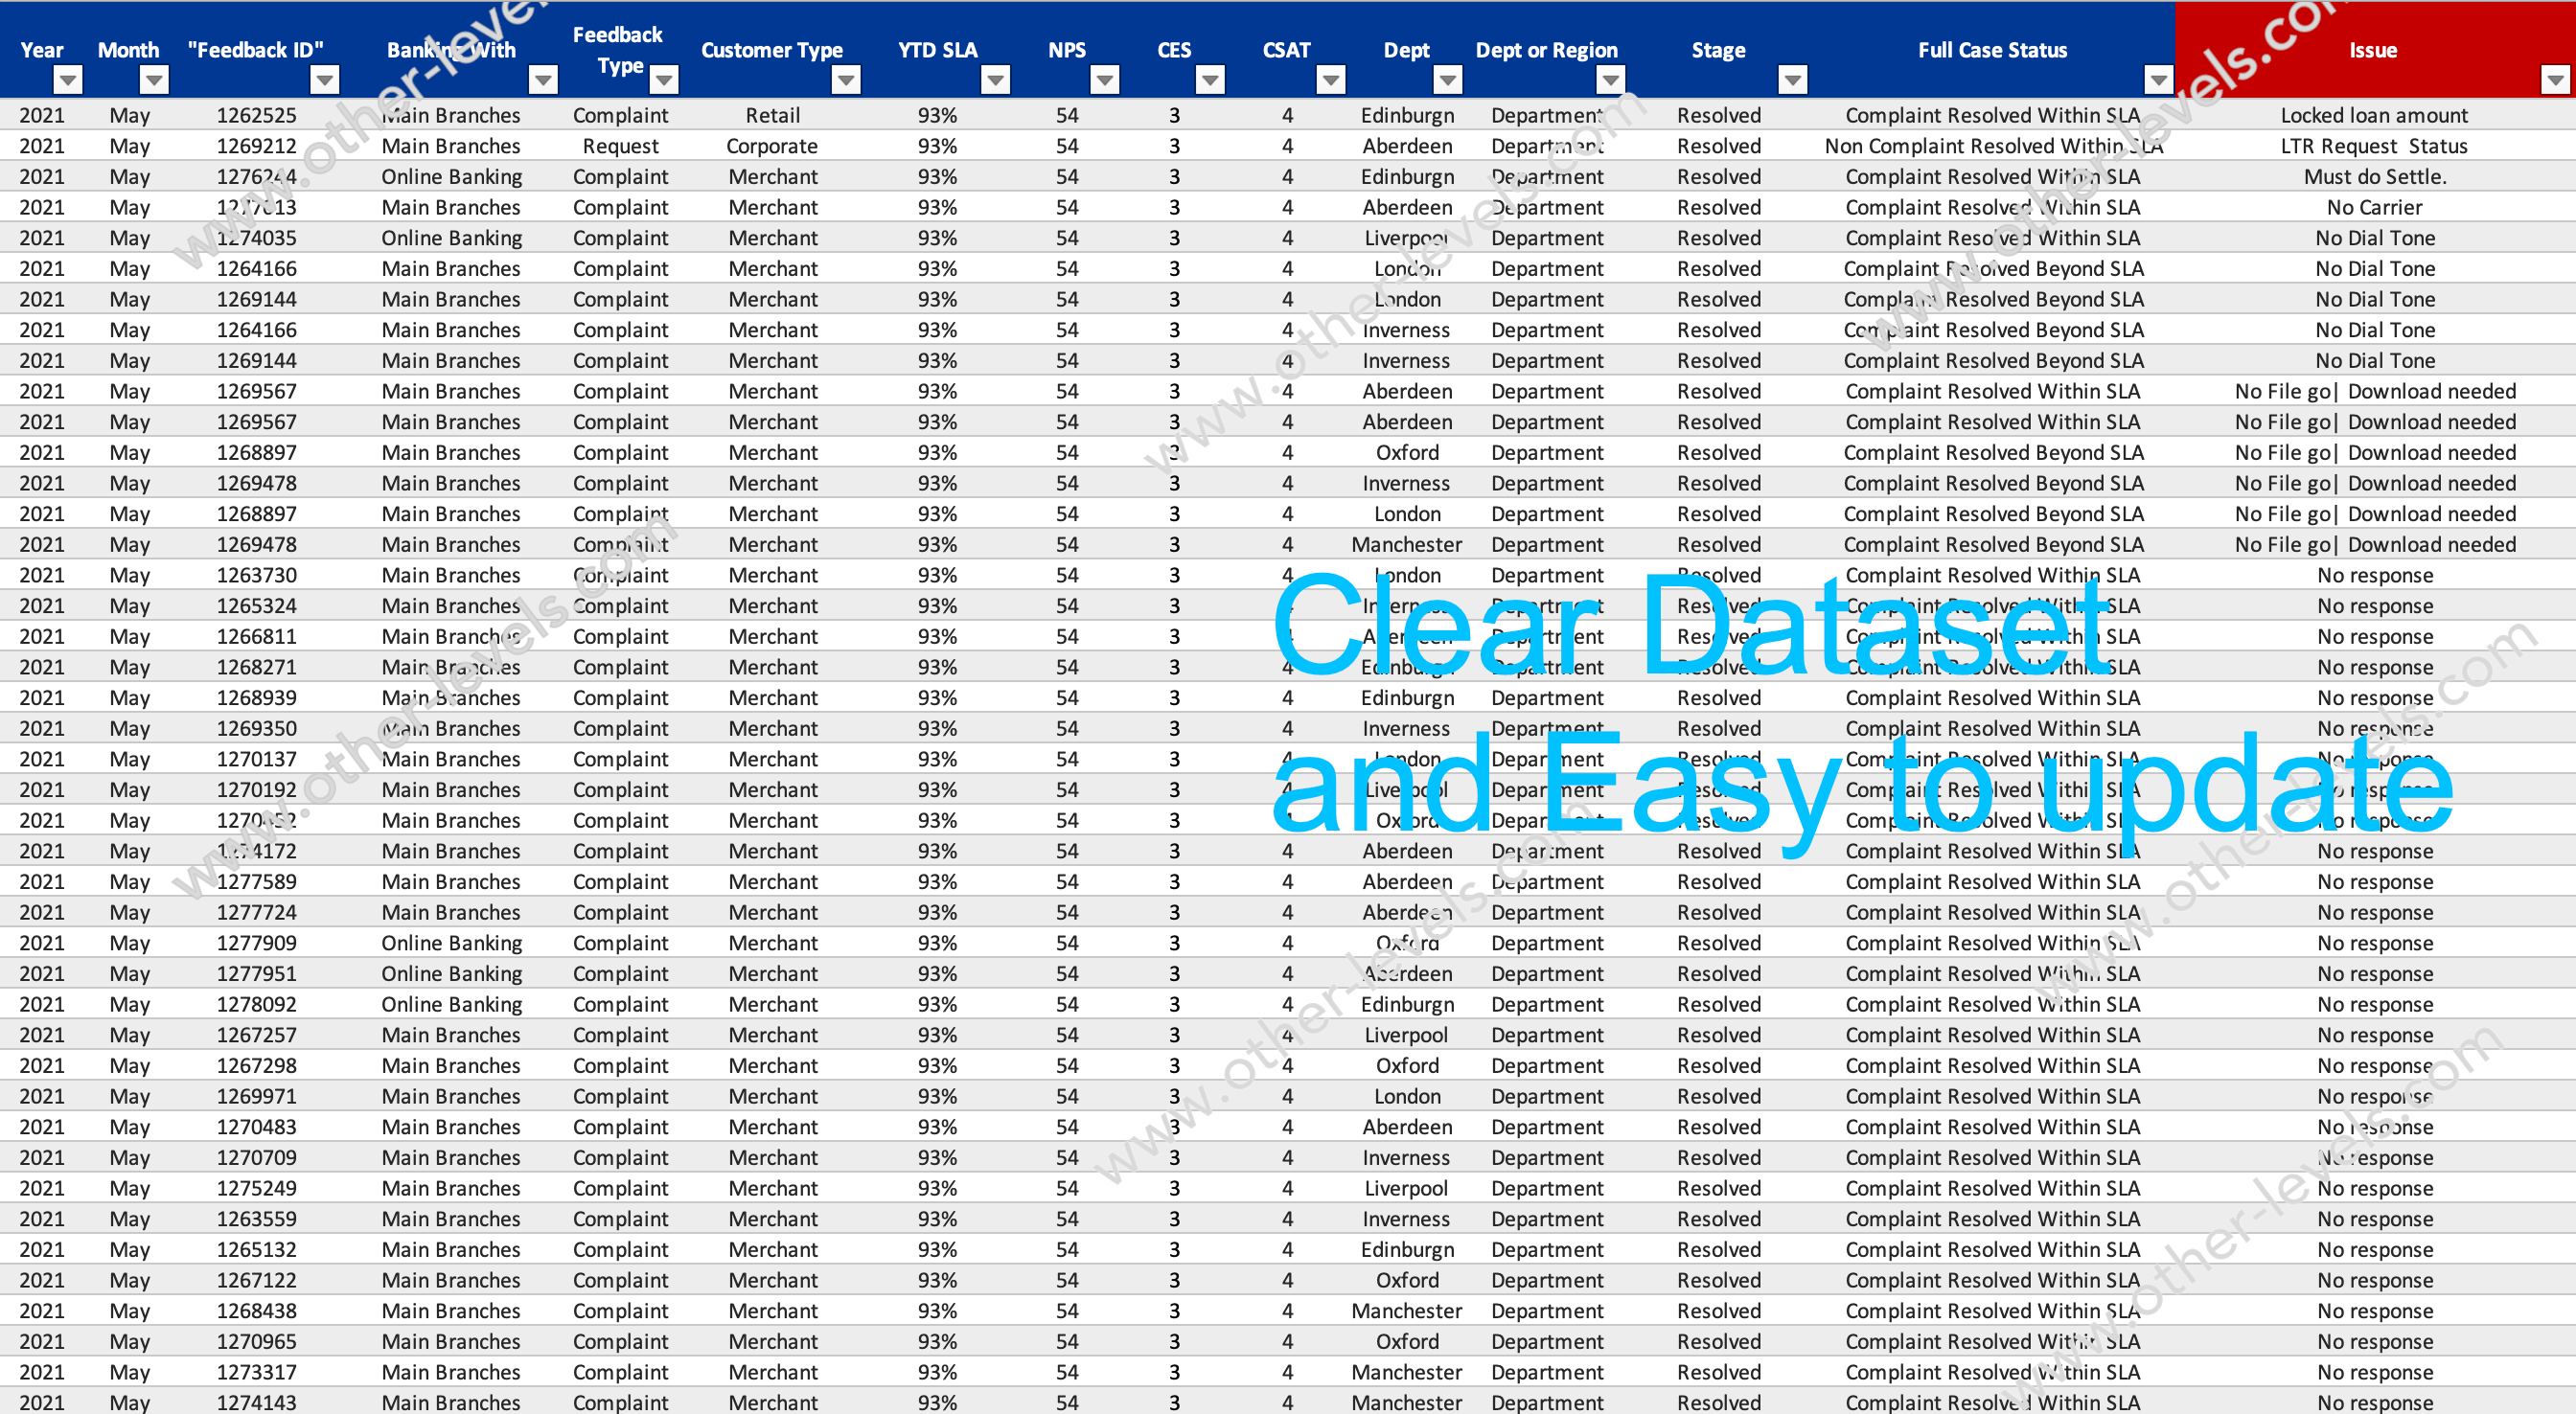
Elevate your service management efficiency with the Service Level Agreement Summary Dashboard, a professional-grade Excel Dashboard by Other Levels. Designed to provide a detailed analysis of service performance and customer feedback, this dashboard is the ideal tool for organizations aiming to monitor, evaluate, and improve their Service Level Agreements (SLAs).
Gain actionable insights into key SLA metrics, including pending cases within SLA, resolved case percentages, and year-to-date SLA performance. With precise tracking of received cases, categorized by month, quarter, and region, this dashboard ensures that no detail goes unnoticed.
Customer satisfaction is at the heart of service excellence, and this dashboard incorporates powerful metrics such as Customer Satisfaction (CSAT), Customer Effort Score (CES), and Net Promoter Score (NPS) to help you measure and enhance customer experience. Dive deeper with visualizations of case feedback types, sector-wise case distribution, and comparisons of current and previous month top issues, enabling you to identify trends and areas for improvement.
This dynamic tool also features a monthly slicer for customized data analysis, allowing users to tailor insights based on their specific requirements. Whether you manage customer support for bank branches or online banking, this dashboard equips you with the data-driven intelligence needed to deliver excellence.
The Service Level Agreement Summary Dashboard is perfect for service managers, analysts, and decision-makers seeking to optimize performance and enhance customer satisfaction. Trust Other Levels for a solution that blends ease of use with robust analytics, transforming your SLA management into a strategic advantage.
Key Features
- Pending Complaints cases within SLA
- Pending Non Complaints cases within SLA
- Service Level Management SLA Percentage
- Year to date SLA
- Total of Received Cases
- Customer Satisfaction (CSAT)
- Customer Effort Score (CES)
- Net Promoter Score (NPS)
- Current Cases Status
- Resolver Cases percentages
- Pending Cases
- Received Cases per month
- Received Cases per Quarter
- Feedback Type
- Cases by Sectors
- Banking With Branches and Online
- Top Five Issues with comparison showing Current Month vs Previous
- Received Customer Effort Score (CES) by Regions
- Received Cases by Regions
- Monthly Slicer
Template Features
Package Details
Software Compatibility
Skill Level Required
Beginner
FAQs
Please read our FAQs page to find out more.
Are the templates fully customizable?
Yes, all our templates are fully customizable. You can adjust the layout, data, and design elements to fit your specific needs. Our templates are designed to be flexible, allowing you to easily tailor them to your preferences.
Can I order a product in any language?
Yes, we provide products in any language. Simply select the "Other Language" option from the product options during your purchase. Once your order is placed, you will receive it within 48 hours.
What happens if I choose the wrong monitor screen size for my dashboard?
If you choose the wrong screen size, the dashboard may not display correctly on your monitor. Elements could appear too large, too small, or misaligned, affecting the readability and usability of the dashboard. We recommend selecting the appropriate screen size to ensure optimal viewing and performance.
Do I need any specific skills to use the dashboards?
Yes, to effectively use our advanced Excel dashboards, you must have at least a basic understanding of PivotTables. This will help you customize and analyze the data efficiently.
Do you provide services to add our own data to the purchased templates?
No, we do not offer services to input your specific data into the purchased templates. The templates are fully customizable, allowing you to easily add your own data.
Do I need specific skills to use the advanced Excel dashboard templates?
Our advanced Excel dashboards are easy to use, the only thing you need to know is how to work with PivotTables. With basic knowledge of PivotTables, you'll be able to customize and fully utilize these templates effortlessly. "Please check the skill level required"
Can I showcase these templates on websites or online platforms?
No, it is against our copyright policy to showcase these templates on websites, social media, or any online platforms. The templates are for your personal use only and are not permitted for public display or distribution.
Business Templates
Shop the Analytical Look
Services Requests Management Power BI Dashboard Template
Project Status Tracking Excel Dashboard
Comprehensive Project Management Performance Excel Dashboard
Interactive Call Center PowerPoint Dashboard


