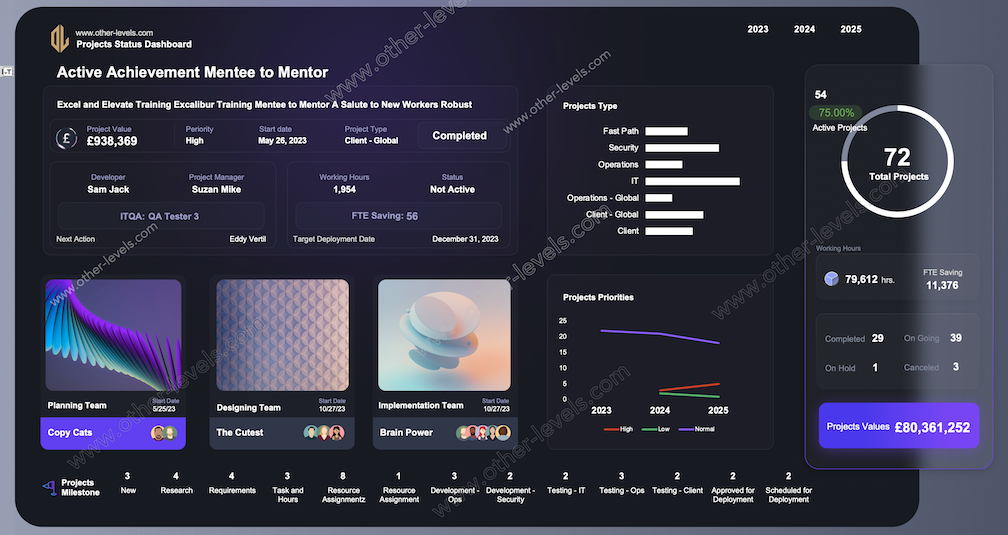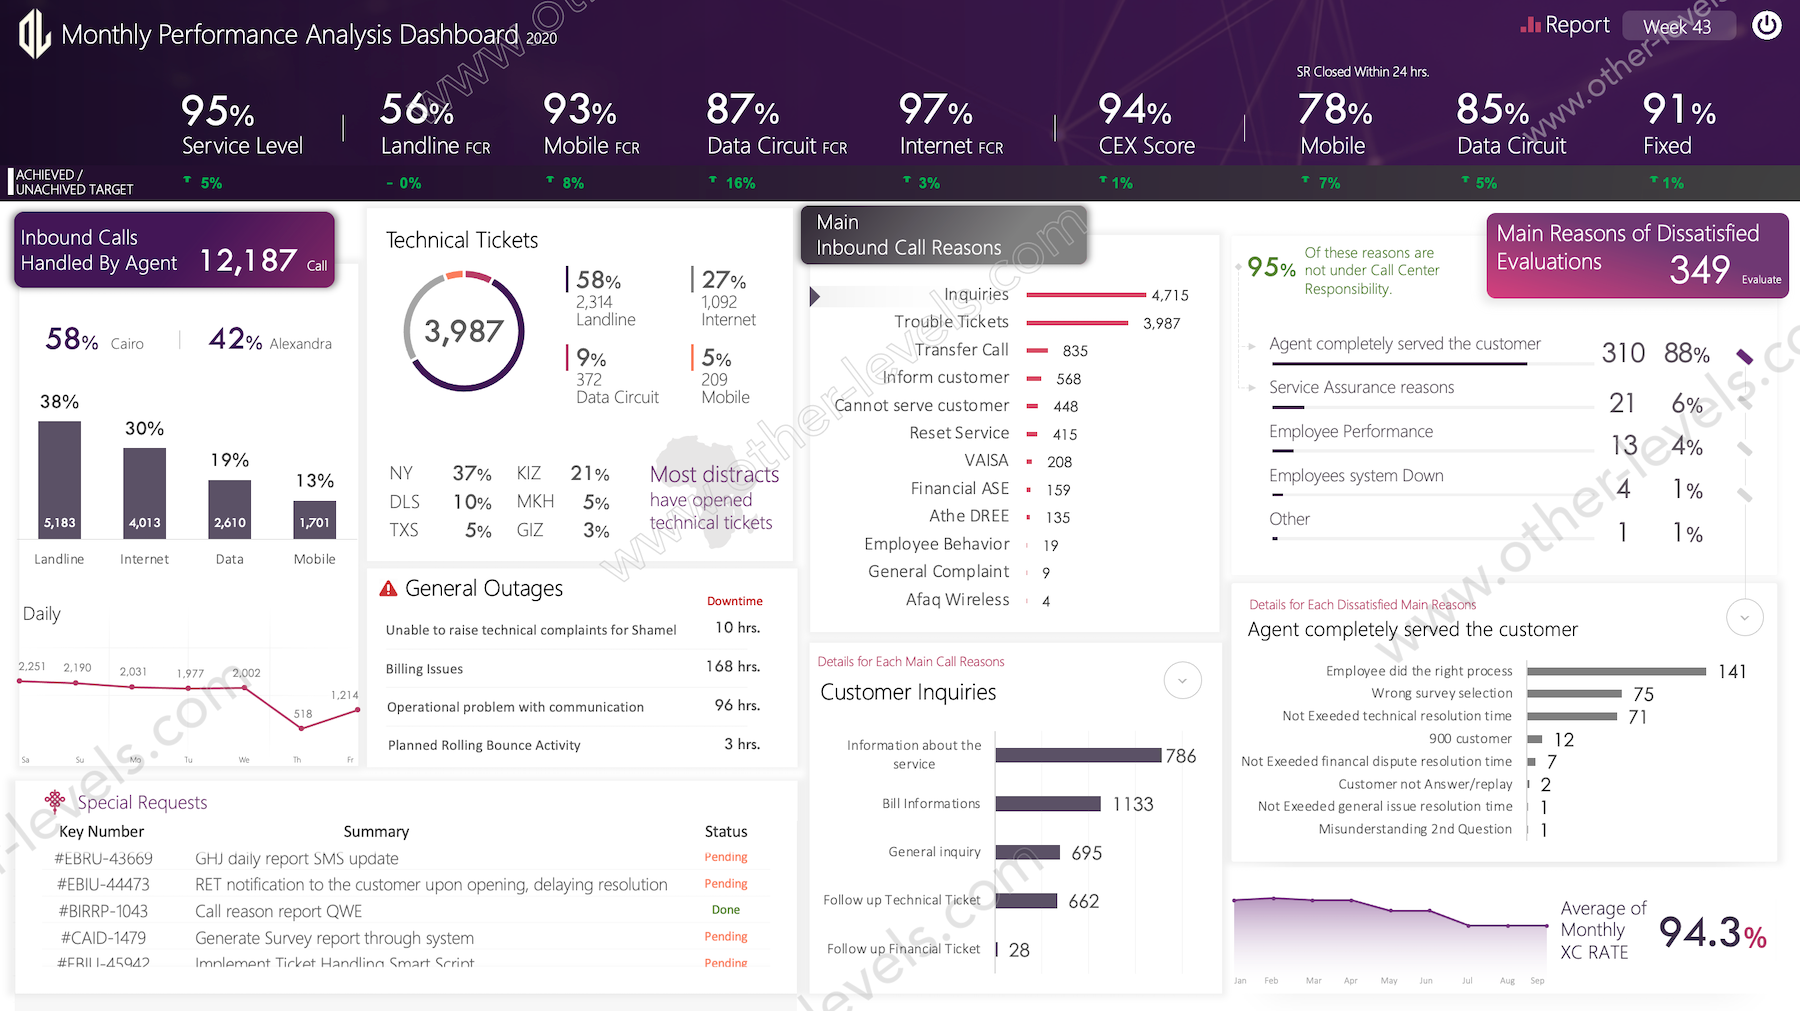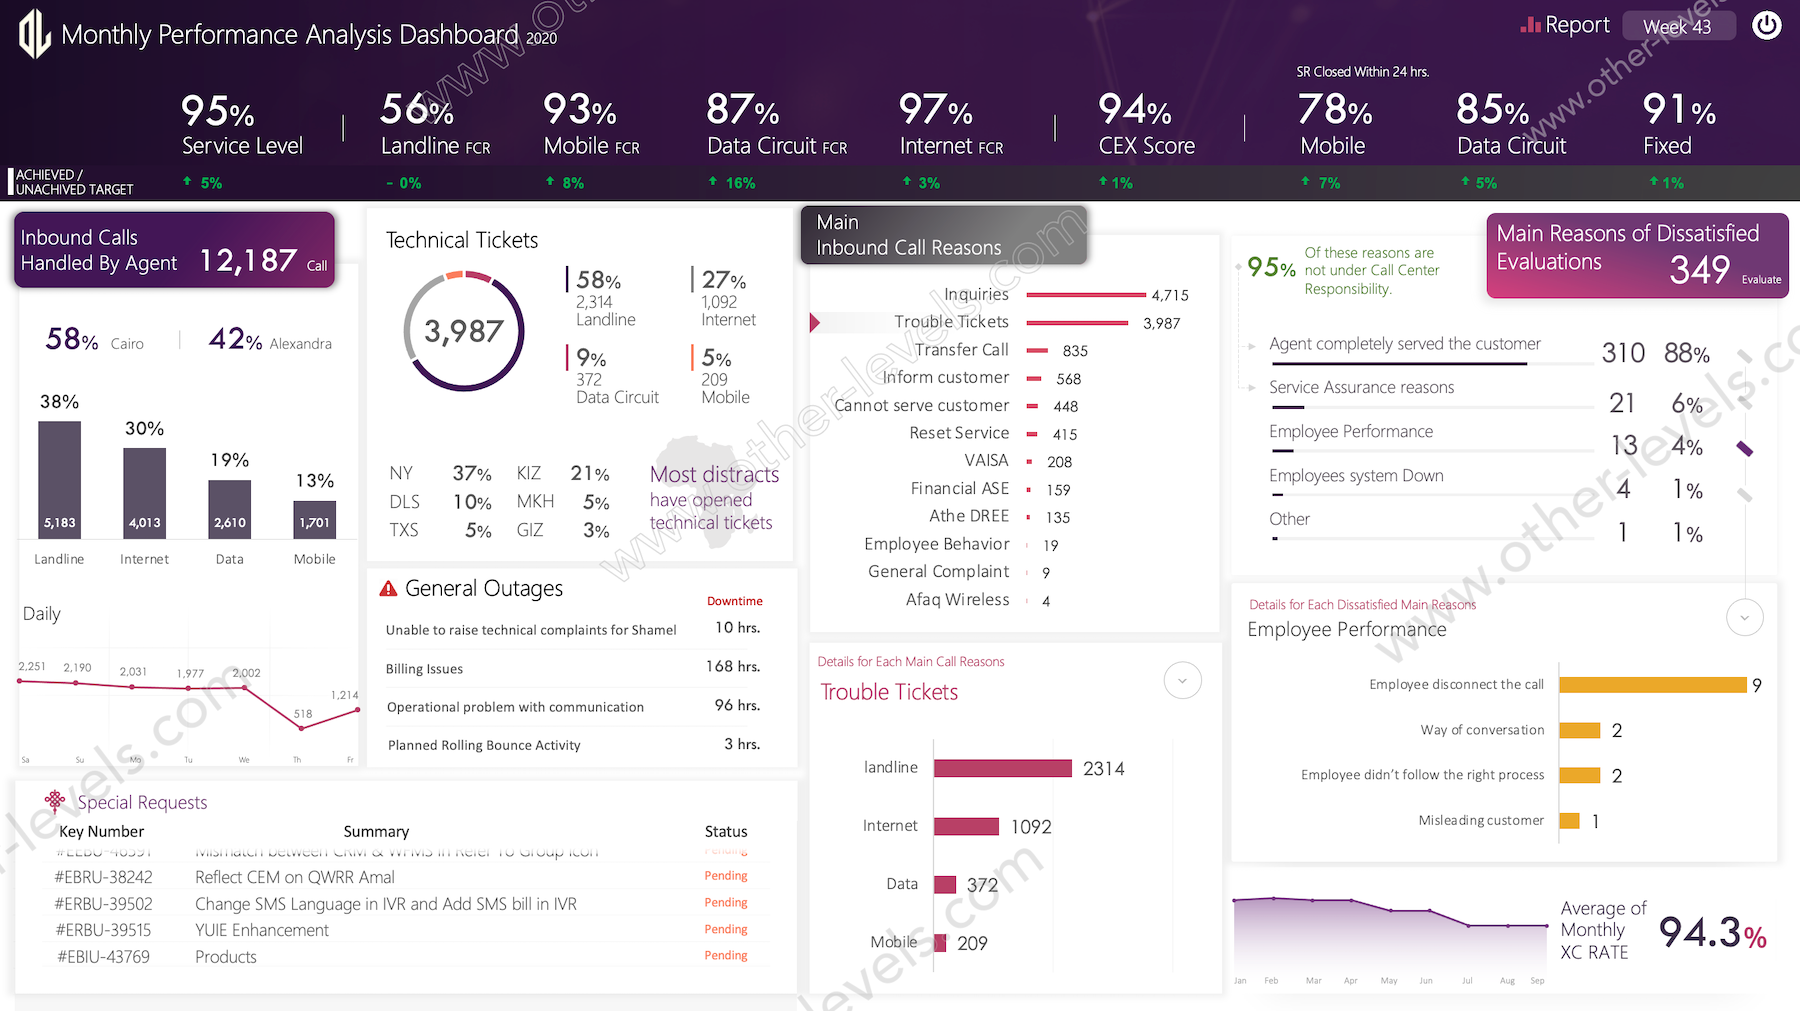


Sales Performance Metrics Dashboard - Dark Theme Excel Analytics
Pairs well with

Sales Performance Metrics Dashboard - Dark Theme Excel Analytics
Sales Performance Metrics Dashboard - Dark Theme Excel Analytics
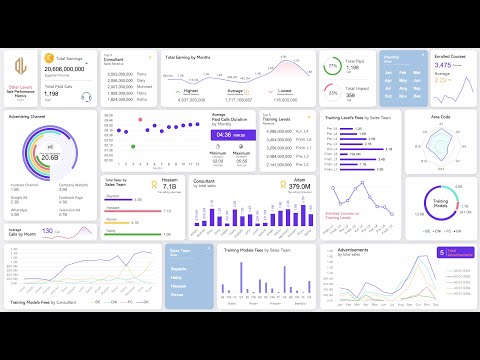
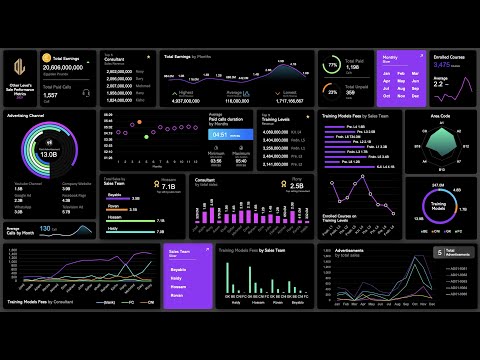
Boost your business insights with the Sales Performance Metrics Dashboard - Dark Theme, a professional Excel Dashboard designed by Other Levels. This visually striking dashboard provides a comprehensive view of your sales data, enabling precise decision-making and performance tracking.
Comprehensive Sales Analysis
Gain valuable insights into your sales performance with metrics such as Total Earnings, Top Consultant Sales Revenue, and Monthly Revenue Trends. Highlight key performance areas, including the Highest, Lowest, and Average Monthly Revenues, ensuring you can track success and address underperformance effectively.
Advanced Filtering and Visuals
With built-in slicers for Sales Team, Training Models, and Monthly Sales, this dashboard offers dynamic data exploration for actionable insights. Track revenue contributions from Advertisement Campaigns and breakdowns of sales by Area Codes, enabling targeted strategies.
Key Metrics for Business Growth
Analyze data at a granular level with metrics like Total Paid and Unpaid Calls, Training Models Fees, and Top Consultant Contributions. Visualize Advertising Spend by Channels and assess their ROI, ensuring optimized marketing strategies. The dashboard also highlights the Top Performing Sales Teams, fostering a competitive and results-driven environment.
Sleek Dark Theme Design
The Dark Theme enhances data readability while offering a modern, professional look suitable for presentations and reporting. This dashboard is perfect for businesses seeking a seamless blend of functionality and aesthetics.
Customizable and User-Friendly
Adapt the dashboard to fit your unique sales processes. Whether for consultants, sales teams, or marketing managers, this tool simplifies complex data into actionable insights.
Revolutionize your sales tracking and performance evaluation with the Sales Performance Metrics Dashboard - Dark Theme from Other Levels.
Key Features
- Total Earnings and total Paid Calls
- Top 5 Consultant Sales Revenue
- Total Earnings by Months and highlights for the Highest, Lowest, and average Month Revenue
- Count and percentage of Total Paid and Unpaid Calls
- Monthly Slicer
- Enrolled Courses and the Average
- Sales per Area Codes
- Training Models Fees by Sales Team
- Total Enrolled Courses by Training Levels
- Top 5 Training Levels
- Average Paid calls duration by months, showing the Minimum and the Maximum call duration
- Advertising Spend Broken Down by Channels,
- Average Calls by Month
- Total Sales By Sales Team and highlight for the Top Sales Team name and their revenue
- Consultants By Total Sales, and highlight for the Top Consultant name and their revenue
- Revenue Broken Down By Training Models
- Advertisement campaigns by total sales
- Training Models Fees By Sales Team
- Slicer for Sales team
- Training Models Fees By Consultant
Template Features
Package Details
Software Compatibility
Skill Level Required
Intermediate
FAQs
Please read our FAQs page to find out more.
Are the templates fully customizable?
Yes, all our templates are fully customizable. You can adjust the layout, data, and design elements to fit your specific needs. Our templates are designed to be flexible, allowing you to easily tailor them to your preferences.
Can I order a product in any language?
Yes, we provide products in any language. Simply select the "Other Language" option from the product options during your purchase. Once your order is placed, you will receive it within 48 hours.
What happens if I choose the wrong monitor screen size for my dashboard?
If you choose the wrong screen size, the dashboard may not display correctly on your monitor. Elements could appear too large, too small, or misaligned, affecting the readability and usability of the dashboard. We recommend selecting the appropriate screen size to ensure optimal viewing and performance.
Do I need any specific skills to use the dashboards?
Yes, to effectively use our advanced Excel dashboards, you must have at least a basic understanding of PivotTables. This will help you customize and analyze the data efficiently.
Do you provide services to add our own data to the purchased templates?
No, we do not offer services to input your specific data into the purchased templates. The templates are fully customizable, allowing you to easily add your own data.
Do I need specific skills to use the advanced Excel dashboard templates?
Our advanced Excel dashboards are easy to use, the only thing you need to know is how to work with PivotTables. With basic knowledge of PivotTables, you'll be able to customize and fully utilize these templates effortlessly. "Please check the skill level required"
Can I showcase these templates on websites or online platforms?
No, it is against our copyright policy to showcase these templates on websites, social media, or any online platforms. The templates are for your personal use only and are not permitted for public display or distribution.
Business Templates
Shop the Analytical Look
Services Requests Management Power BI Dashboard Template
Project Status Tracking Excel Dashboard
Comprehensive Project Management Performance Excel Dashboard
Interactive Call Center PowerPoint Dashboard


