

Excel Dashboards Templates
Finance Status & Forecasting Excel Dashboard – Dynamic Data Insights
Pairs well with

Finance Status & Forecasting Excel Dashboard – Dynamic Data Insights
Finance Status & Forecasting Excel Dashboard – Dynamic Data Insights
Take control of your financial insights with the Finance Status and Forecasting Excel Dashboard, an innovative tool tailored to meet modern business needs. This versatile Excel Dashboard combines advanced data analytics with a user-friendly interface, empowering professionals to assess their financial status and create accurate forecasts with ease.
Key features include seamless data import/export capabilities, allowing integration with your existing workflows. The dashboard's customizable interface ensures that users can adapt it to match their specific requirements, while the Full HD wide-screen view enhances the clarity and detail of the data visuals.
Stay ahead with dynamic data analysis tools that provide actionable insights. Whether you're forecasting revenue, monitoring cash flow, or evaluating budget allocations, this dashboard makes financial decision-making faster and more precise. The mobile access and multi-user support ensure that teams can collaborate effectively, whether in-office or on the go.
For beginners and seasoned users alike, a dedicated YouTube video tutorial simplifies the onboarding process, guiding you through the dashboard’s functionality. Enhanced privacy protection and offline access provide added security and reliability for all users.
This Excel Dashboard is ideal for financial analysts, business owners, and decision-makers looking to streamline their financial reporting and forecasting processes. The included free fonts and icons allow for effortless presentation customizations, while preview images offer a sneak peek into its sleek design.
Choose the Finance Status and Forecasting Excel Dashboard from Other Levels and revolutionize the way you track and project financial performance.
Key Features
- Yearly Financial Overview: Track expenses, profits, and losses with detailed year-over-year reports.
- Liberation & Available Metrics: Monitor financial commitments and remaining funds with percentages.
- Target vs. Actual Insights: Compare expenses by domain and location using column and line charts, highlighting performance gaps.
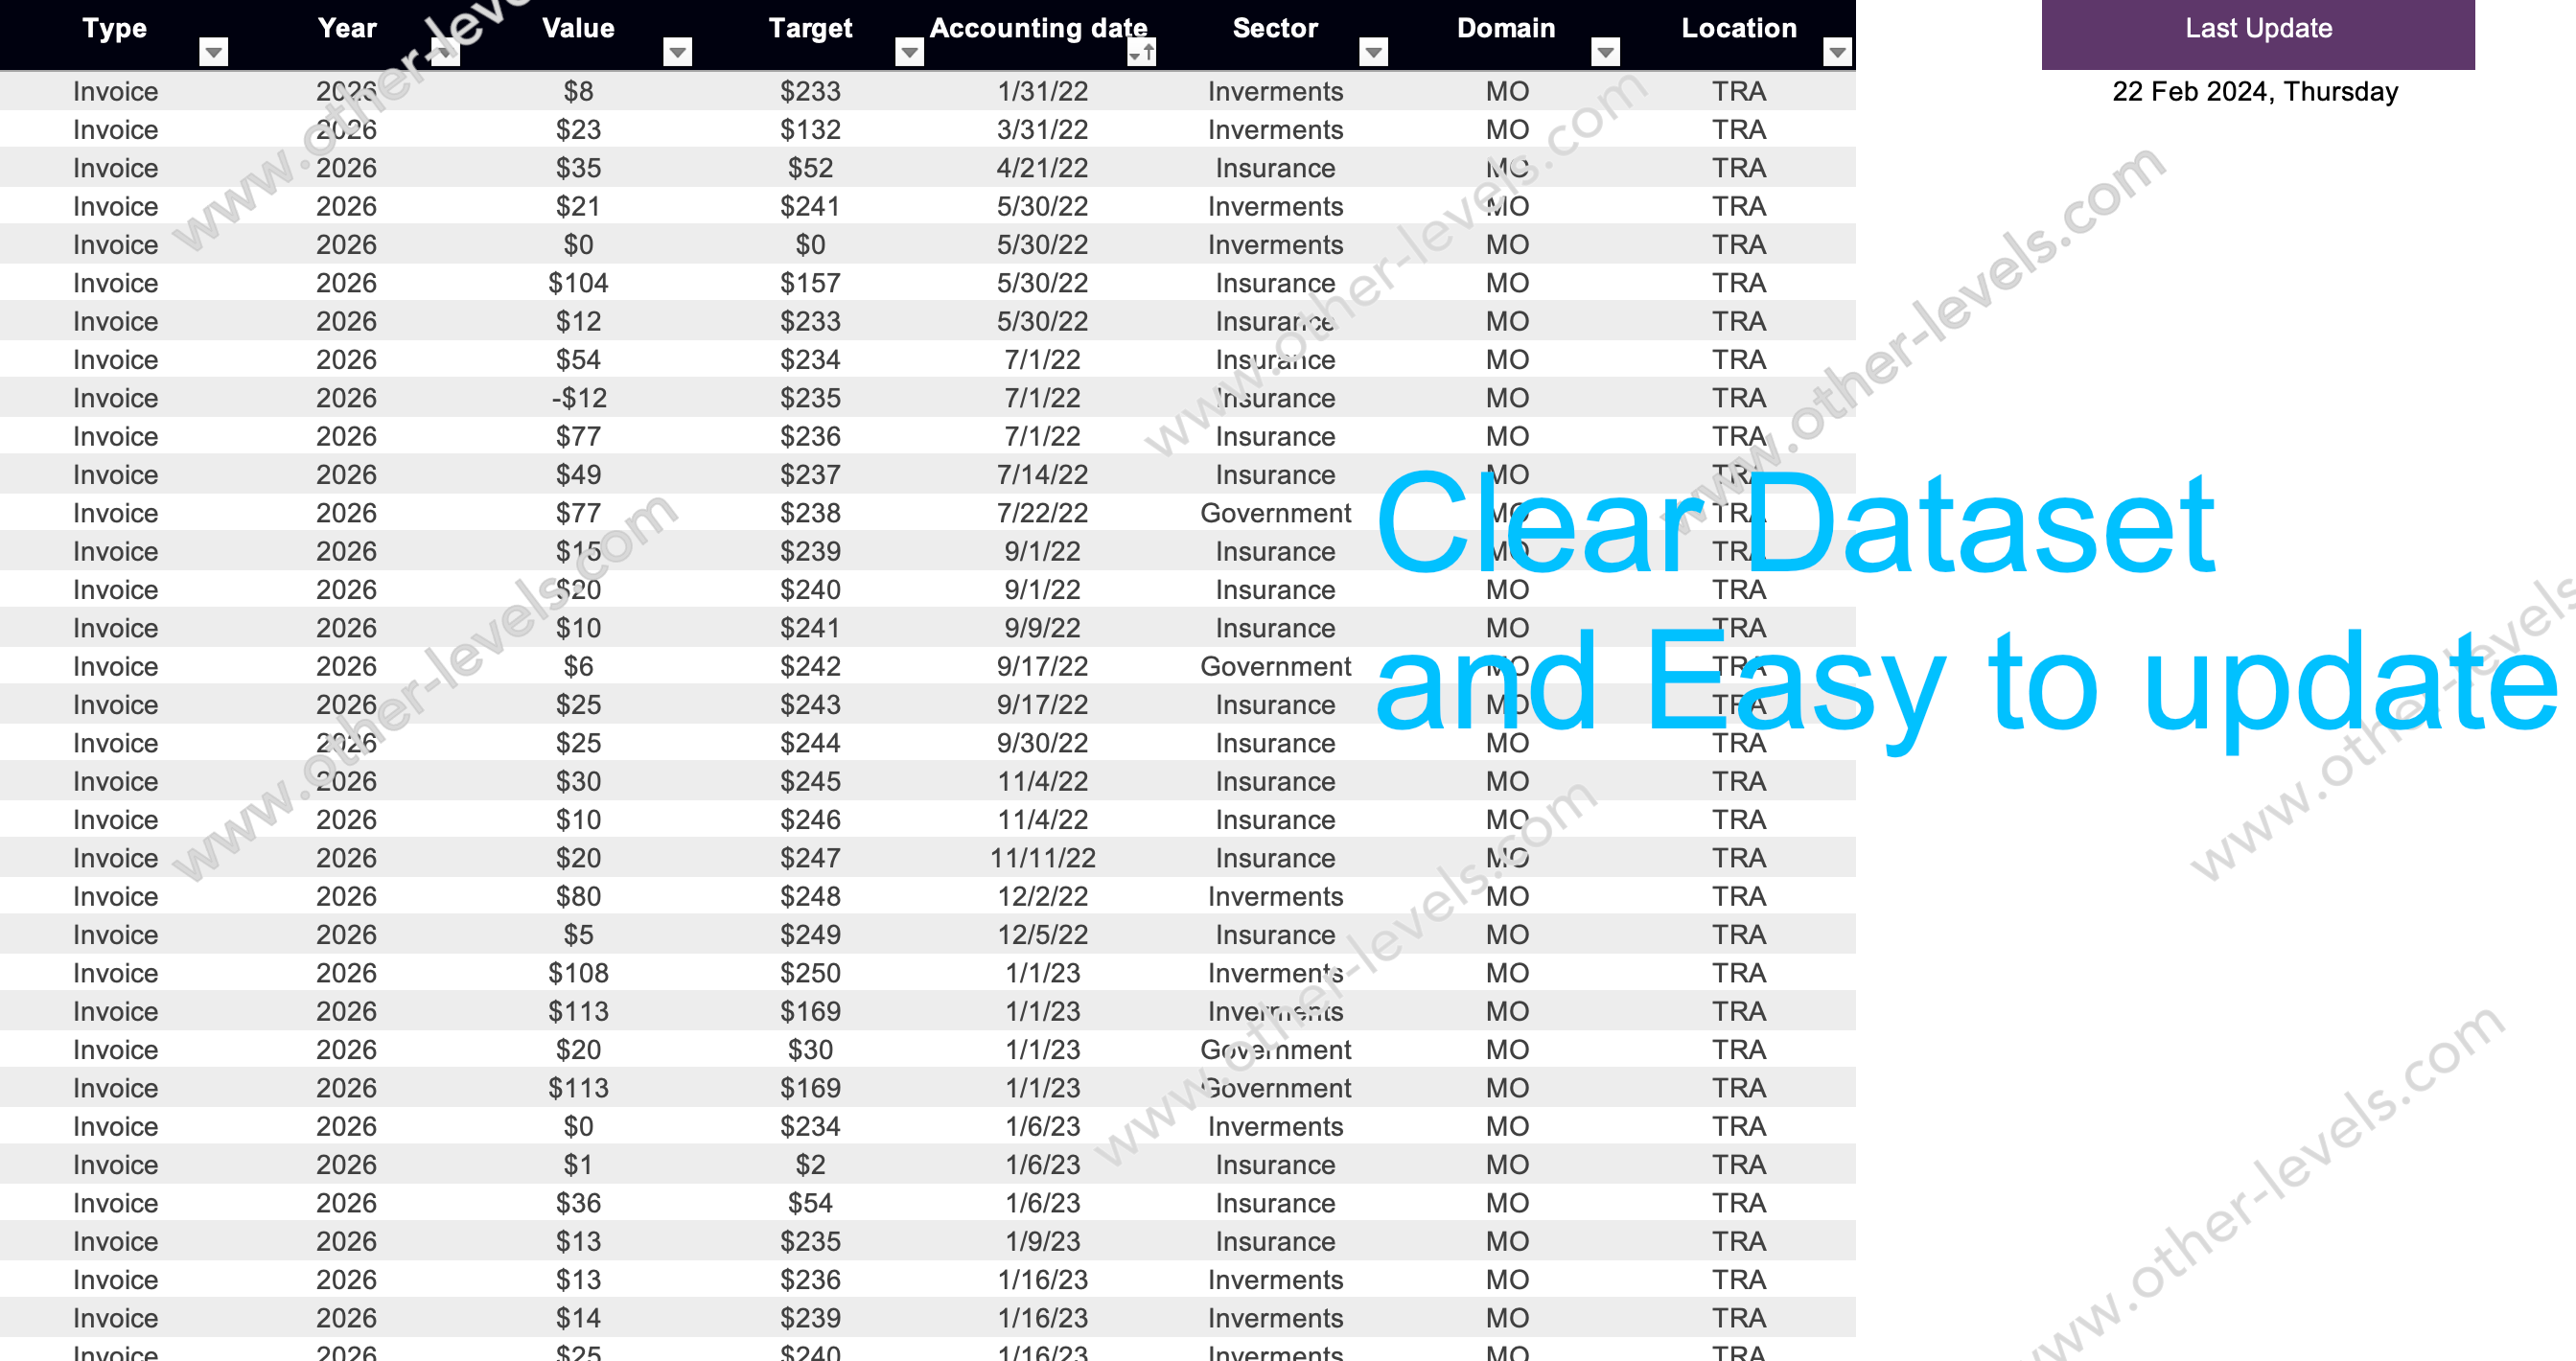
- Invoices & Contracts Analysis: Visualize invoice trends and contract percentages for streamlined financial tracking.
- Interactive Filters: Analyze data by year, location, and sector for tailored insights.
This dashboard delivers clear visuals, actionable insights, and customizable filtering for smarter decision-making.
Template Features
Package Details
Software Compatibility
Skill Level Required
Intermediate
FAQs
Please read our FAQs page to find out more.
Are the templates fully customizable?
Yes, all our templates are fully customizable. You can adjust the layout, data, and design elements to fit your specific needs. Our templates are designed to be flexible, allowing you to easily tailor them to your preferences.
Can I order a product in any language?
Yes, we provide products in any language. Simply select the "Other Language" option from the product options during your purchase. Once your order is placed, you will receive it within 48 hours.
What happens if I choose the wrong monitor screen size for my dashboard?
If you choose the wrong screen size, the dashboard may not display correctly on your monitor. Elements could appear too large, too small, or misaligned, affecting the readability and usability of the dashboard. We recommend selecting the appropriate screen size to ensure optimal viewing and performance.
Do I need any specific skills to use the dashboards?
Yes, to effectively use our advanced Excel dashboards, you must have at least a basic understanding of PivotTables. This will help you customize and analyze the data efficiently.
Do you provide services to add our own data to the purchased templates?
No, we do not offer services to input your specific data into the purchased templates. The templates are fully customizable, allowing you to easily add your own data.
Do I need specific skills to use the advanced Excel dashboard templates?
Our advanced Excel dashboards are easy to use, the only thing you need to know is how to work with PivotTables. With basic knowledge of PivotTables, you'll be able to customize and fully utilize these templates effortlessly. "Please check the skill level required"
Can I showcase these templates on websites or online platforms?
No, it is against our copyright policy to showcase these templates on websites, social media, or any online platforms. The templates are for your personal use only and are not permitted for public display or distribution.
Business Templates
Shop the Analytical Look
Services Requests Management Power BI Dashboard Template
Project Status Tracking Excel Dashboard
Comprehensive Project Management Performance Excel Dashboard
Interactive Call Center PowerPoint Dashboard


