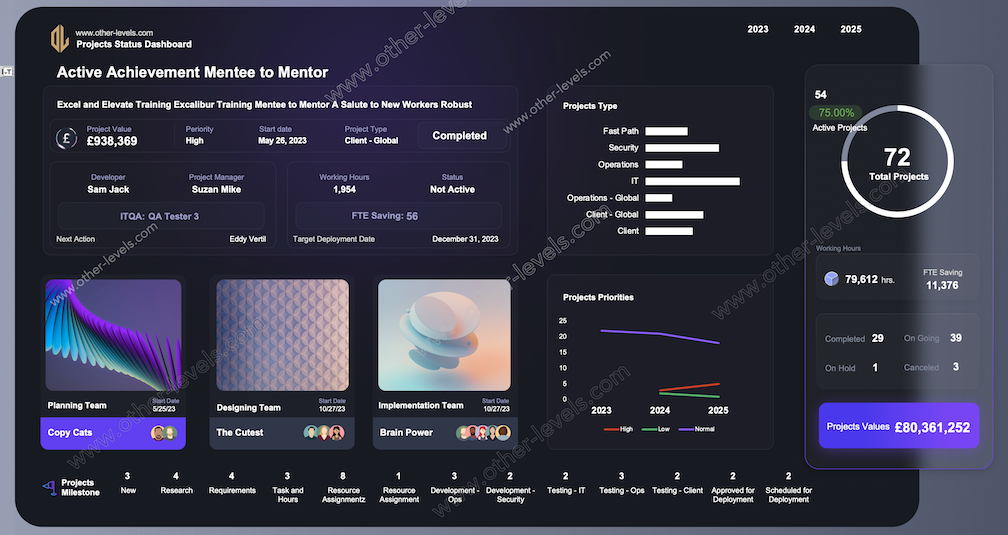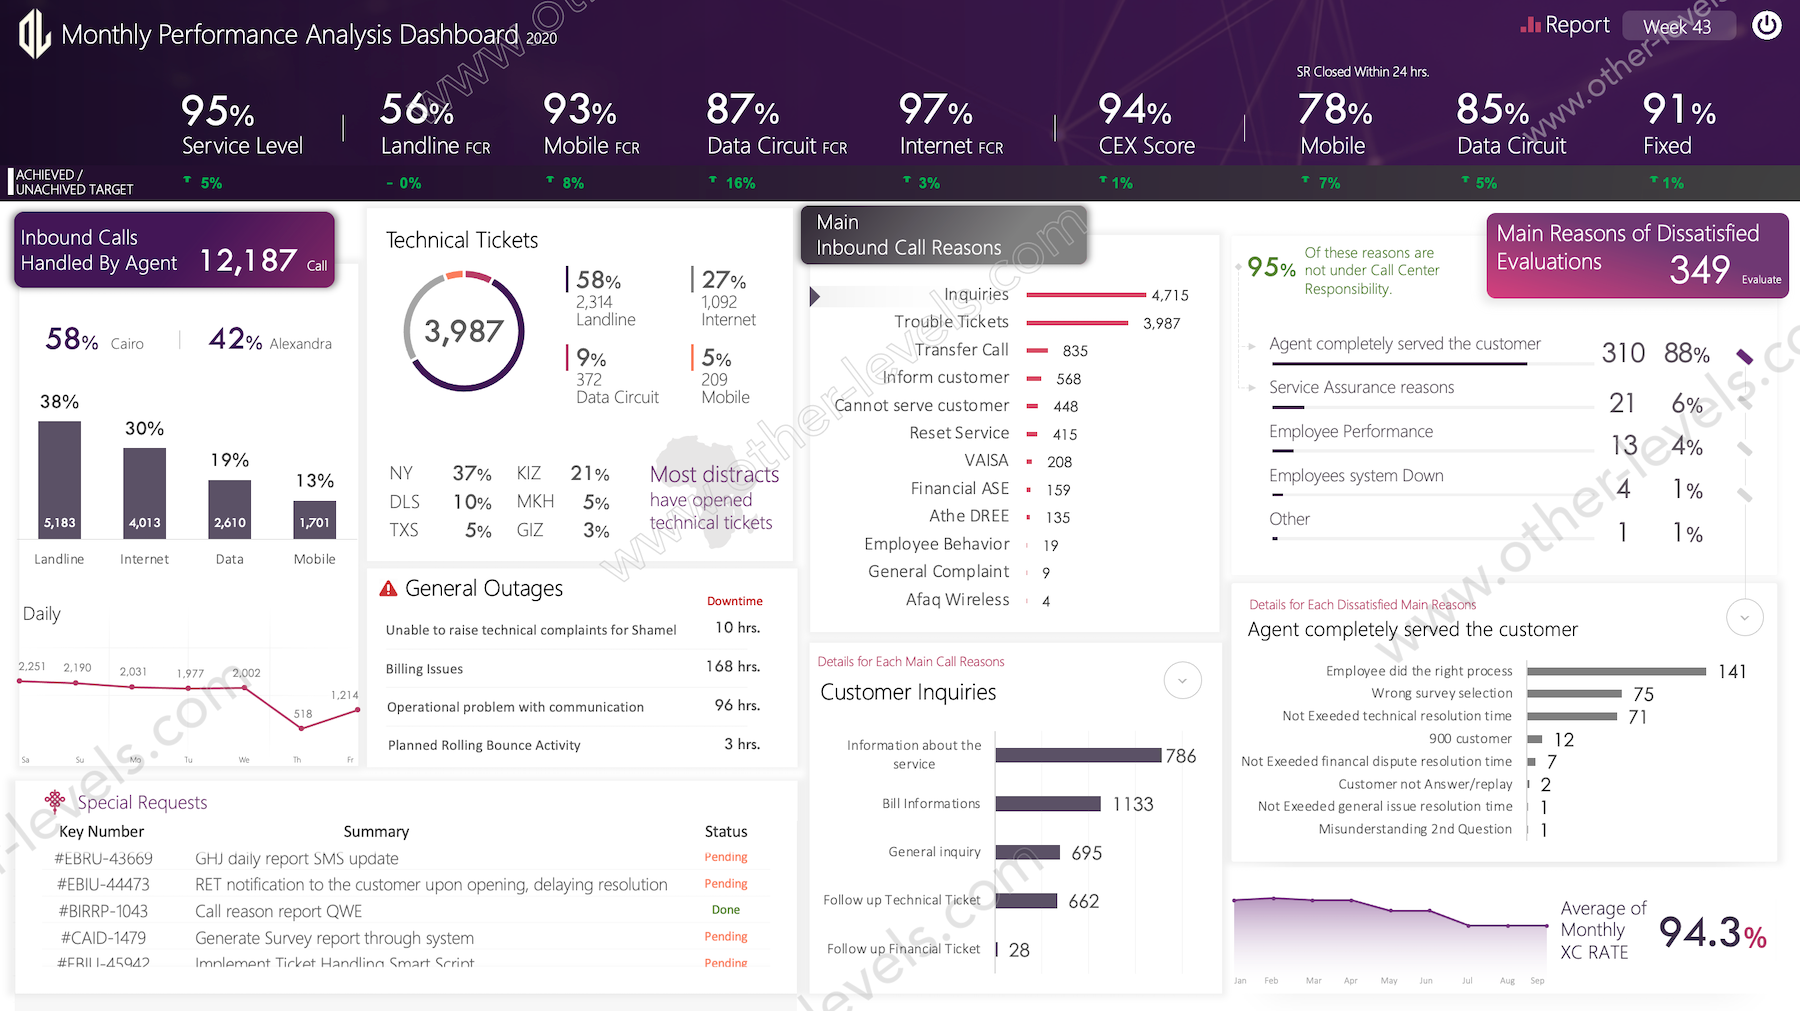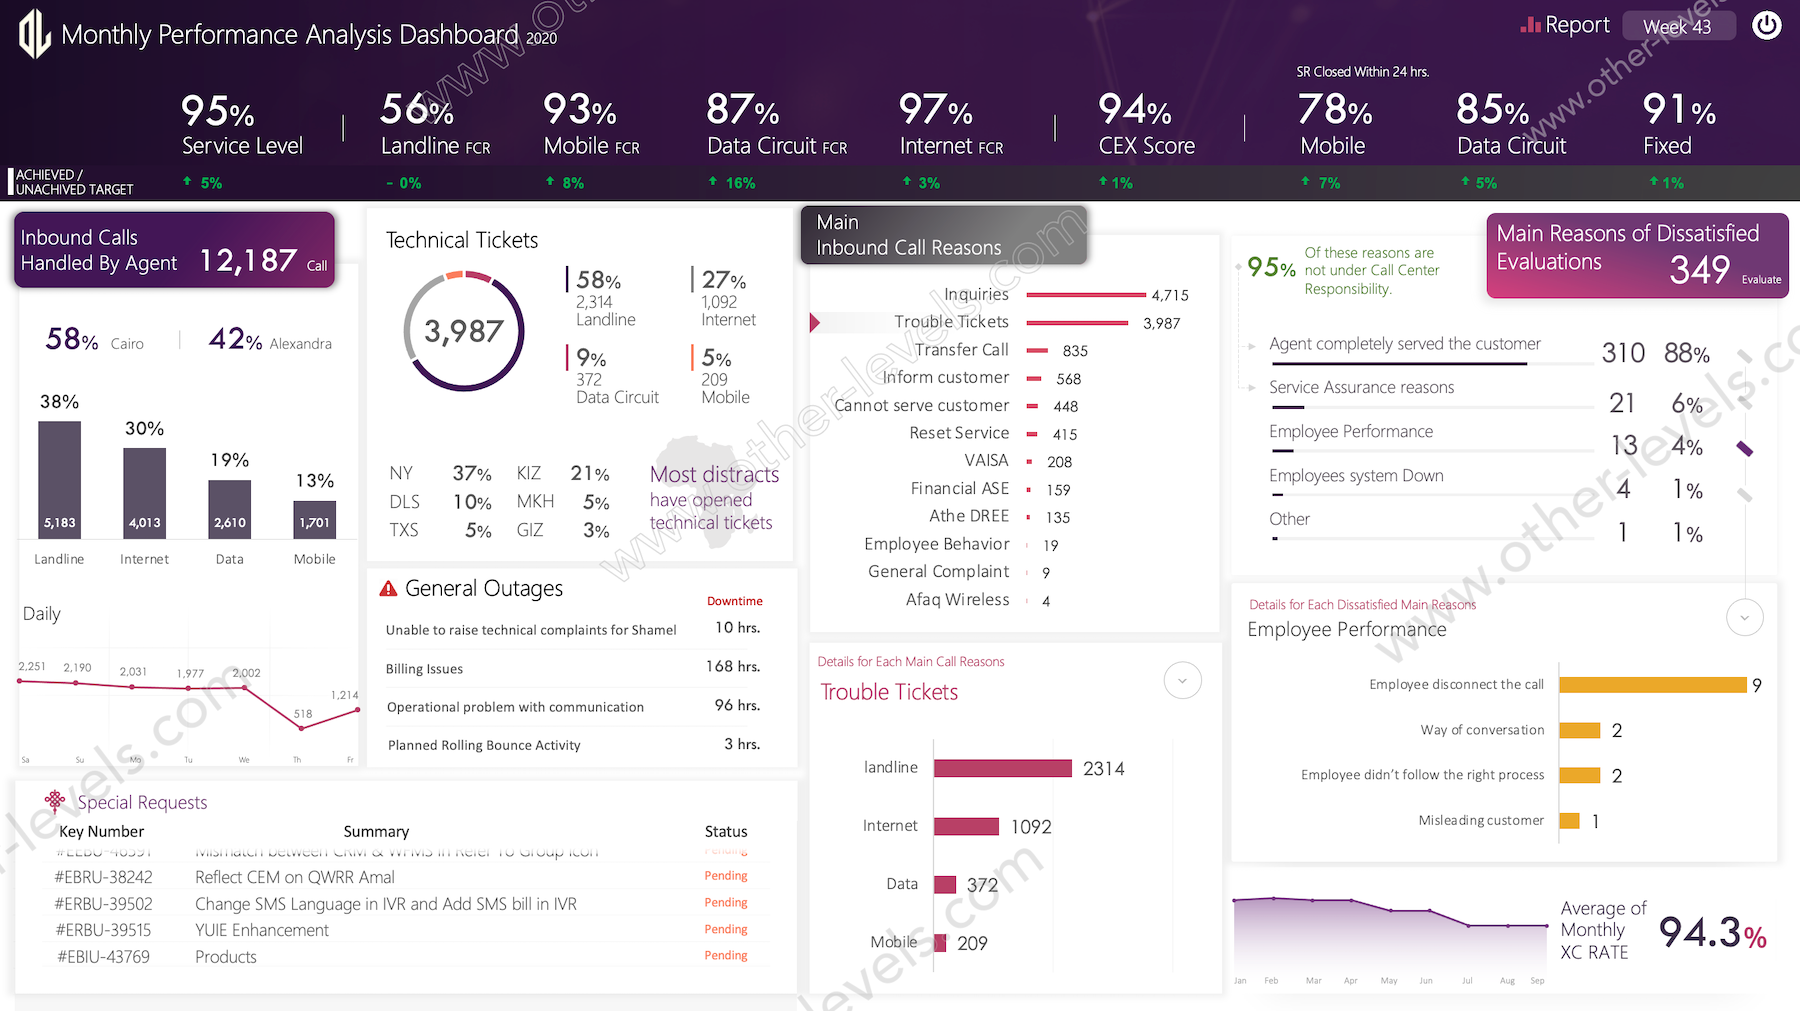


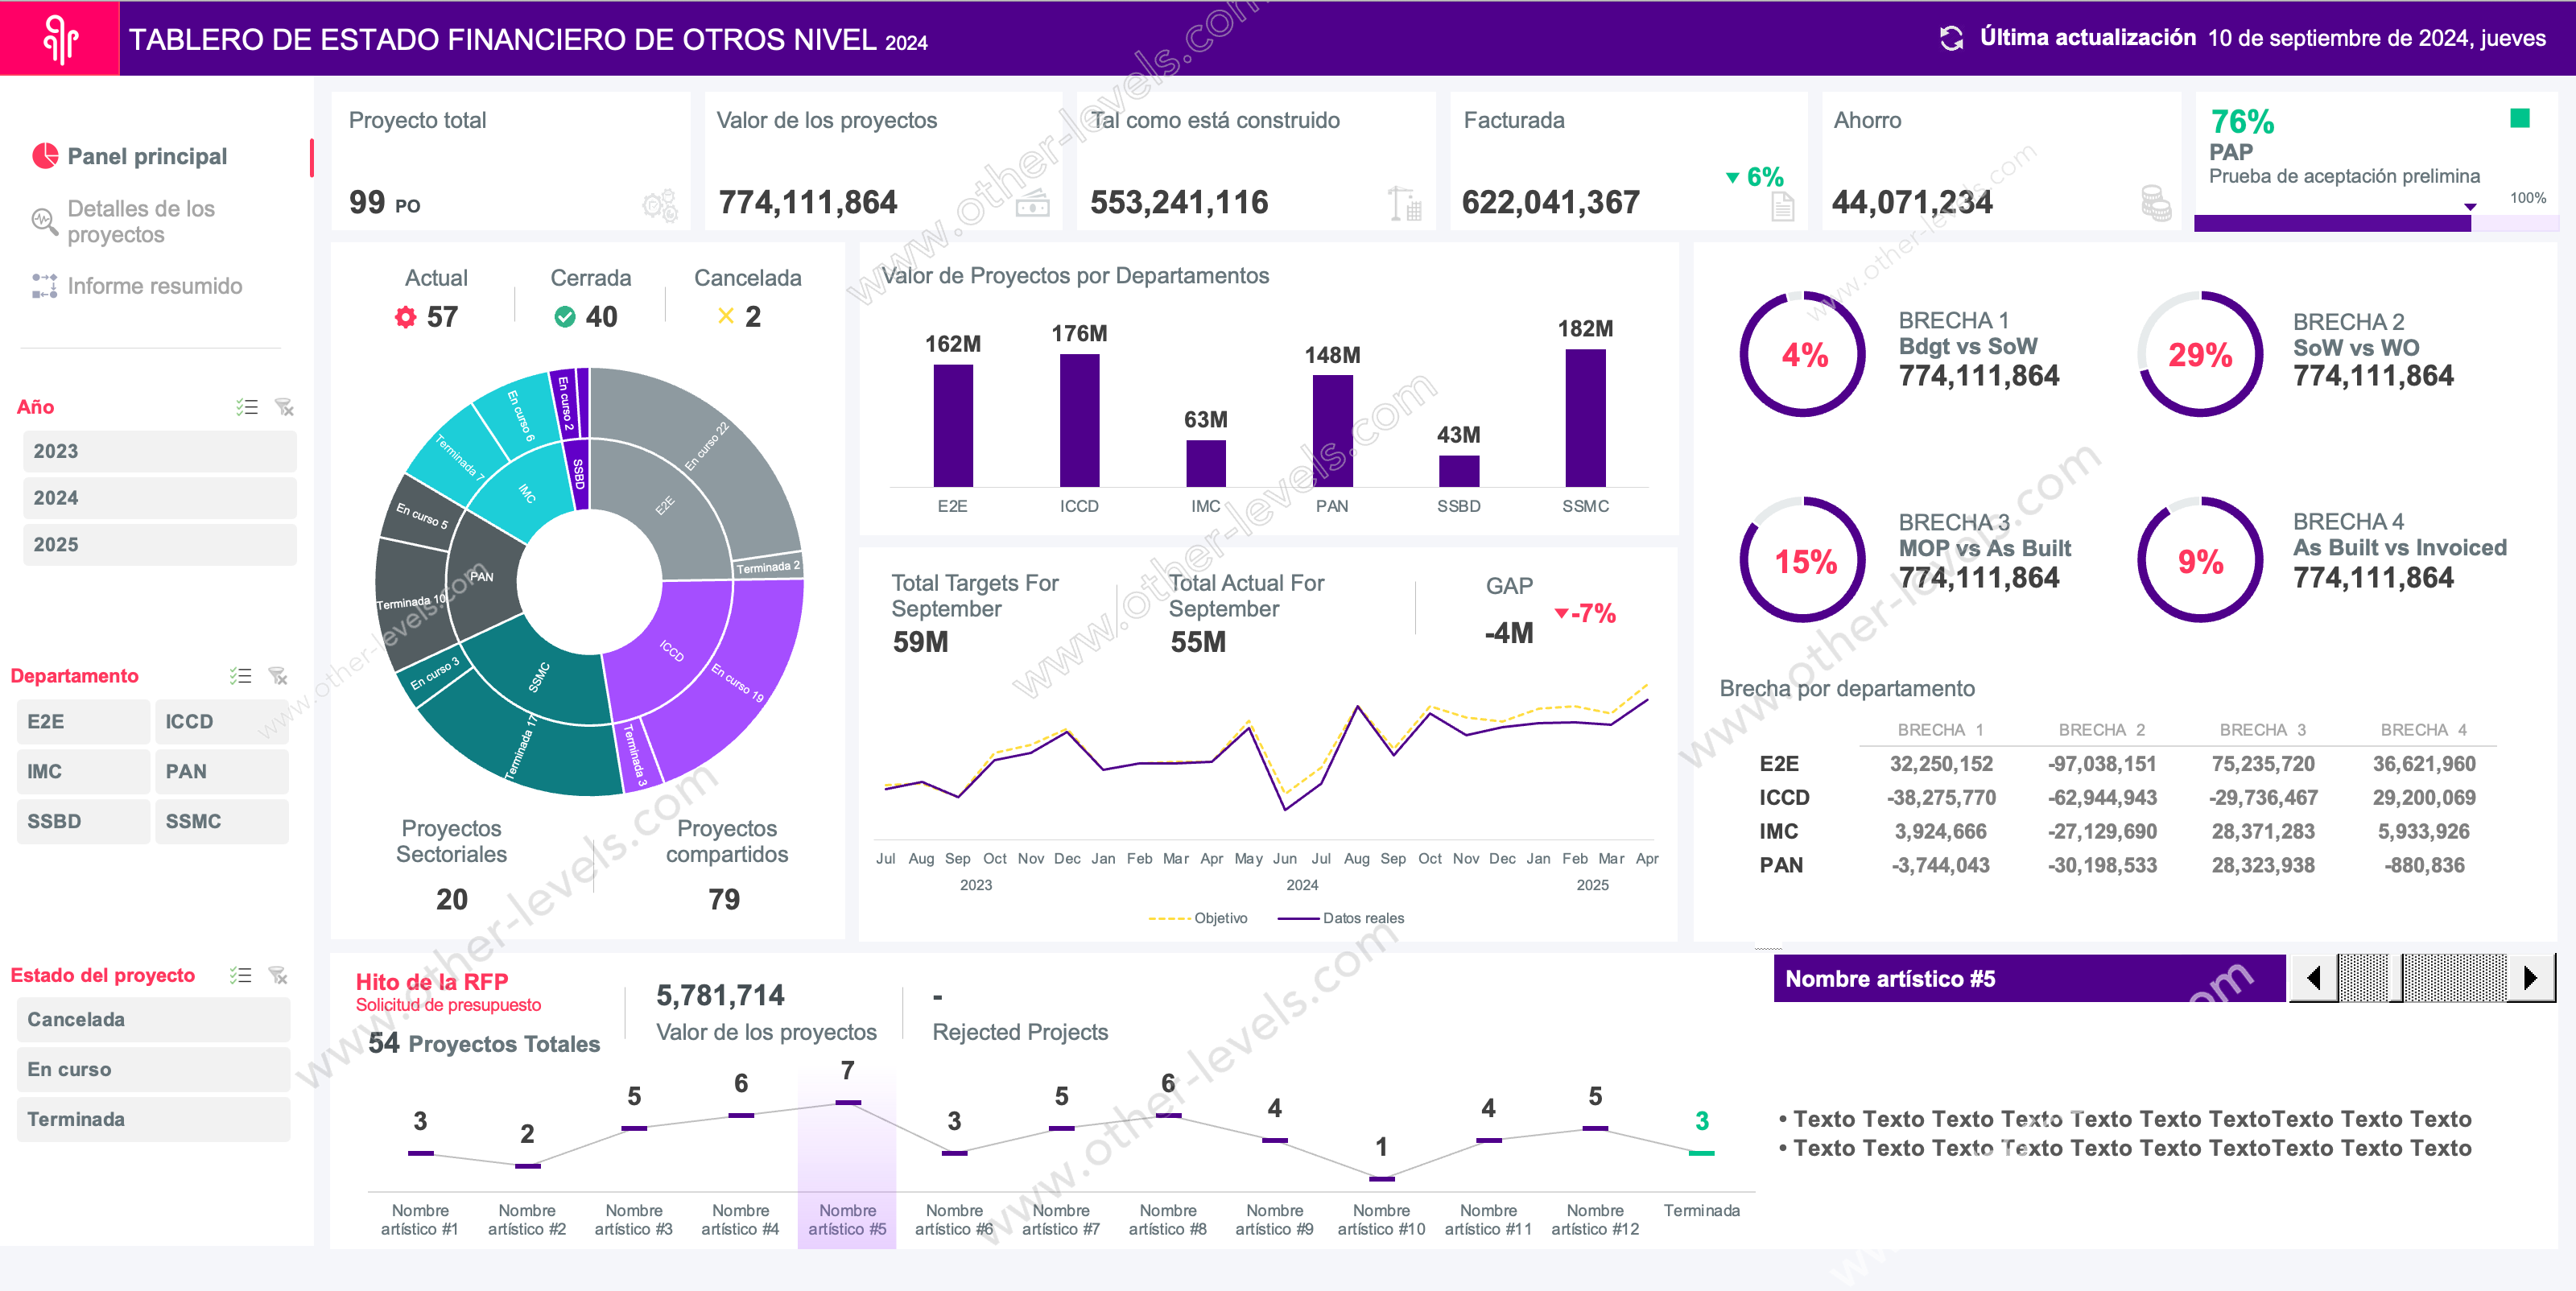
Dynamic & Interactive Dashboard - Finance Status & Projects Milestone
Pairs well with

Dynamic & Interactive Dashboard - Finance Status & Projects Milestone
Dynamic & Interactive Dashboard - Finance Status & Projects Milestone
One of the Most Successful and Powerful Excel Dashboards on YouTube
+5 Million views
Elevate your financial and project management processes with the Dynamic & Interactive Finance and Project Milestone Dashboard, a powerful Excel Dashboard designed to simplify decision-making. Perfect for organizations managing multiple projects, this tool provides dynamic, real-time insights into financial performance and project progress.
This advanced dashboard is equipped with interactive slicers for seamless filtering by year, department, and project status, allowing you to customize views and focus on the data that matters most. Analyze financial status metrics such as project value, as-built costs, budget savings, and PAT/GAP with ease. Whether tracking current, completed, or canceled projects, the dashboard ensures complete visibility at every stage.
Tailored for teams and professionals who need accurate, actionable insights, this Excel Dashboard enables you to align project milestones with financial performance. Gain an overview of total projects and monitor critical metrics like submissions, relationships, and departmental contributions.
Its intuitive design and interactive visuals provide clarity, making it simple to present and share critical updates with stakeholders. Whether managing resources, tracking financial goals, or evaluating project outcomes, this dashboard delivers precise, consolidated insights.
The Dynamic & Interactive Finance and Project Milestone Dashboard is the ultimate tool for organizations seeking a competitive edge in project and financial management. With its flexibility and robust analytics, it’s the perfect solution to keep projects on track and finances optimized.
Choose the Dynamic & Interactive Finance and Project Milestone Dashboard by Other Levels to experience the future of streamlined financial and project tracking.
Key Features
- All below Analysis connected with 3 Slicers
- Yearly Slicer
- Departments Slicer
- Project Status
Totals of
- Total Project's
- Projects Value
- As Built Cost
- Submitted Value
- Budget Saving
- Total PAT / GAP
- Current Projects
- Closed Projects
- Canceled Projects
- Projects by Relating to
Sunburst Chart analysis Projects status by departments
Budget / Issued by Departments
Line chart Showing the GAP between Target and the actual amounts by months
- Current target and current Actual
- Dynamic texts changing depend on slicer selections
- GAP amount and the present age
Four Gaps Analysis
- GAP 1 between Budget vs. Scoop of work
- GAP 2 between Scoop of work vs. Work Orders
- GAP 3 between MOP vs. As Built
- GAP 4 between Invoiced vs. As Built
Table showing total Gaps per department
- Controlled by Business types slicer
- Project Values by Business Type
- Projects by Business Types
- Four doughnut charts and numbers for Gaps
Projects Milestone status
Creative Line chart showing total projects by milestone stage name,
connected with a scrolled bar to highlight selected stage name,
and showing milestone update/ details dynamically,
Connected with the Business type's slicer.
Second dashboard (Status Report):
Showing the most important values in details view using creative Pivot tables,
connected with three slicers:
- Yearly Slicer
- Departments Slicer
- Project Status
Third Sheet tab:
Blank page ready to use with the same dashboard overall theme appearance connected with hyperlink button, you can add any type of analysis
Five sheet tabs:
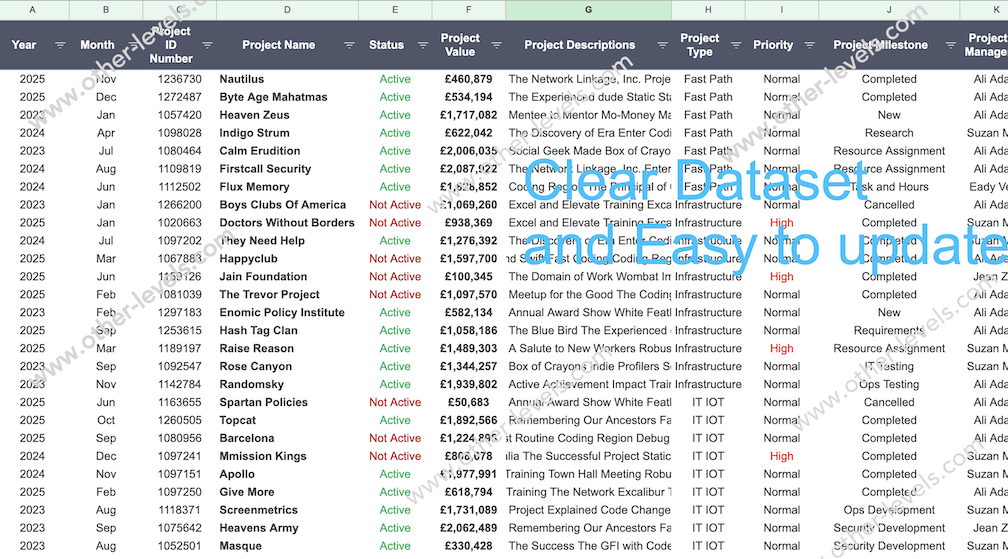
- Database tables (Two Tables)
- Pivot tables and formulas
- Main Dashboard
- Status Report
- Blank sheet ready to use
Template Features
Package Details
Software Compatibility
Skill Level Required
Intermediate
FAQs
Please read our FAQs page to find out more.
Are the templates fully customizable?
Yes, all our templates are fully customizable. You can adjust the layout, data, and design elements to fit your specific needs. Our templates are designed to be flexible, allowing you to easily tailor them to your preferences.
Can I order a product in any language?
Yes, we provide products in any language. Simply select the "Other Language" option from the product options during your purchase. Once your order is placed, you will receive it within 48 hours.
What happens if I choose the wrong monitor screen size for my dashboard?
If you choose the wrong screen size, the dashboard may not display correctly on your monitor. Elements could appear too large, too small, or misaligned, affecting the readability and usability of the dashboard. We recommend selecting the appropriate screen size to ensure optimal viewing and performance.
Do I need any specific skills to use the dashboards?
Yes, to effectively use our advanced Excel dashboards, you must have at least a basic understanding of PivotTables. This will help you customize and analyze the data efficiently.
Do you provide services to add our own data to the purchased templates?
No, we do not offer services to input your specific data into the purchased templates. The templates are fully customizable, allowing you to easily add your own data.
Do I need specific skills to use the advanced Excel dashboard templates?
Our advanced Excel dashboards are easy to use, the only thing you need to know is how to work with PivotTables. With basic knowledge of PivotTables, you'll be able to customize and fully utilize these templates effortlessly. "Please check the skill level required"
Can I showcase these templates on websites or online platforms?
No, it is against our copyright policy to showcase these templates on websites, social media, or any online platforms. The templates are for your personal use only and are not permitted for public display or distribution.
Business Templates
Shop the Analytical Look
Services Requests Management Power BI Dashboard Template
Project Status Tracking Excel Dashboard
Comprehensive Project Management Performance Excel Dashboard
Interactive Call Center PowerPoint Dashboard


