

Excel Weekly, Monthly, and Annual Report Dashboard
Pairs well with

Excel Weekly, Monthly, and Annual Report Dashboard
Excel Weekly, Monthly, and Annual Report Dashboard
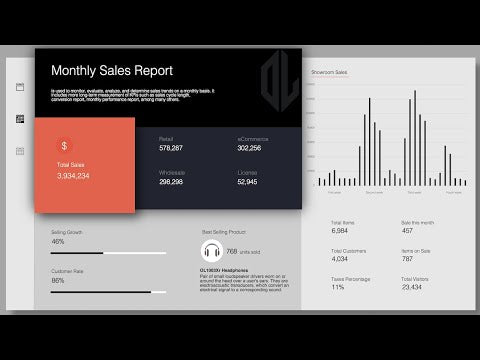
Simplify your reporting process with the Excel Weekly, Monthly, and Annual Report Dashboard from Other Levels. This dynamic and customizable tool provides a streamlined solution for tracking performance metrics and presenting key data across different timeframes.
Comprehensive Reporting Features
This dashboard offers three dedicated reports—weekly, monthly, and annual—providing a structured approach to analyzing performance trends. The layout includes space for your report title and description, ensuring clarity and context for all stakeholders.
Data Visualization Made Simple
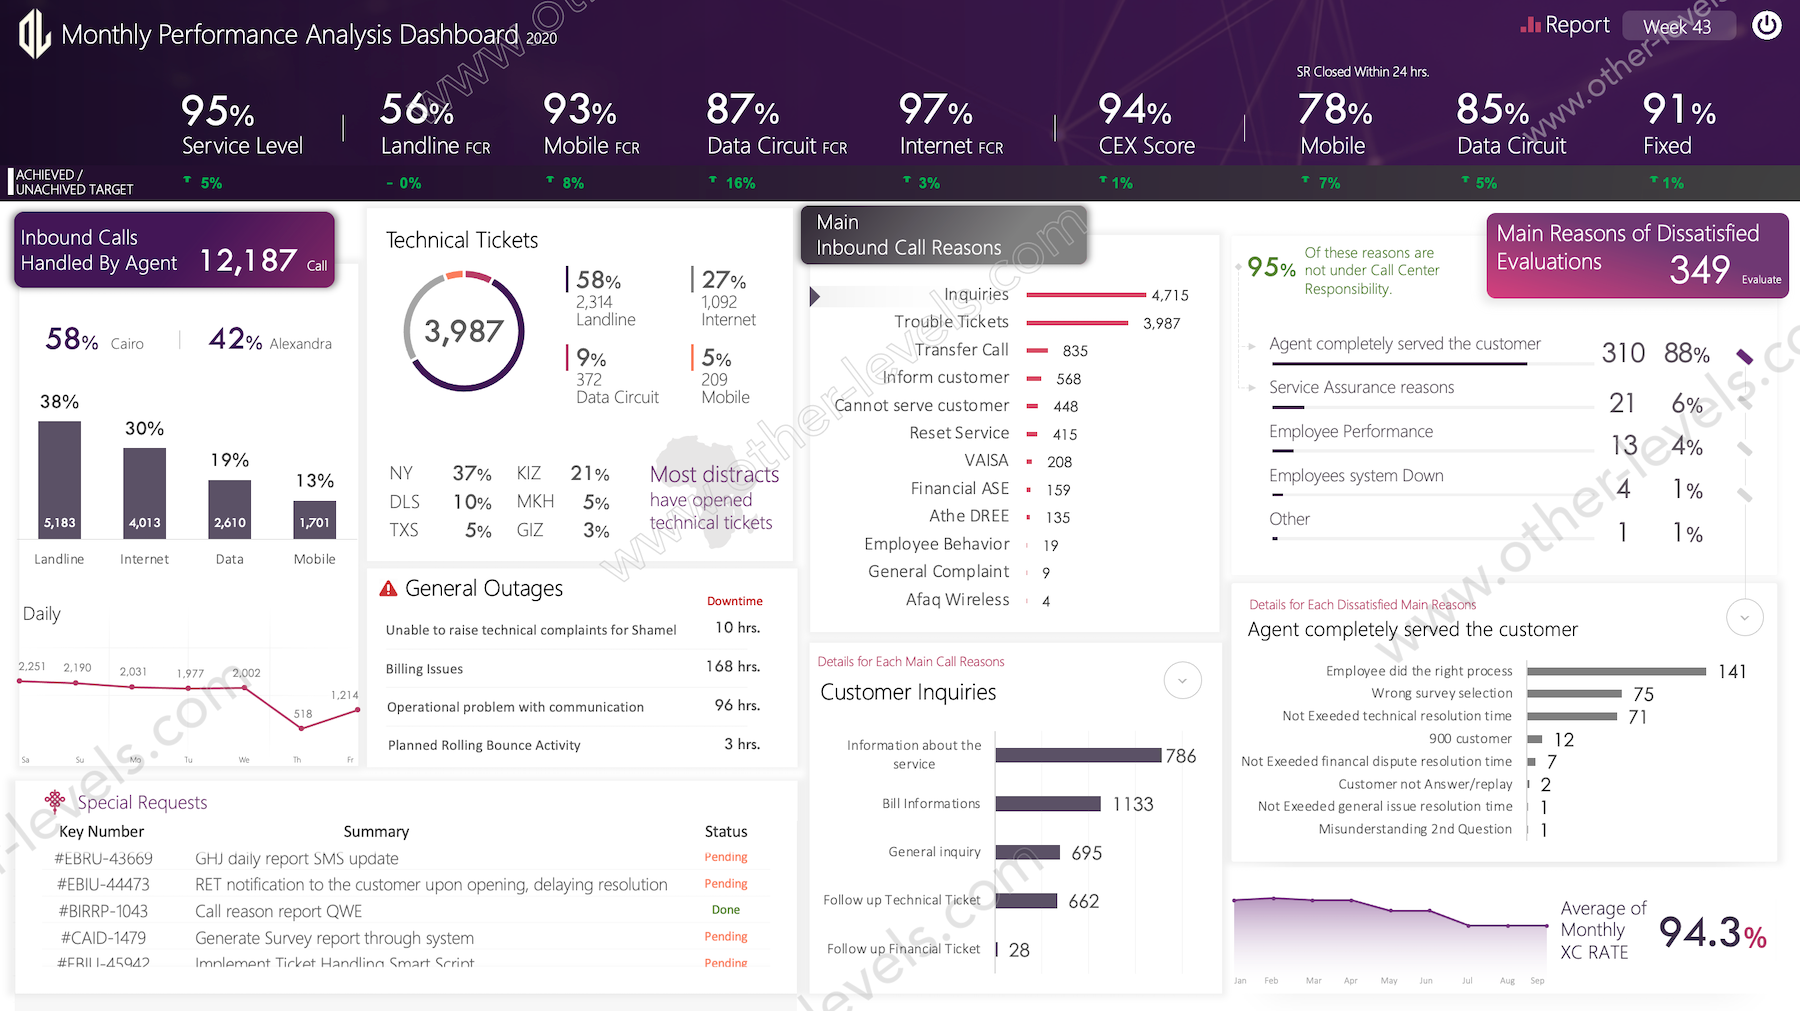
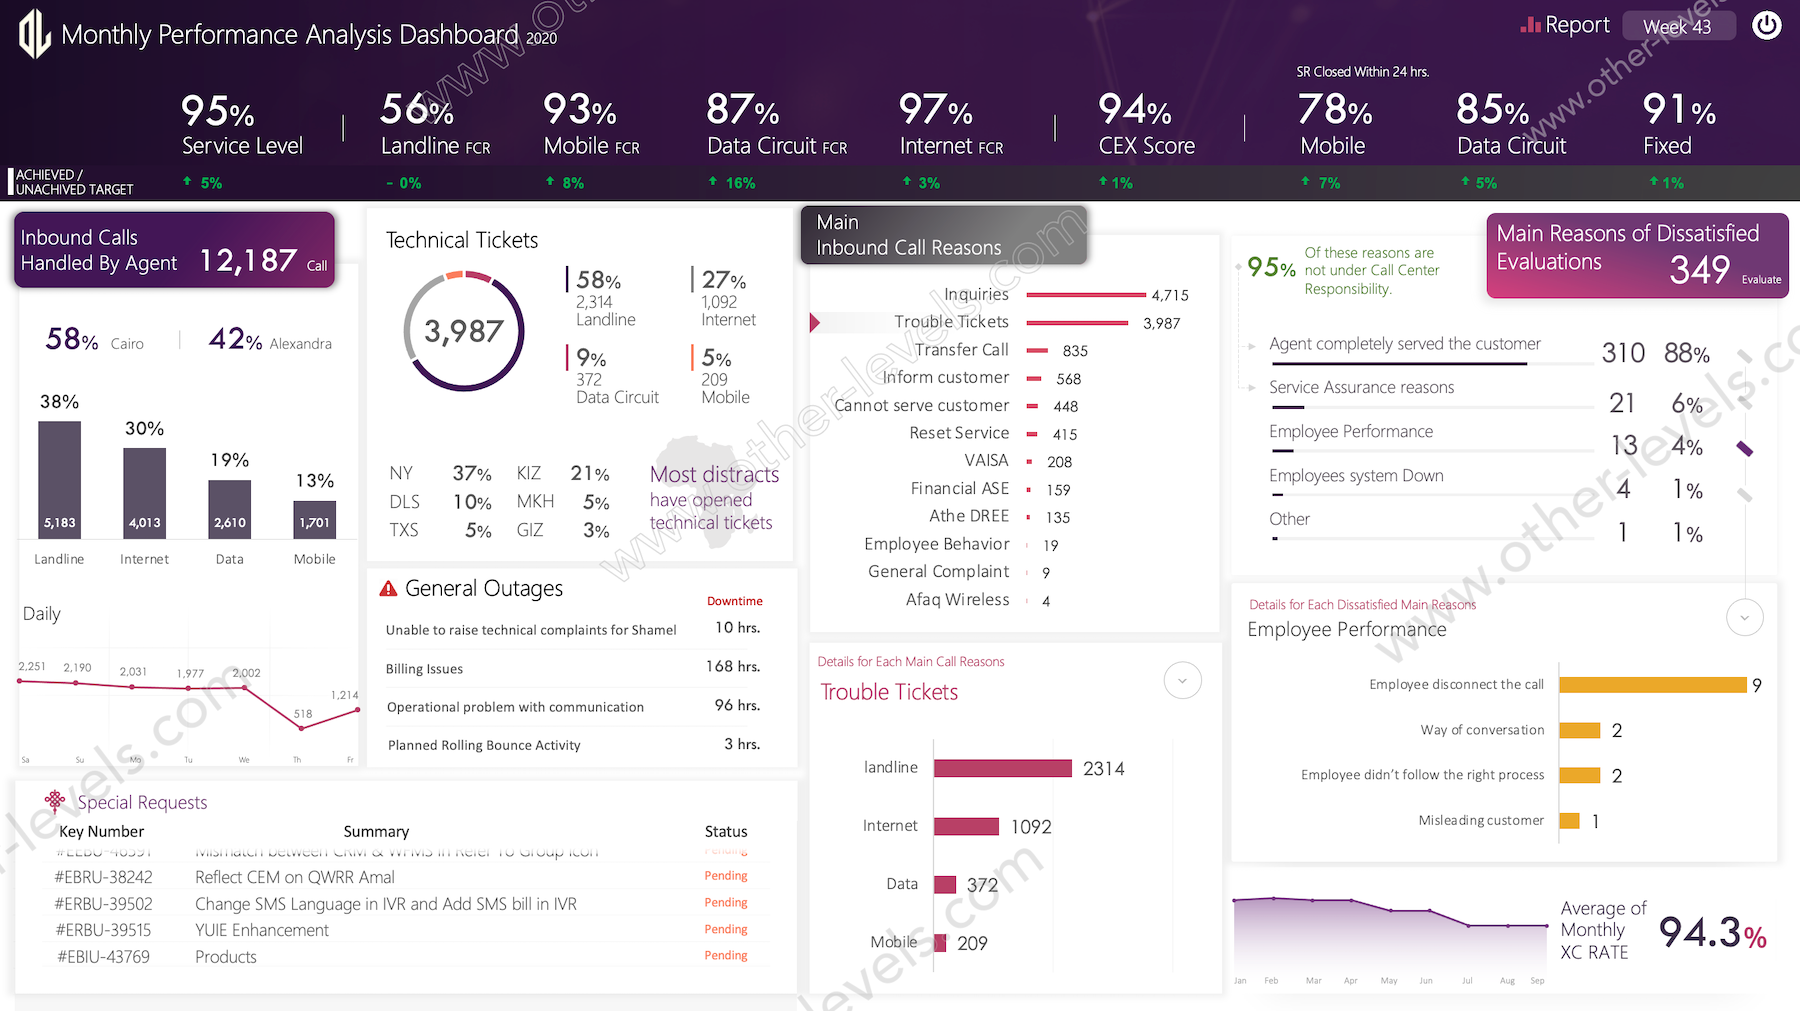
Transform raw data into actionable insights with visually engaging bar charts, column charts, and interactive elements. The inclusion of main KPIs ensures your most critical metrics are front and center. Icons with embedded hyperlinks add a layer of interactivity, enabling seamless navigation between sections or external resources.
Versatility for Every Industry
Whether you're tracking sales, operational performance, or project milestones, this Excel Dashboard is adaptable to various business needs. Its user-friendly design caters to professionals seeking an intuitive and efficient way to present data.
Benefits of Using This Dashboard
- Save time by automating data representation.
- Enhance decision-making with easy-to-read visuals.
- Communicate effectively with stakeholders using professional-grade reports.
With its combination of dynamic functionality and polished presentation, the Excel Weekly, Monthly, and Annual Report Dashboard is an indispensable tool for businesses and individuals striving for clarity in reporting.
Key Features
- Report Title and Description
- Main KPIs
- Bar Charts
- Column Chart
- Icons with Hyperlinks
- Three reports
Template Features
Package Details
Software Compatibility
Skill Level Required
Beginner
FAQs
Please read our FAQs page to find out more.
Are the templates fully customizable?
Yes, all our templates are fully customizable. You can adjust the layout, data, and design elements to fit your specific needs. Our templates are designed to be flexible, allowing you to easily tailor them to your preferences.
Can I order a product in any language?
Yes, we provide products in any language. Simply select the "Other Language" option from the product options during your purchase. Once your order is placed, you will receive it within 48 hours.
What happens if I choose the wrong monitor screen size for my dashboard?
If you choose the wrong screen size, the dashboard may not display correctly on your monitor. Elements could appear too large, too small, or misaligned, affecting the readability and usability of the dashboard. We recommend selecting the appropriate screen size to ensure optimal viewing and performance.
Do I need any specific skills to use the dashboards?
Yes, to effectively use our advanced Excel dashboards, you must have at least a basic understanding of PivotTables. This will help you customize and analyze the data efficiently.
Do you provide services to add our own data to the purchased templates?
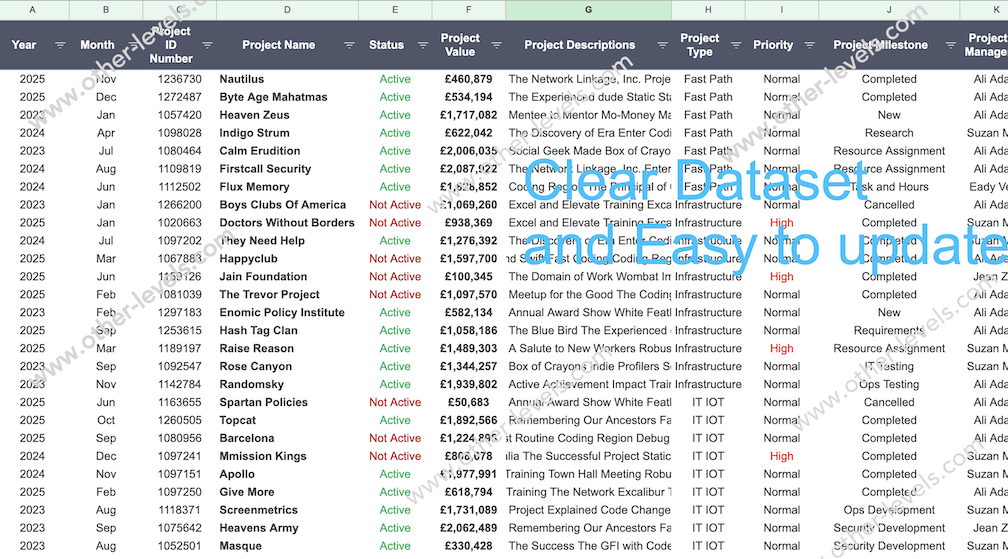
No, we do not offer services to input your specific data into the purchased templates. The templates are fully customizable, allowing you to easily add your own data.
Do I need specific skills to use the advanced Excel dashboard templates?
Our advanced Excel dashboards are easy to use, the only thing you need to know is how to work with PivotTables. With basic knowledge of PivotTables, you'll be able to customize and fully utilize these templates effortlessly. "Please check the skill level required"
Can I showcase these templates on websites or online platforms?
No, it is against our copyright policy to showcase these templates on websites, social media, or any online platforms. The templates are for your personal use only and are not permitted for public display or distribution.


