

Microsoft Excel is a tool at the fingertips of every kind of professional.
Are you crunching numbers, cleaning data, or managing reports? It is good for Microsoft Excel to carry features that can equate to saving hours of your precious time each week with everyday use. These tips will work for Microsoft Excel versions like 365, 2021, 2019, 2016, 2013, as well as Excel for Windows and Excel for Mac.
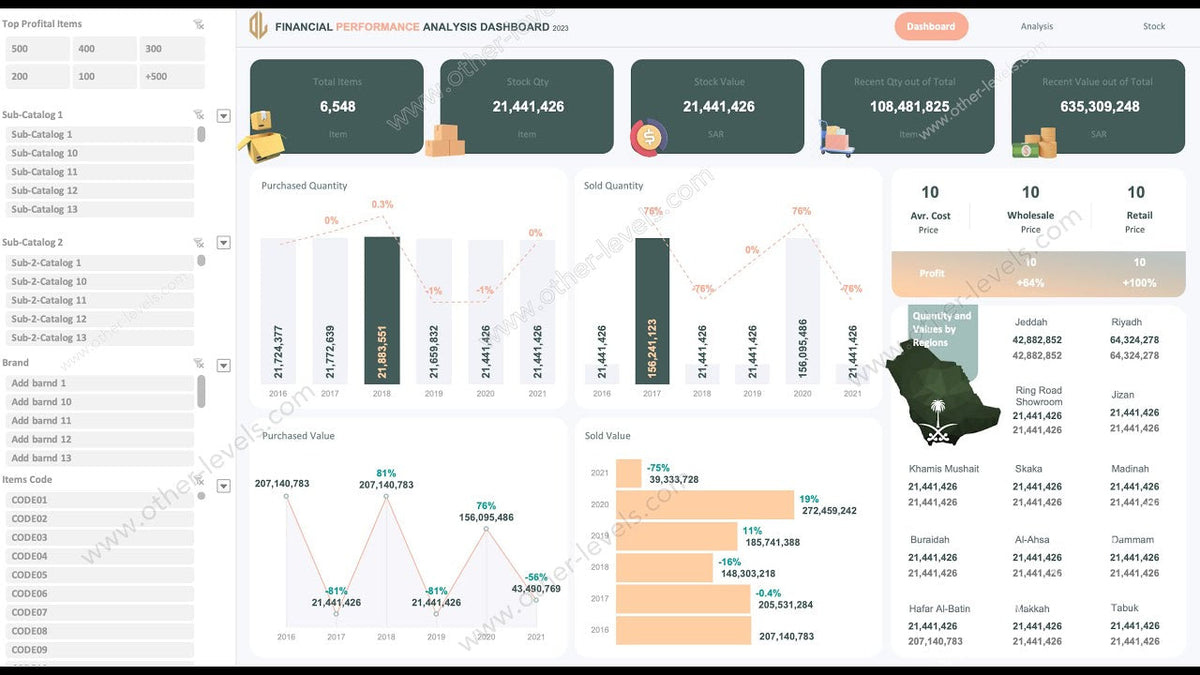
These 10 Tips are useful to everyone using the Microsoft Excel Dashboard. When you use your very customised Dashboard, tailored to your very own requirements, you can complete work in the fastest time possible.
1. Use Flash Fill to Automate Data Entry
Flash Fill will go ahead and fill in the values upon recognising a pattern. It is useful for splitting names, formatting dates, or generating emails.
-
Shortcut: Ctrl + E
-
Tabs: Data → Flash Fill

2. Use the IF Function
The IF function returns a value in case the condition is met.
-
Syntax: =IF(logical_test, value_if_true, value_if_false)
-
Example: =IF(A2>100, "High", "Low")

3. Use Conditional Formatting to Highlight Important Data
Use a conditional format to fill cell colours on the basis of rules.
-
Tabs: Home → Conditional Formatting
-
Good for overdue dates, top performers, or budget overruns

4. Create Drop-Down Lists from Validated Data
Entries from respective lists are limited.
-
Tabs: Data → Data Validation → List
-
Good for forms, surveys, and controlled inputs

5. Freeze Panes to Keep Headers in View
Make headers or columns stay visible while scrolling.
-
Tab: View → Freeze Panes
-
Tip: Select cell B2 to freeze the top row and the first column

6. Convert Data to Tables: Regarding Management
Tables auto-expand, structured references, and filtering are built-in features.
-
Shortcut: Ctrl + T
-
Tab: Insert → Table

7. Use VLOOKUP for Retrieving Matching Data
Get the data from one table, based on its common key, in another table.
-
Syntax: =VLOOKUP(value, table, column, FALSE)
-
Try XLOOKUP (Excel 365/2021): As a replacement

8. Keyboard Shortcuts for Speed

9. Summarise Data with PivotTables
Use a quick drag-and-drop summary to analyse big datasets.
-
Tab: Insert → PivotTable
-
Total sales, count transactions, average scores

10. Conditional Sums by SUMIF
Add values that satisfy the criteria.
-
Syntax: =SUMIF(range, criteria, sum_range)
-
Example: =SUMIF(A2:A10, "East", B2:B10)

Regardless of whether you are a Beginner or a Pro, these 10 tips will boost your productivity immensely.
Attempt to apply a new tip every day, and note how many hours you would save.
Get Help in Learning Microsoft Excel with Other Level’s so that you won’t feel the need to search for Microsoft Excel Tips and Tricks now and then.
🎓 Learn More with Other Levels
Visit Other Level’s Website
Also, with Other Level’s Free video Tutorials, you can become an Excel Pro in no time.
Visit Other Level’s YouTube Channel for the most useful Tips on Microsoft Excel, Microsoft Powerpoint, Microsoft Power BI and Google Sheets.


Share:
Excel Dashboard Progress Bars with REPT – Tutorial
Excel Flash Fill Guide: Save Time on Repetitive Data