✅ Instant Digital Delivery | 🔒 Secure Checkout | ⭐ Trusted by 1,000+ Professionals | 💬 24hr Support
Inbound Call Center Analytics Dashboard – Agent and Talk Time KPIs
Pairs well with
Excel Dashboard Overview
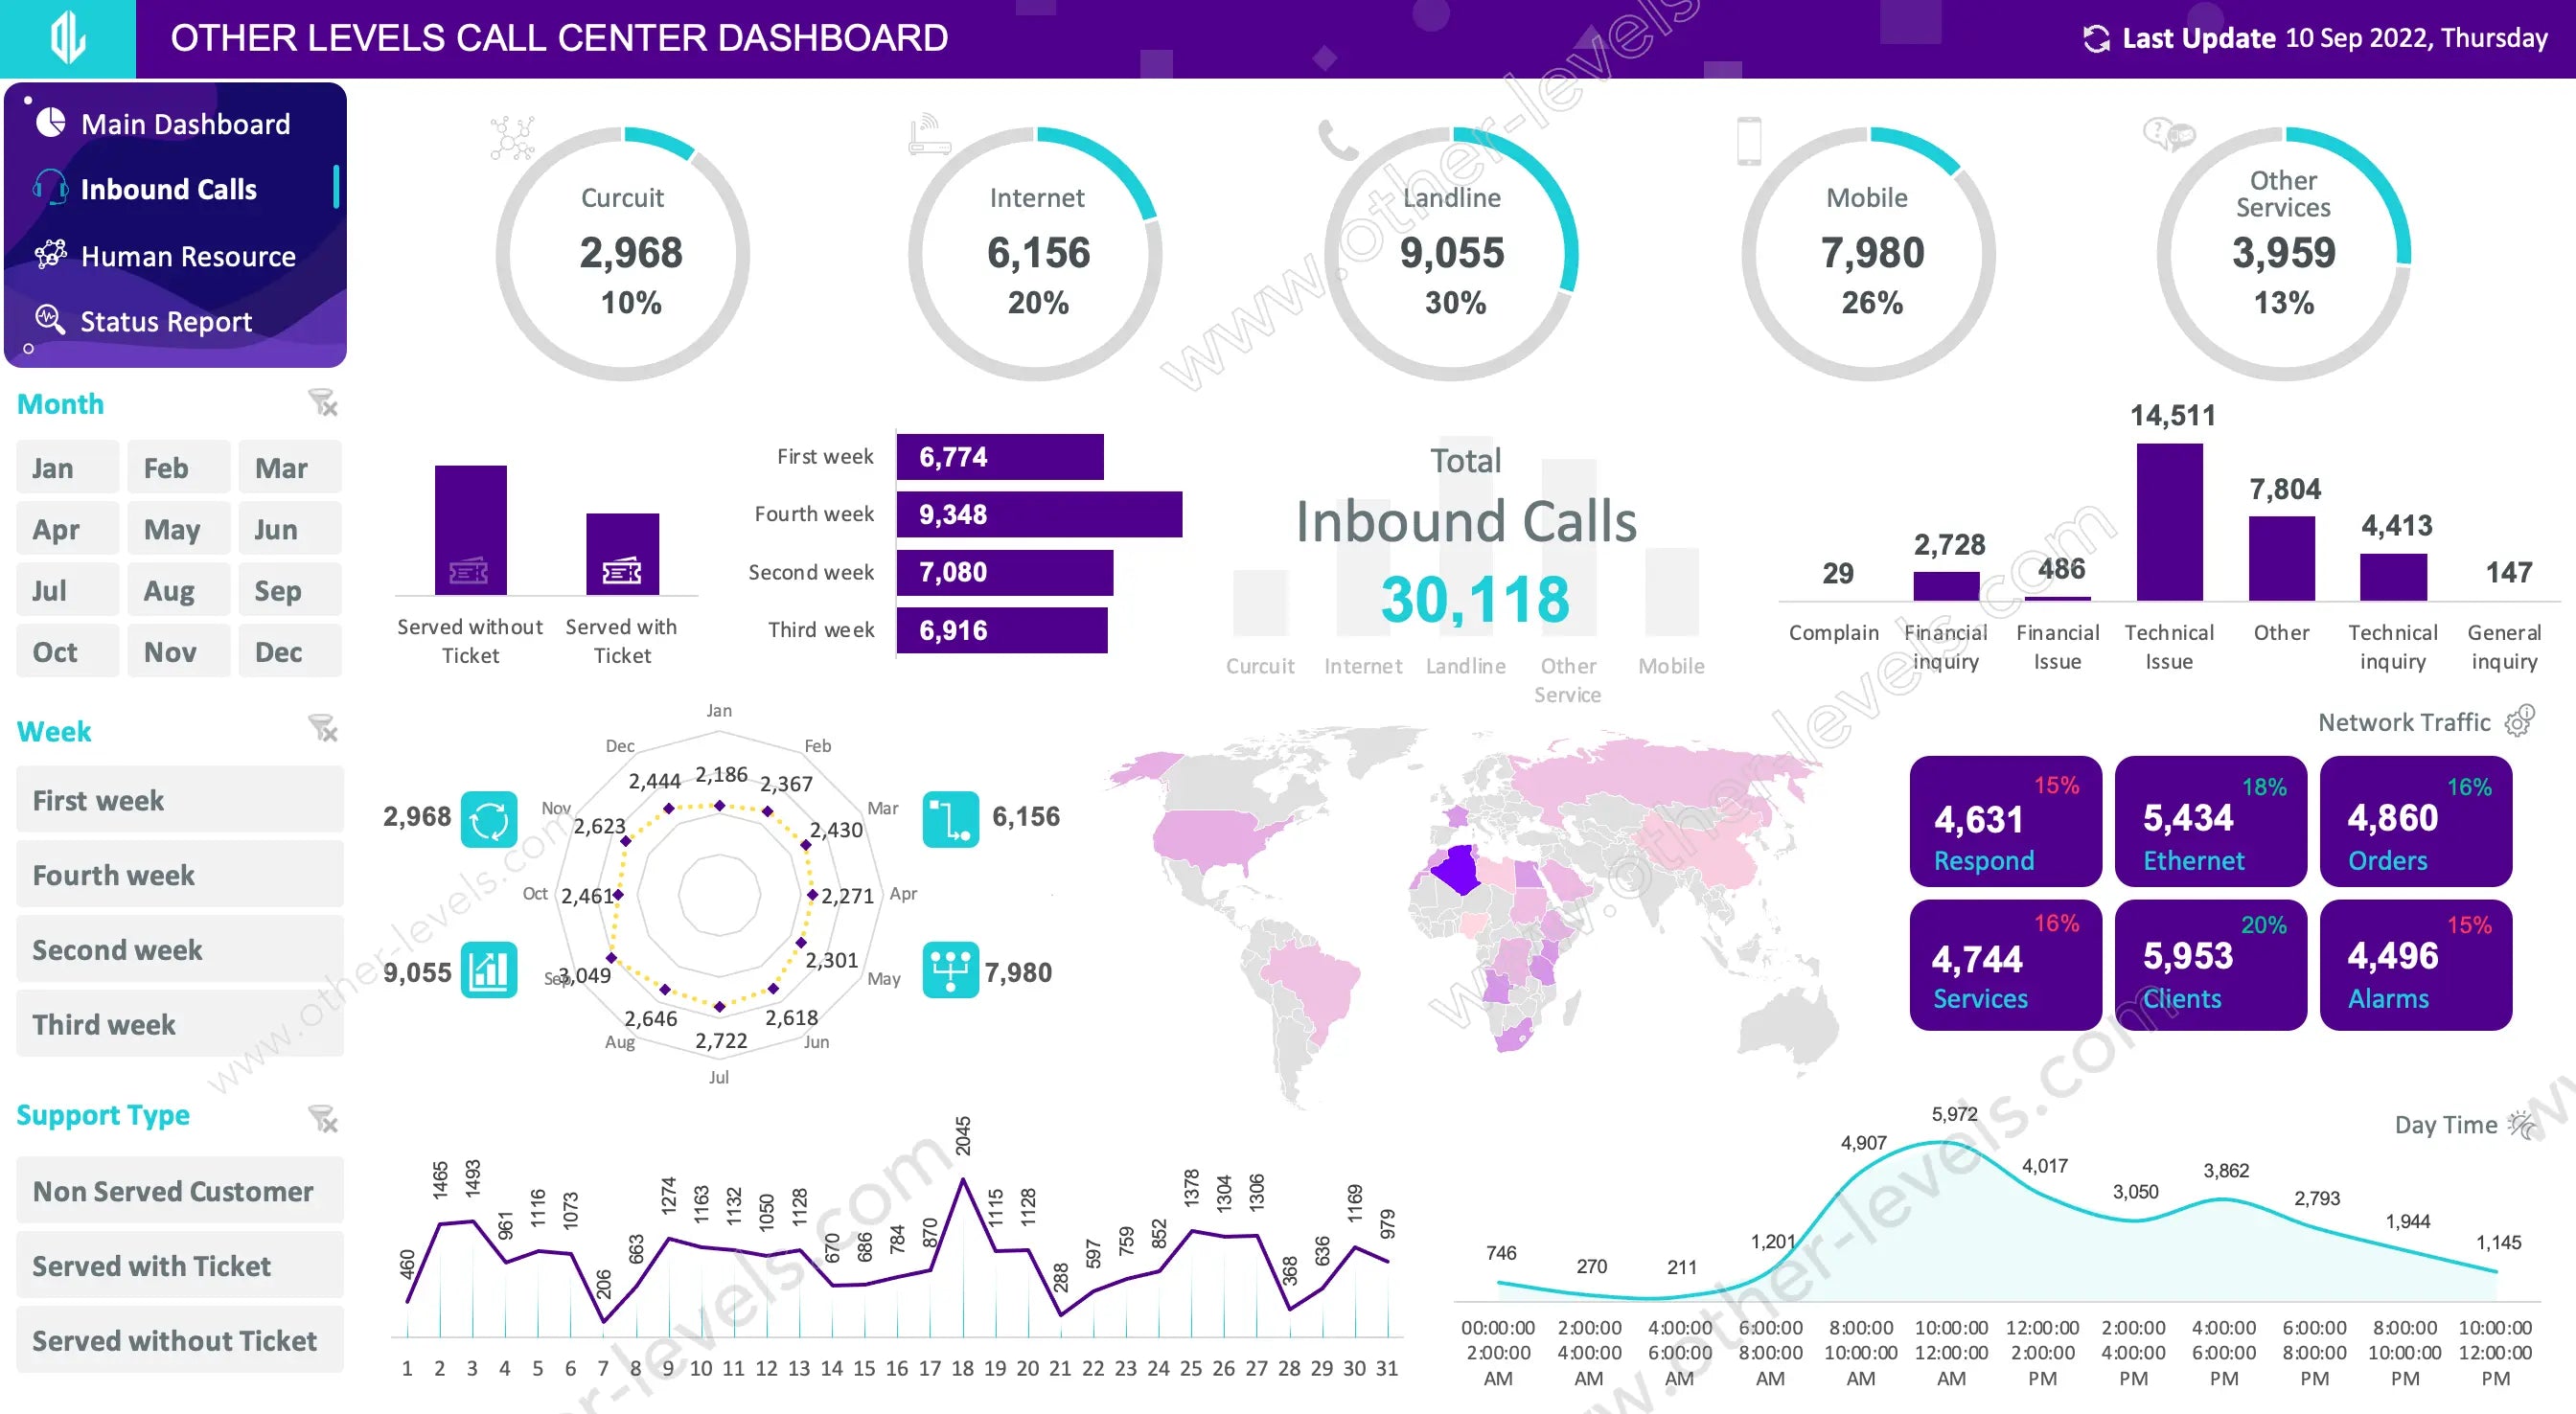
Meet the Excel Dashboard built for real-world contact centers. Pick a month or week, and every visual updates instantly—no digging through sheets. Teams use it to spot peaks, understand why customers call, and plan the right staffing before the rush hits.
Inbound Call Center Analytics Dashboard
This template focuses on clear, practical decisions for an inbound call center. KPI rings highlight channel mix; issue columns explain demand; a world map shows geography; and daily/hourly trends guide scheduling. It’s fast to learn, easy to share, and ideal for managers who want signal over noise.
What’s Inside (Visuals & Layout)
- Doughnut gauges for channel mix (Internet, Landline, Mobile, Other Services)
- Column and bar charts for issue types and week-by-week comparison
- Radar chart for seasonality; filled map for country-level distribution
- Daily line trend and hourly area curve for coverage and break planning
- Tiles for operations counters with % change to track momentum
Core Metrics & Answers
- Call center data analytics with one-click slicers
- Call center performance metrics consolidated into KPI cards
- SLA management with thresholds and an export-ready sla report
- Average handle time (AHT), talk time, queue time for workload insight
- First call resolution rate for resolution quality; plus agent performance and occupancy rate
- Built for inbound call center software workflows and scalable inbound call center solutions
How It Helps
- Shows how to monitor call center performance in minutes
- Gives leaders a reliable snapshot for coaching, forecasting, and staffing
- Refresh-ready model for repeatable call center data analysis
Use Cases
- Daily standups: review spikes and channel share before scheduling
- Weekly ops reviews: compare weeks; check FCR and AHT against targets
- Monthly reporting: export visuals and KPIs for leadership decks
Related Products
- Advanced Logistics Transportation Management Excel Dashboard – route KPIs & fleet tracking
- Inbound Call Center Data Analysis & Interactive Excel Dashboard – SLA & KPI reporting
Video Tutorial
Specifications
Get all essential details in one place. From features and package contents to software compatibility and skill level required, this section gives you a clear overview so you know exactly what to expect before download.
Template Features
Package Details
Software Compatibility
Skill Level Required
Intermediate
FAQs
Please read our FAQs page to find out more.
Are the templates fully customizable?
Yes, all our templates are fully customizable. You can adjust the layout, data, and design elements to fit your specific needs. Our templates are designed to be flexible, allowing you to easily tailor them to your preferences.
Can I order a product in any language?
Yes, we provide products in any language. Simply select the "Dashboard language change" Service and once your order is placed, you will receive it within 48 hours.
What happens if I choose the wrong monitor screen size for my dashboard?
If you choose the wrong screen size, the dashboard may not display correctly on your monitor. Elements could appear too large, too small, or misaligned, affecting the readability and usability of the dashboard. We recommend selecting the appropriate screen size to ensure optimal viewing and performance.
Do I need specific skills to use the advanced Excel dashboard templates?
Our advanced Excel dashboards are easy to use, the only thing you need to know is how to work with PivotTables. With basic knowledge of PivotTables, you'll be able to customize and fully utilize these templates effortlessly. "Please check the skill level required"
All dashboards are 100% editable Excel files. Learn how to use them through our video tutorials, included datasets, and lifetime access program.