
✅ Instant Digital Delivery | 🔒 Secure Checkout | ⭐ Trusted by 1,000+ Professionals | 💬 24hr Support
logistics Management Excel Dashboard - Manage Transport
Pairs well with
What This Excel Dashboard Gives You
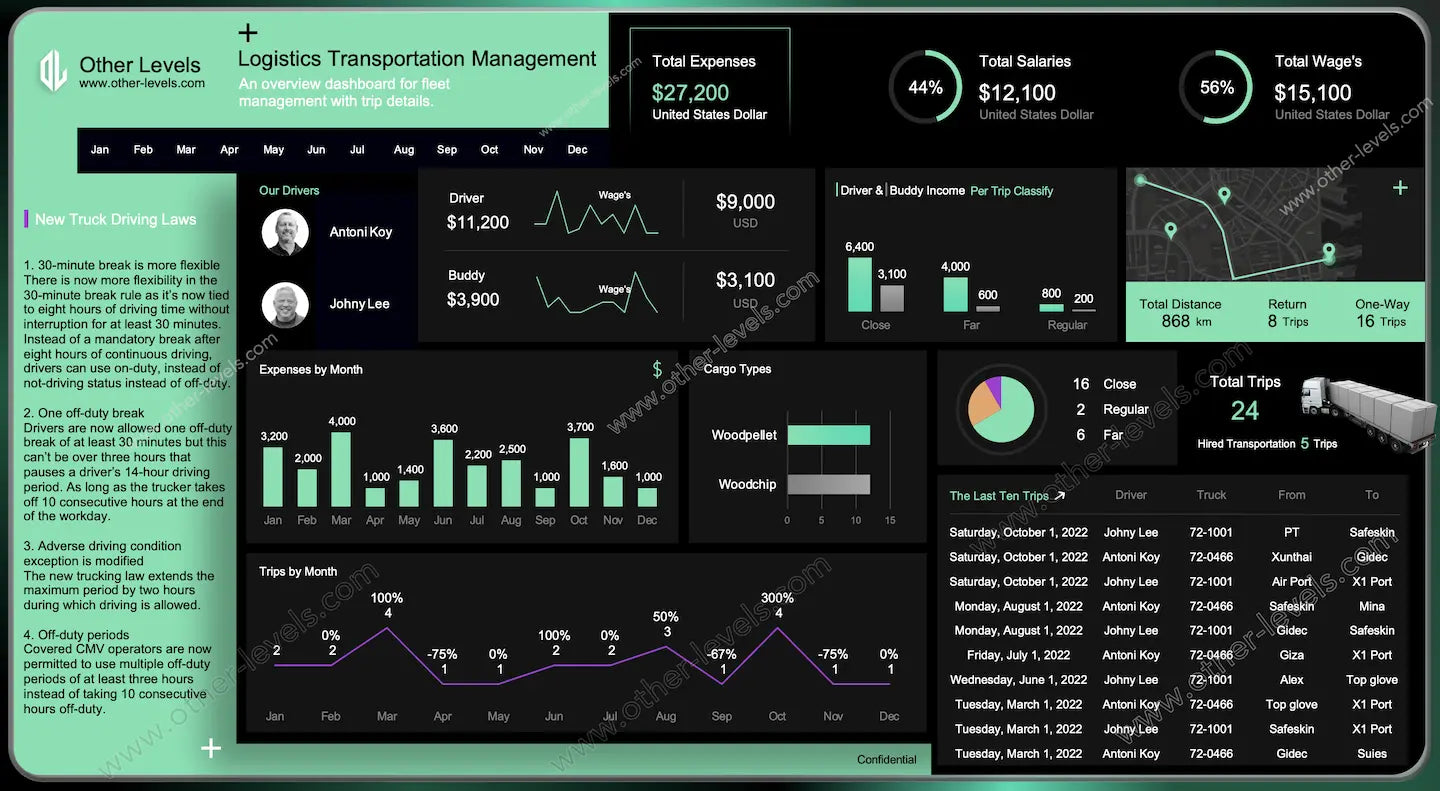
A clean, practical Excel Dashboard that keeps your logistics management organized in one place. It helps any logistics manager manage transport efficiently within a growing transportation network company. KPIs sit at the top, fleet and trip insights in the middle, and a simple log at the bottom, plus space for quick general notes.
Filters & Context
Month Strip
Select one or multiple months—every chart updates instantly, ideal for fast fleet analysis.
Title & Subtitle
Clear context so teams know which transport network they're viewing.
Top KPIs (Costs & Payroll)
Total Expenses
All running costs—fuel, service, tolls, and for hire transportation. Exportable in excel format for expense reports.
Total Salaries & Wages
Side-by-side salary breakdown for easy review.
Cost Share Gauges
Donut visuals showing budget distribution—helpful for quick fleet management cost analysis.
People View (Driver & Buddy)
Quick Roster
Names with small trend indicators to highlight workload balance.
Earnings by Trip Class
Stacked bars for Close, Regular, and Far trips—useful for advanced logistics route decisions.
Trips & Network
Route Snapshot
A simple path preview for quick orientation.
Distance & Direction
Total distance plus return vs one-way stats—ideal for spotting empty backhauls early.
Trip Type Mix
A pie showing the Close/Regular/Far split inside your transportation network company.
Total Trips & Hired Transport
Counts for internal fleet trips and external for hire transportation used in your transportation management solutions.
Trends You Can Act On
Expenses by Month
Column chart showing spending spikes for easy review.
Trips by Month
Line chart for monthly activity—pair with costs for quick insight.
Cargo & Shipments
Cargo Type Bars
Shows which cargo categories dominate operations and tracking shipment patterns.
Live Operations Log
Last Ten Trips
A refreshed list—date, driver, truck, origin, destination—works like a simple trip schedule template.
Notes & Compliance
Policy Corner
A shared space for rules and general notes.
Data You’ll Feed It
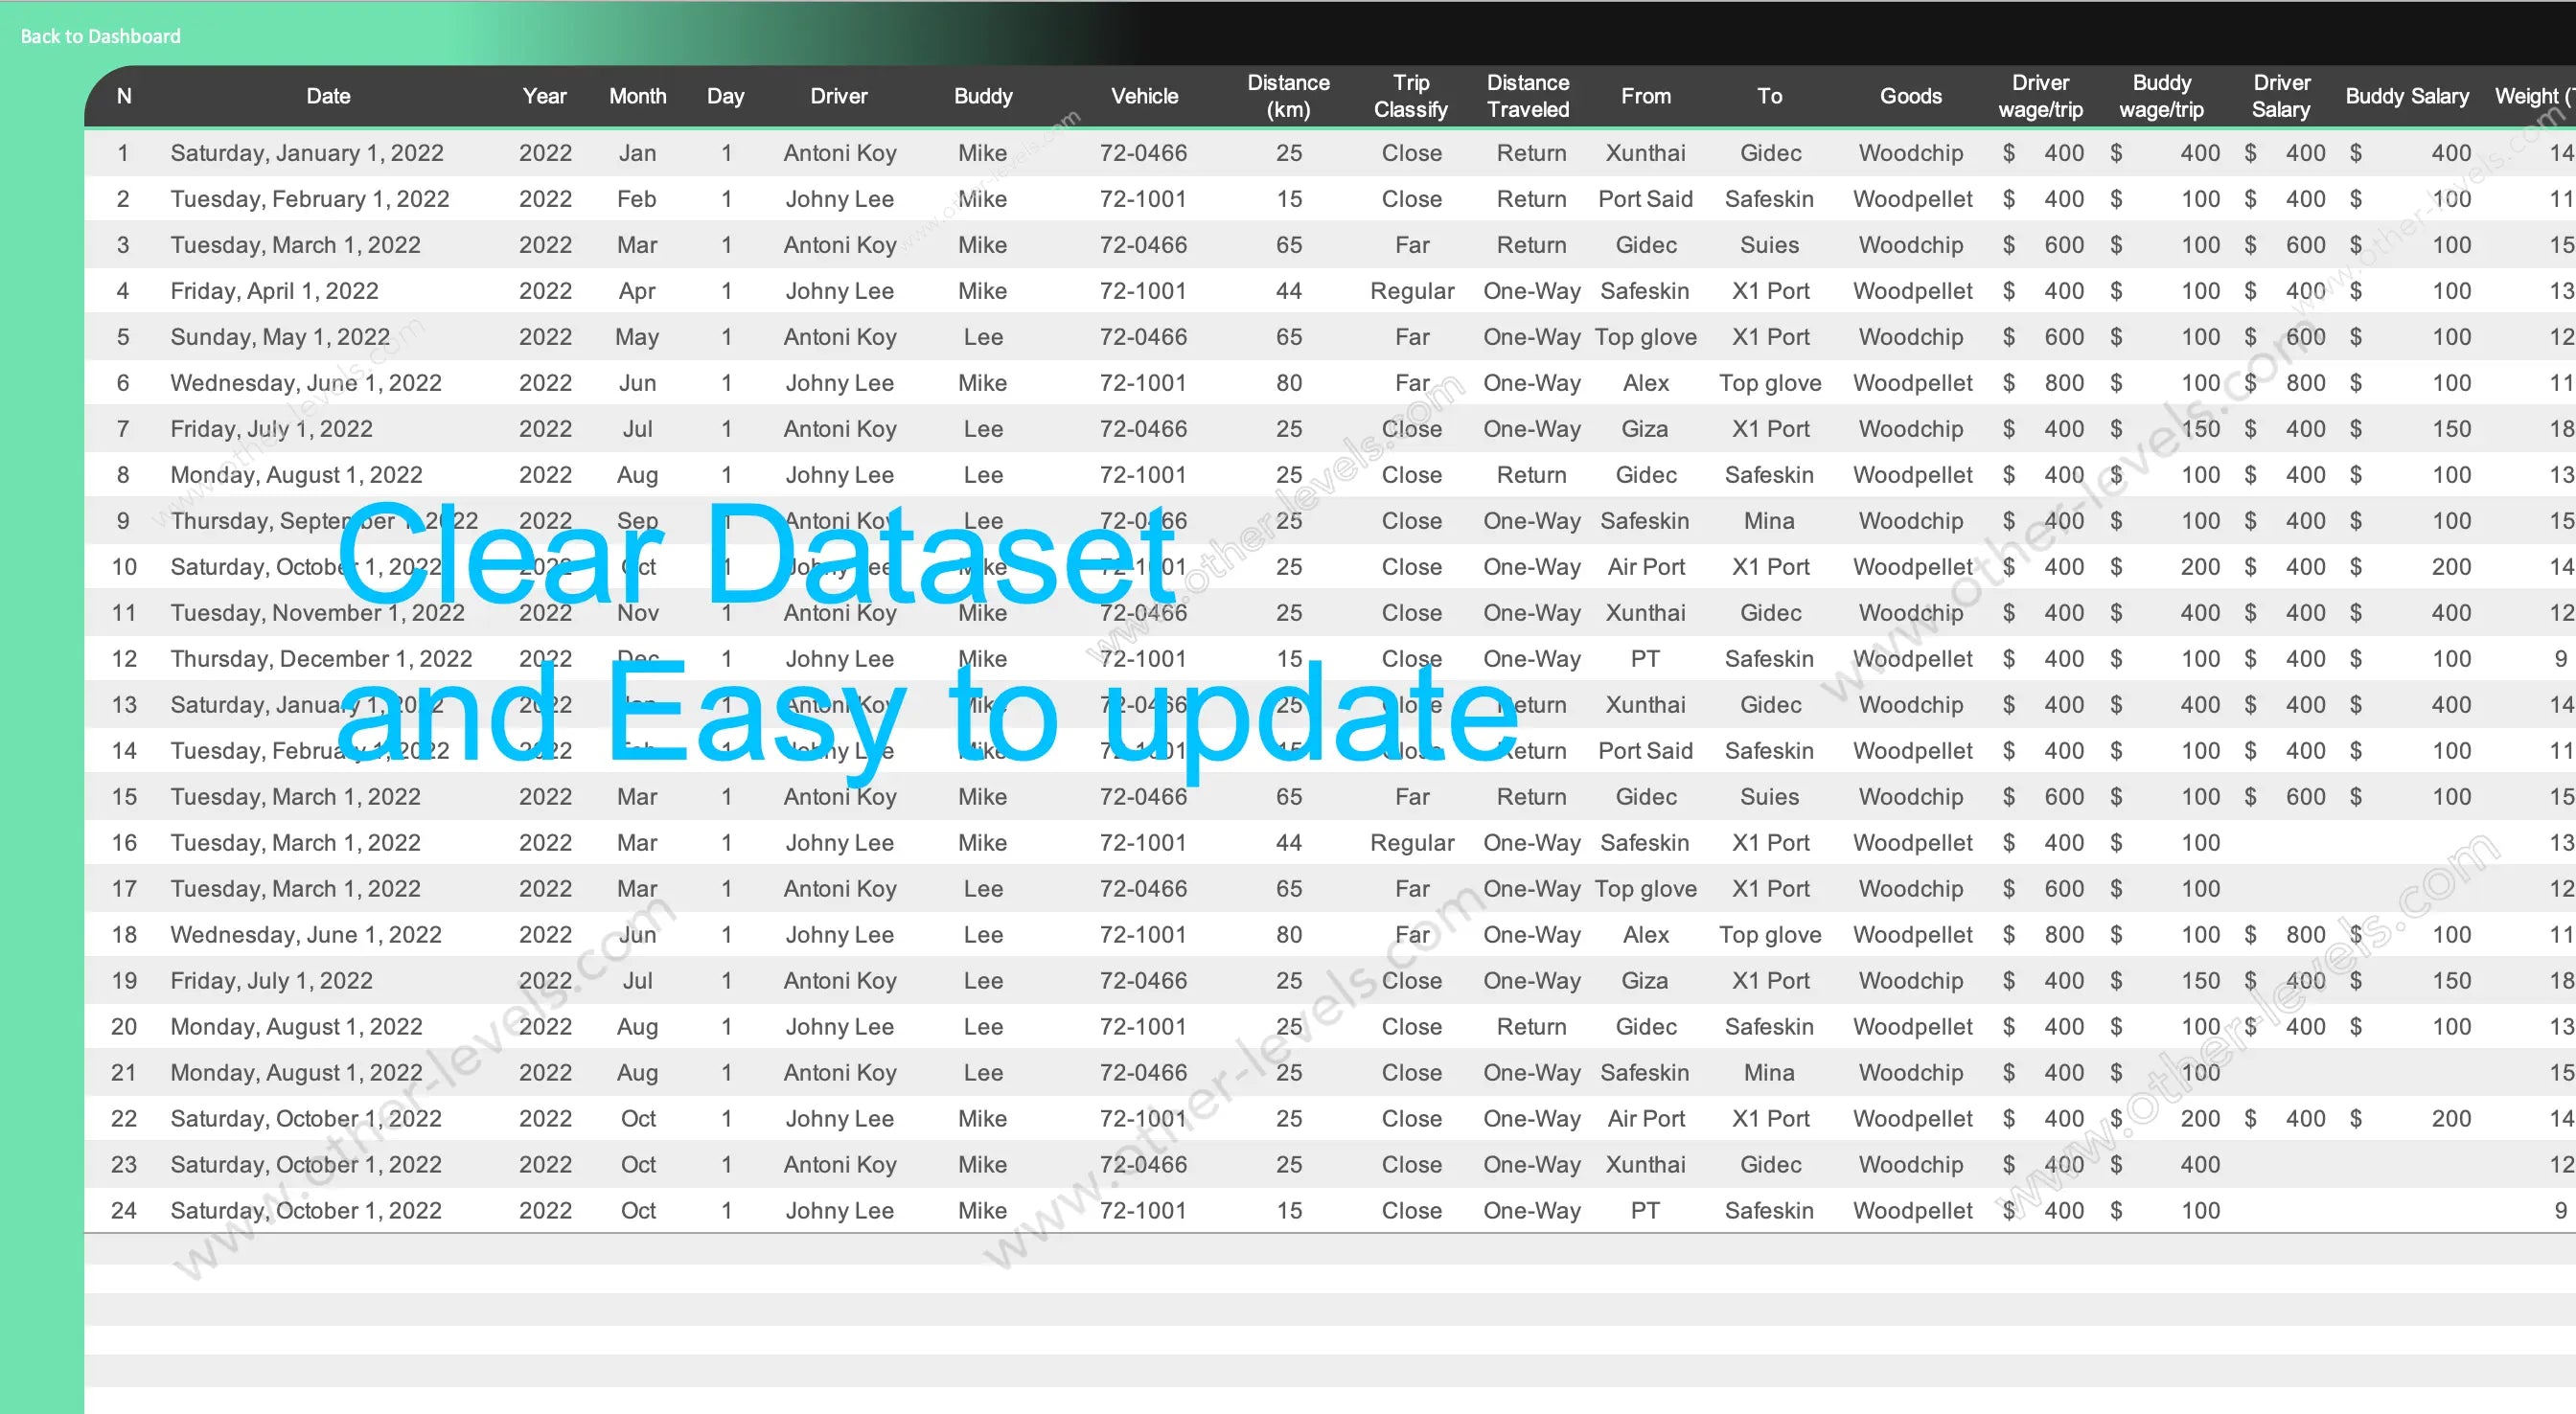
Trips Table
- Trip ID, Date, Month, Year
- Driver, Buddy, Truck ID
- Origin, Destination, Direction
- Trip Class (Close / Regular / Far)
- Distance, Cargo Category, shipment type
- Revenue (optional), Hired flag
Costs Table
- Date, Category, Amount
- Optional: Truck ID, Trip ID
Payroll Table
- Date, Person, Role
- Salary/Wage, Amount
- Trip ID (for trip-based wages)
How The Numbers Roll Up
Finance
- Total Expenses and exportable expense reports
- Salary/Wage totals and cost-share donuts for financial performance
Operations
- Total Trips, Distance, Return vs One-Way
- Hired transport counts
- Driver/Buddy earnings and trip class mix
Interaction That Feels Natural
Monthly Slicers
One click updates the whole story.
Drillthrough
Jump from a chart to detailed records instantly.
Build Notes (Excel)
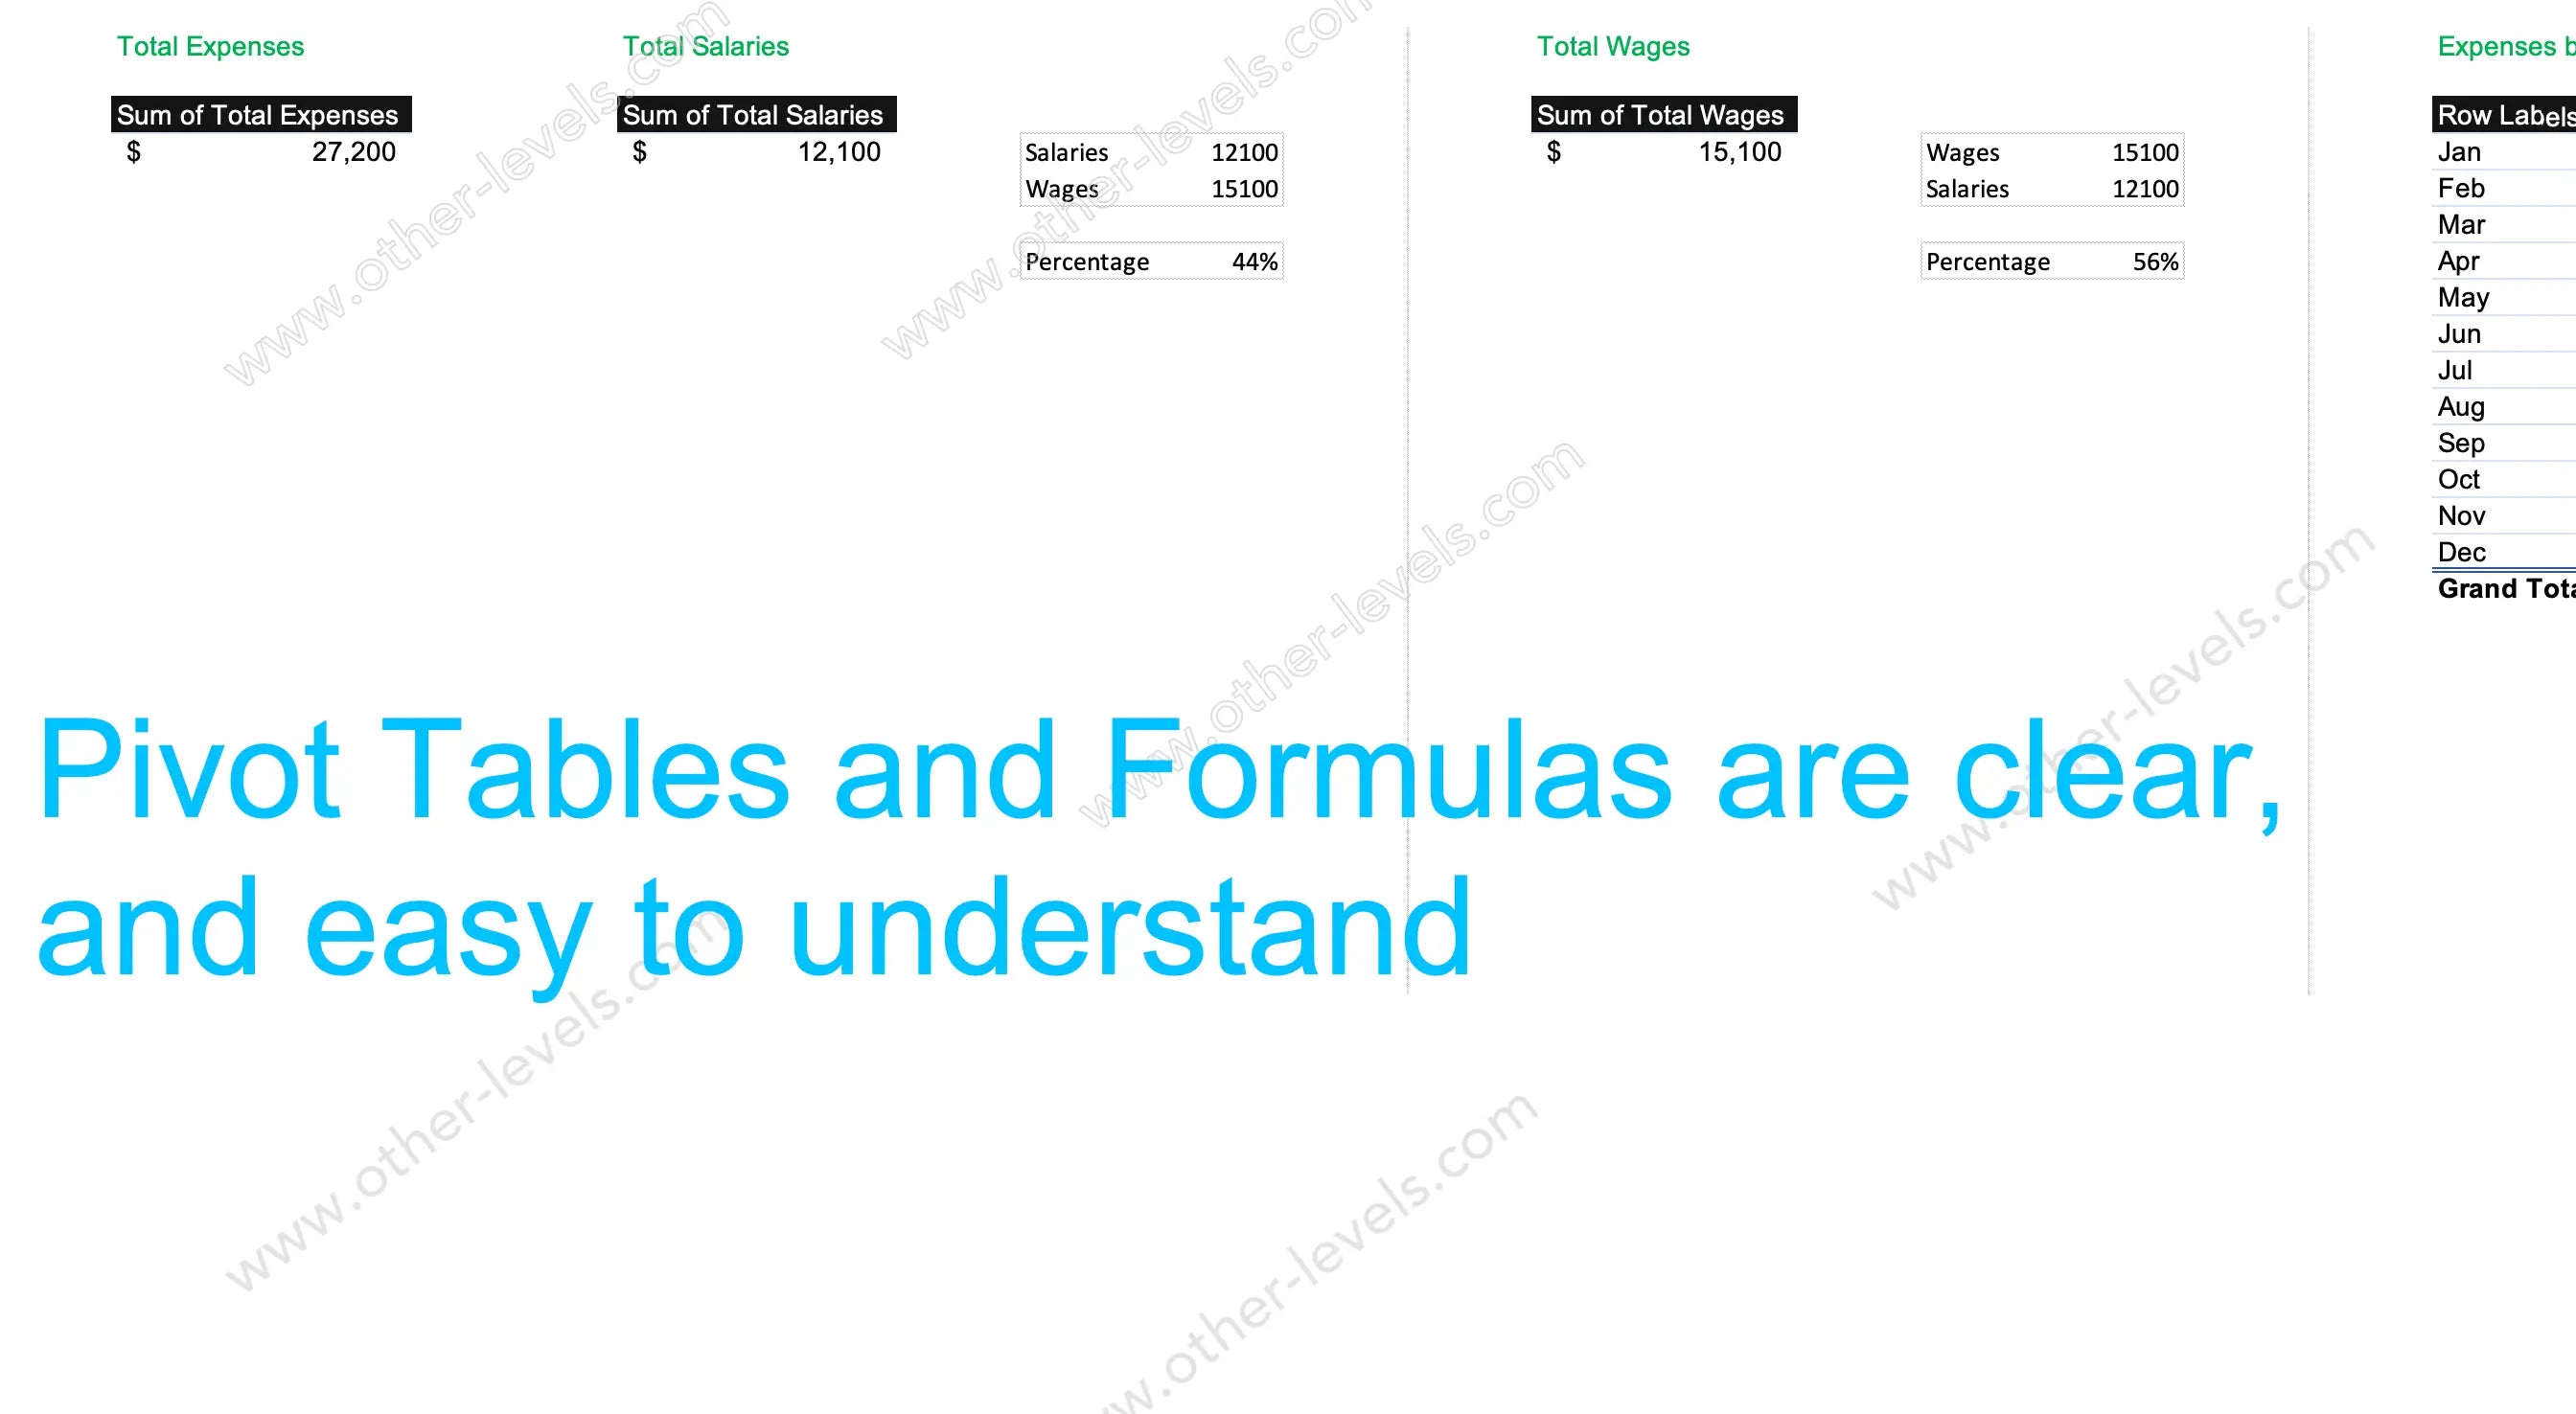
Tables & Pivots
Organized Tables feeding fast PivotTables for a shareable Spreadsheet.
Cards, Gauges, Sparklines
KPI cards (SUMIFS/GETPIVOTDATA), donuts, and small trends with no clutter.
Why Teams Like It
Daily Ops
Clear dispatch planning and faster fleet analysis.
Finance
Smooth reviews, clean breakdowns, and quick exports.
Planning
Trip and cargo patterns support better capacity planning inside transportation management solutions.
Who It’s For
Operations & Leadership
Teams handling logistics management at scale inside a transportation network company looking for fast insights and simple control.
Final Touch
Name & Focus
A practical template built for weekly decision-making—not complexity.
Related Dashboards You May Like
Video Tutorial — Logistics Management Excel Dashboard
Specifications
Get all essential details in one place. From features and package contents to software compatibility and skill level required, this section gives you a clear overview so you know exactly what to expect before download.
Template Features
Package Details
Software Compatibility
Skill Level Required
Intermediate
FAQs
Please read our FAQs page to find out more.
Are the templates fully customizable?
Yes, all our templates are fully customizable. You can adjust the layout, data, and design elements to fit your specific needs. Our templates are designed to be flexible, allowing you to easily tailor them to your preferences.
Can I order a product in any language?
Yes, we provide products in any language. Simply select the "Dashboard language change" Service and once your order is placed, you will receive it within 48 hours.
What happens if I choose the wrong monitor screen size for my dashboard?
If you choose the wrong screen size, the dashboard may not display correctly on your monitor. Elements could appear too large, too small, or misaligned, affecting the readability and usability of the dashboard. We recommend selecting the appropriate screen size to ensure optimal viewing and performance.
Do I need specific skills to use the advanced Excel dashboard templates?
Our advanced Excel dashboards are easy to use, the only thing you need to know is how to work with PivotTables. With basic knowledge of PivotTables, you'll be able to customize and fully utilize these templates effortlessly. "Please check the skill level required"
All dashboards are 100% editable Excel files. Learn how to use them through our video tutorials, included datasets, and lifetime access program.