✅ Instant Digital Delivery | 🔒 Secure Checkout | ⭐ Trusted by 1,000+ Professionals | 💬 24hr Support
Inbound Call Center Excel Dashboard - Agent Performance
Pairs well with
Inbound Call Center Excel Dashboard – Agent Performance
The Inbound Call Center Excel Dashboard is a professional-grade spreadsheet designed to simplify call center data analysis and enhance team performance visibility. With this interactive Excel Dashboard, you can explore key metrics that reveal how your inbound team operates, helping managers understand how to monitor call center performance with clarity and confidence.
Comprehensive Call Center Insights
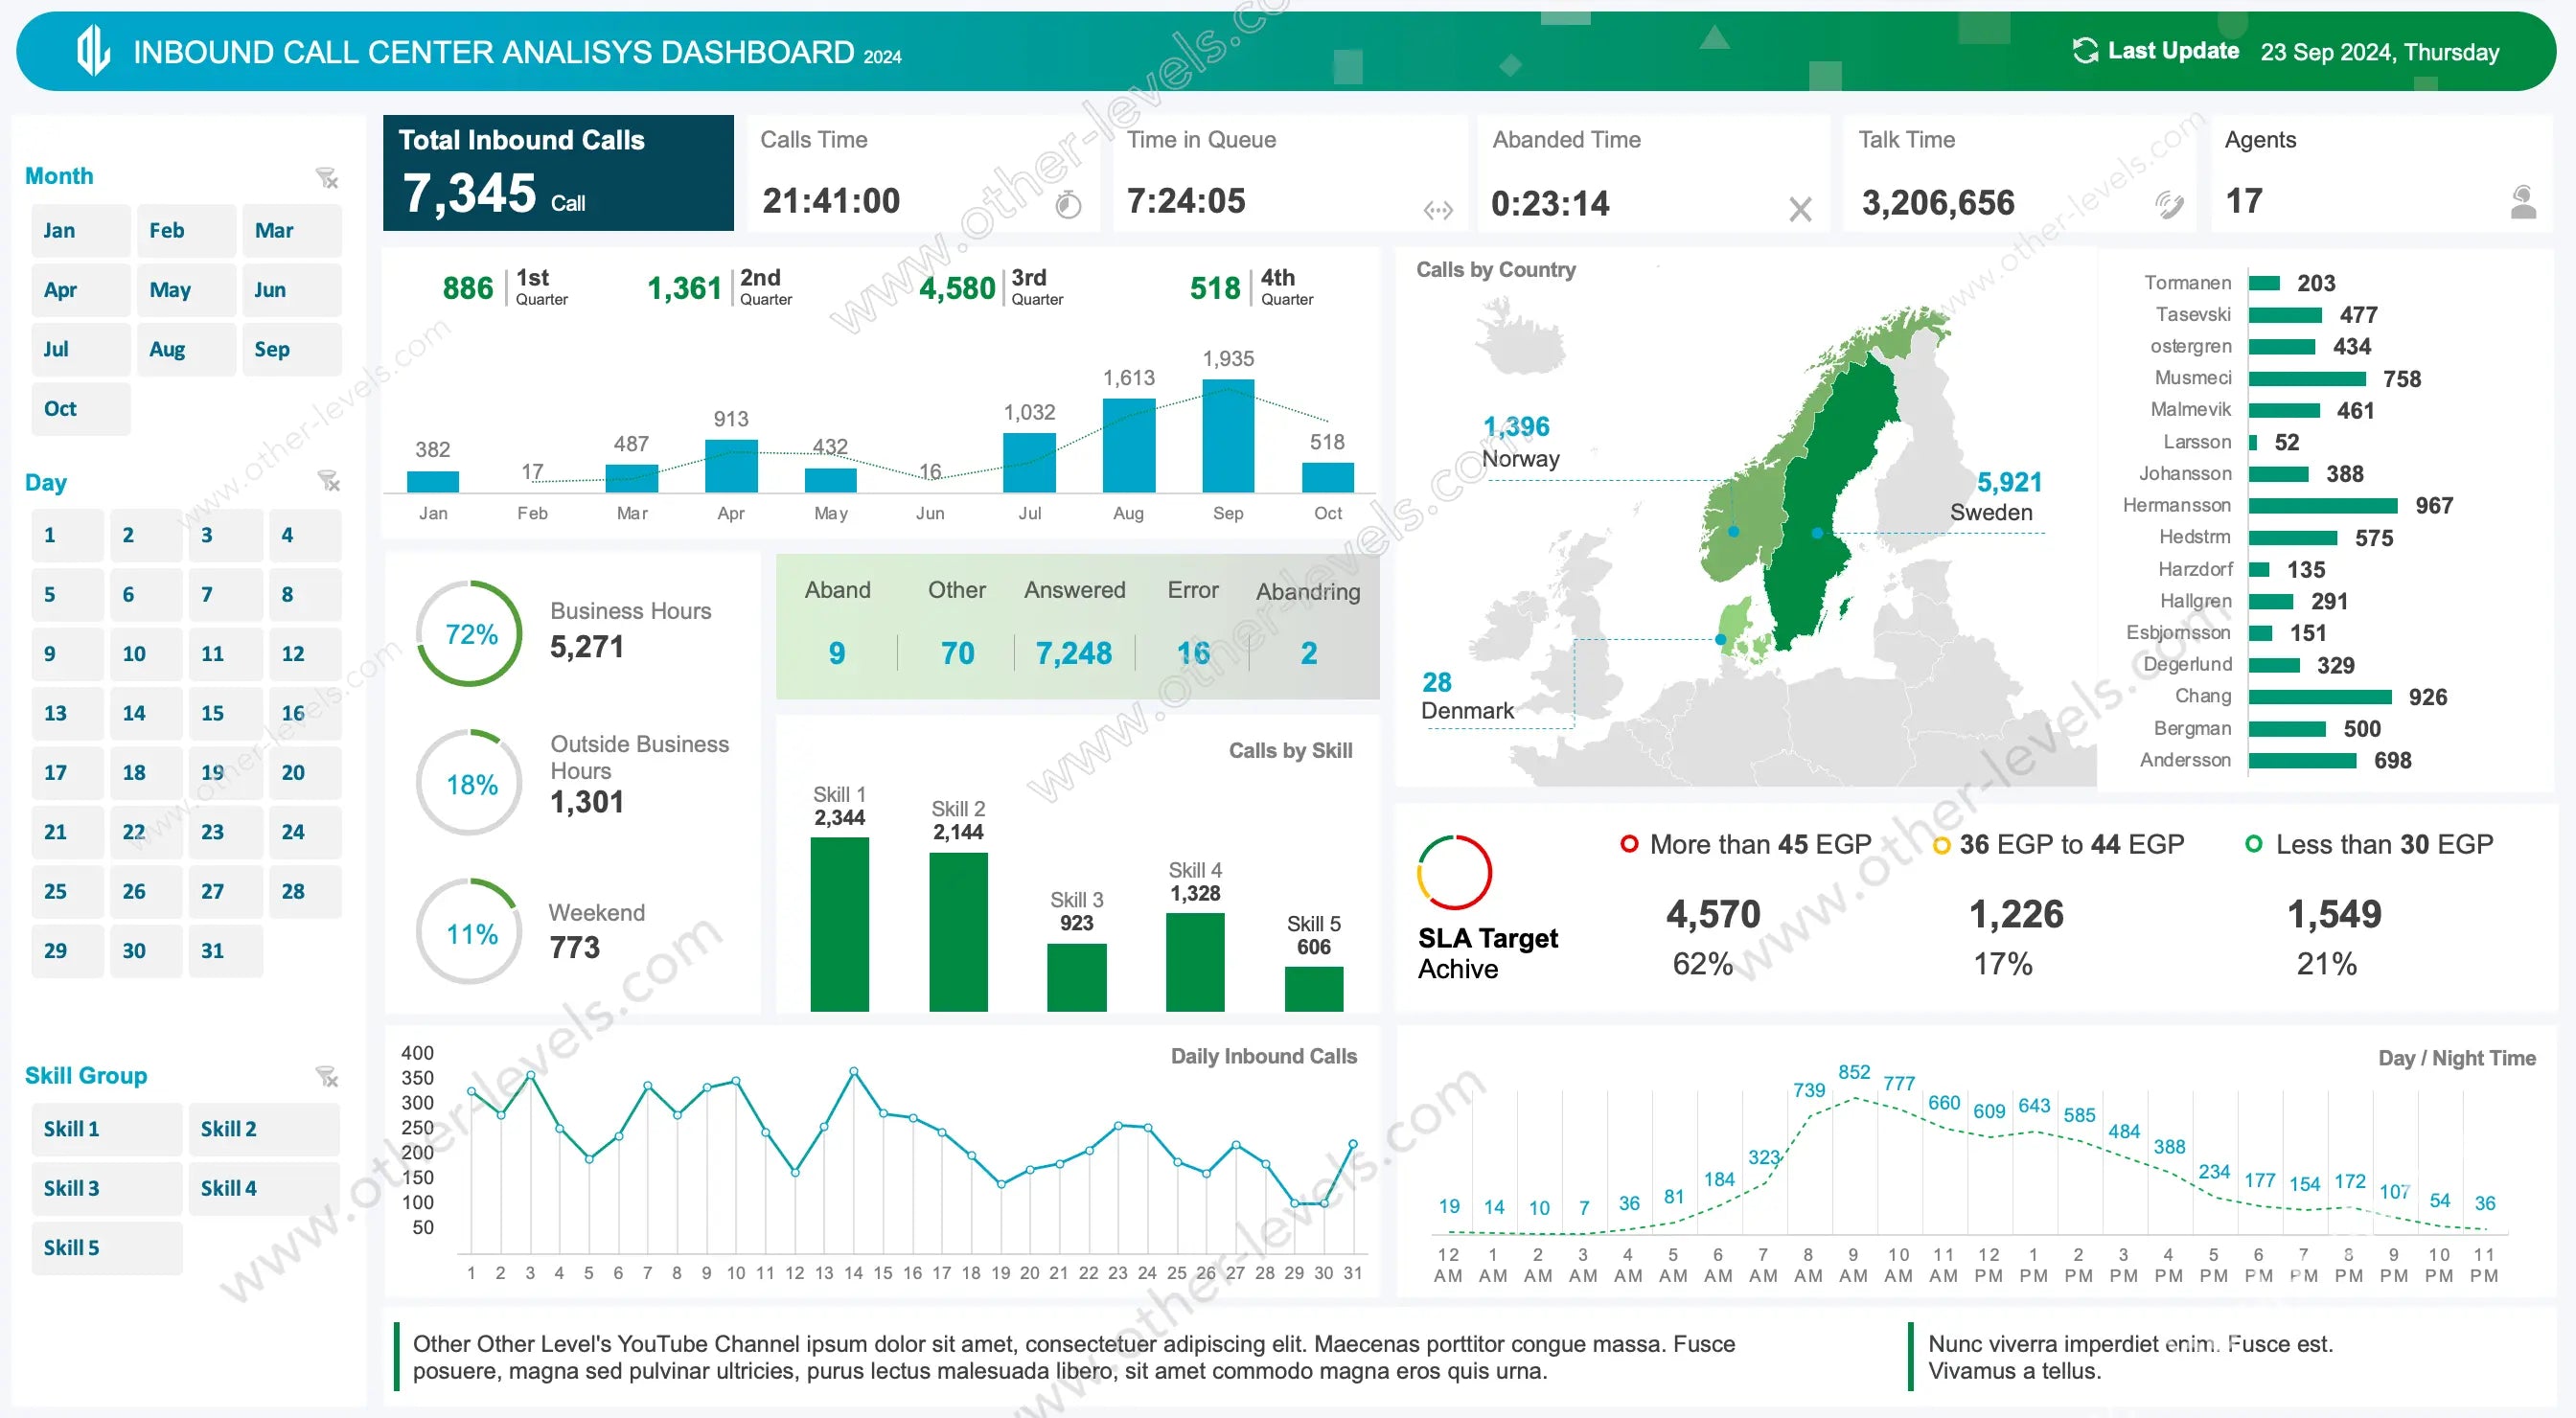
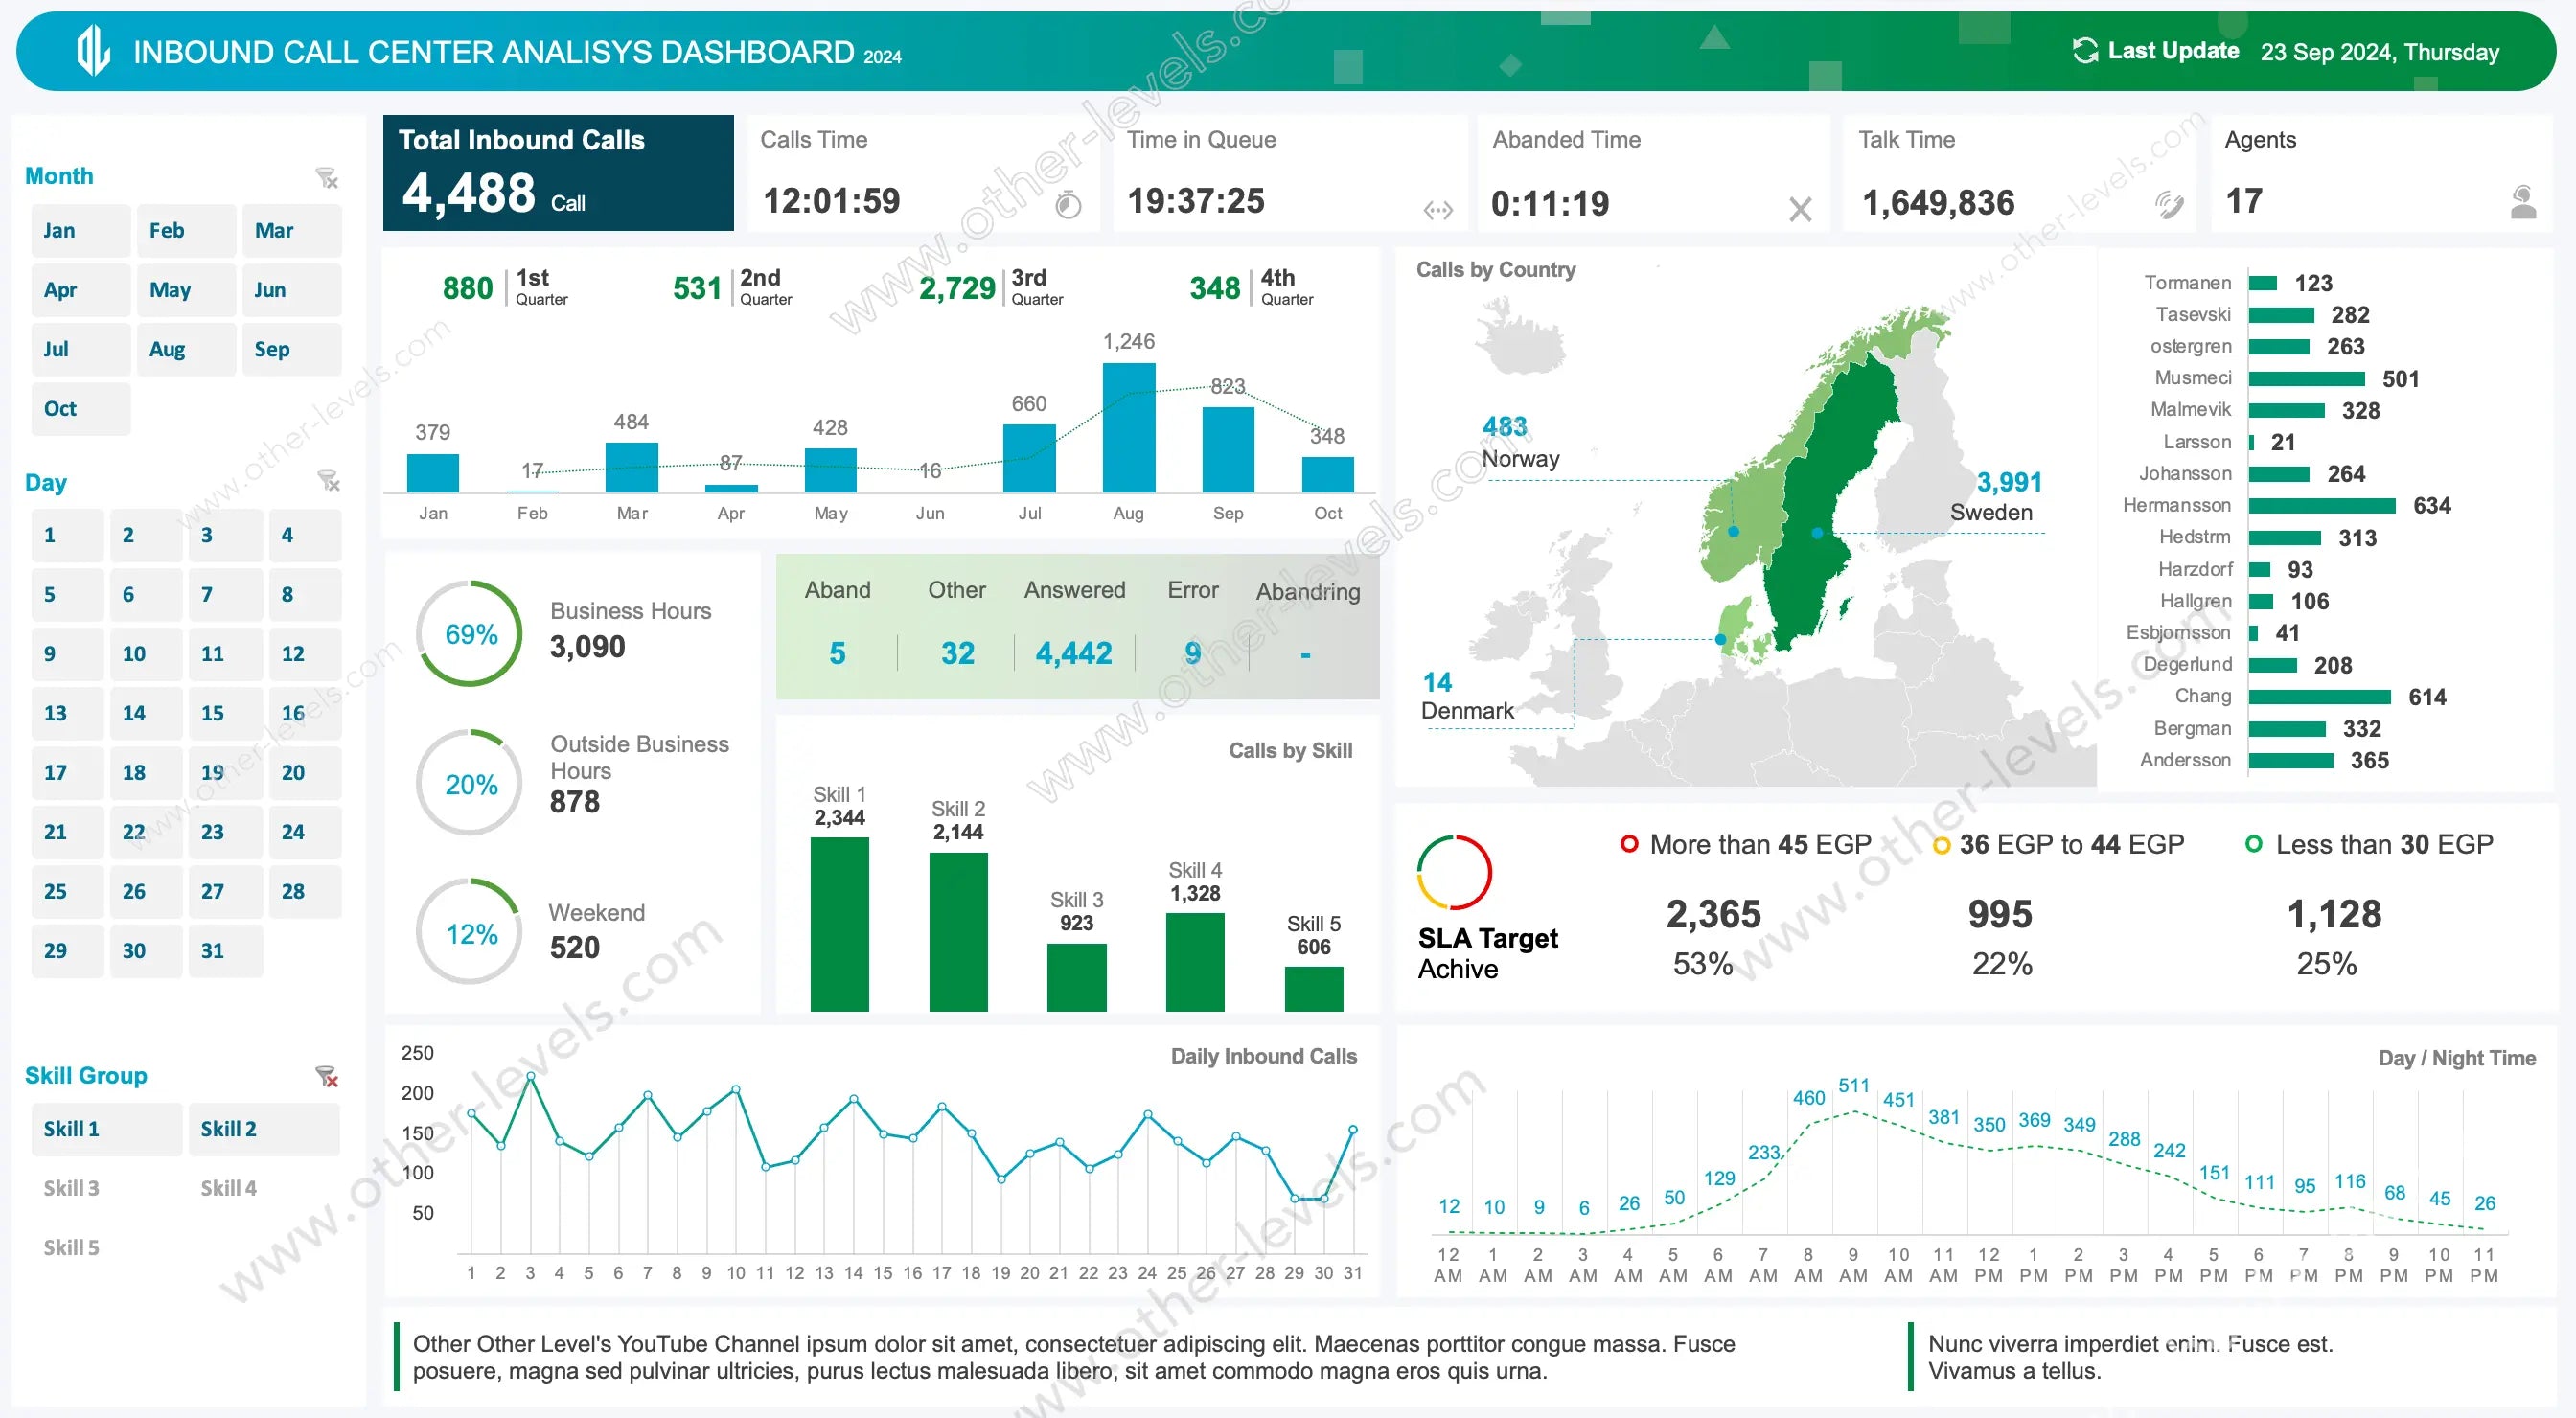
This dynamic dashboard turns complex call center data analytics into visual stories. It covers every angle of inbound call center services—from total calls, queue time, and talk duration to agent efficiency and SLA targets. Interactive slicers for Month, Day, and Skill Group make it easy to filter data instantly, ensuring you stay focused on what matters most.
Visual Analysis & Interactive Charts
- Quarterly and Monthly Call Trends: Column and line charts show seasonal patterns and workload changes.
- Business Hours Breakdown: Donut charts highlight call volumes across working hours, weekends, and off-peak times.
- Agent Performance: Bar charts visualize top-performing agents and identify training needs.
- Geographical Insights: A world map tracks inbound traffic by country for global visibility.
- SLA Achievement: A gauge-style chart shows real-time compliance with service targets.
Smart Filters & User Experience
Interactive filters let you view calls by skill group, period, or specific date—turning a static sheet into a powerful inbound call center solution. Each element updates dynamically, providing instant feedback as you analyze performance trends and team behavior.
Why Choose This Dashboard?
- Monitor and compare call center performance metrics across agents or regions.
- Make confident staffing and scheduling decisions using daily and hourly trend charts.
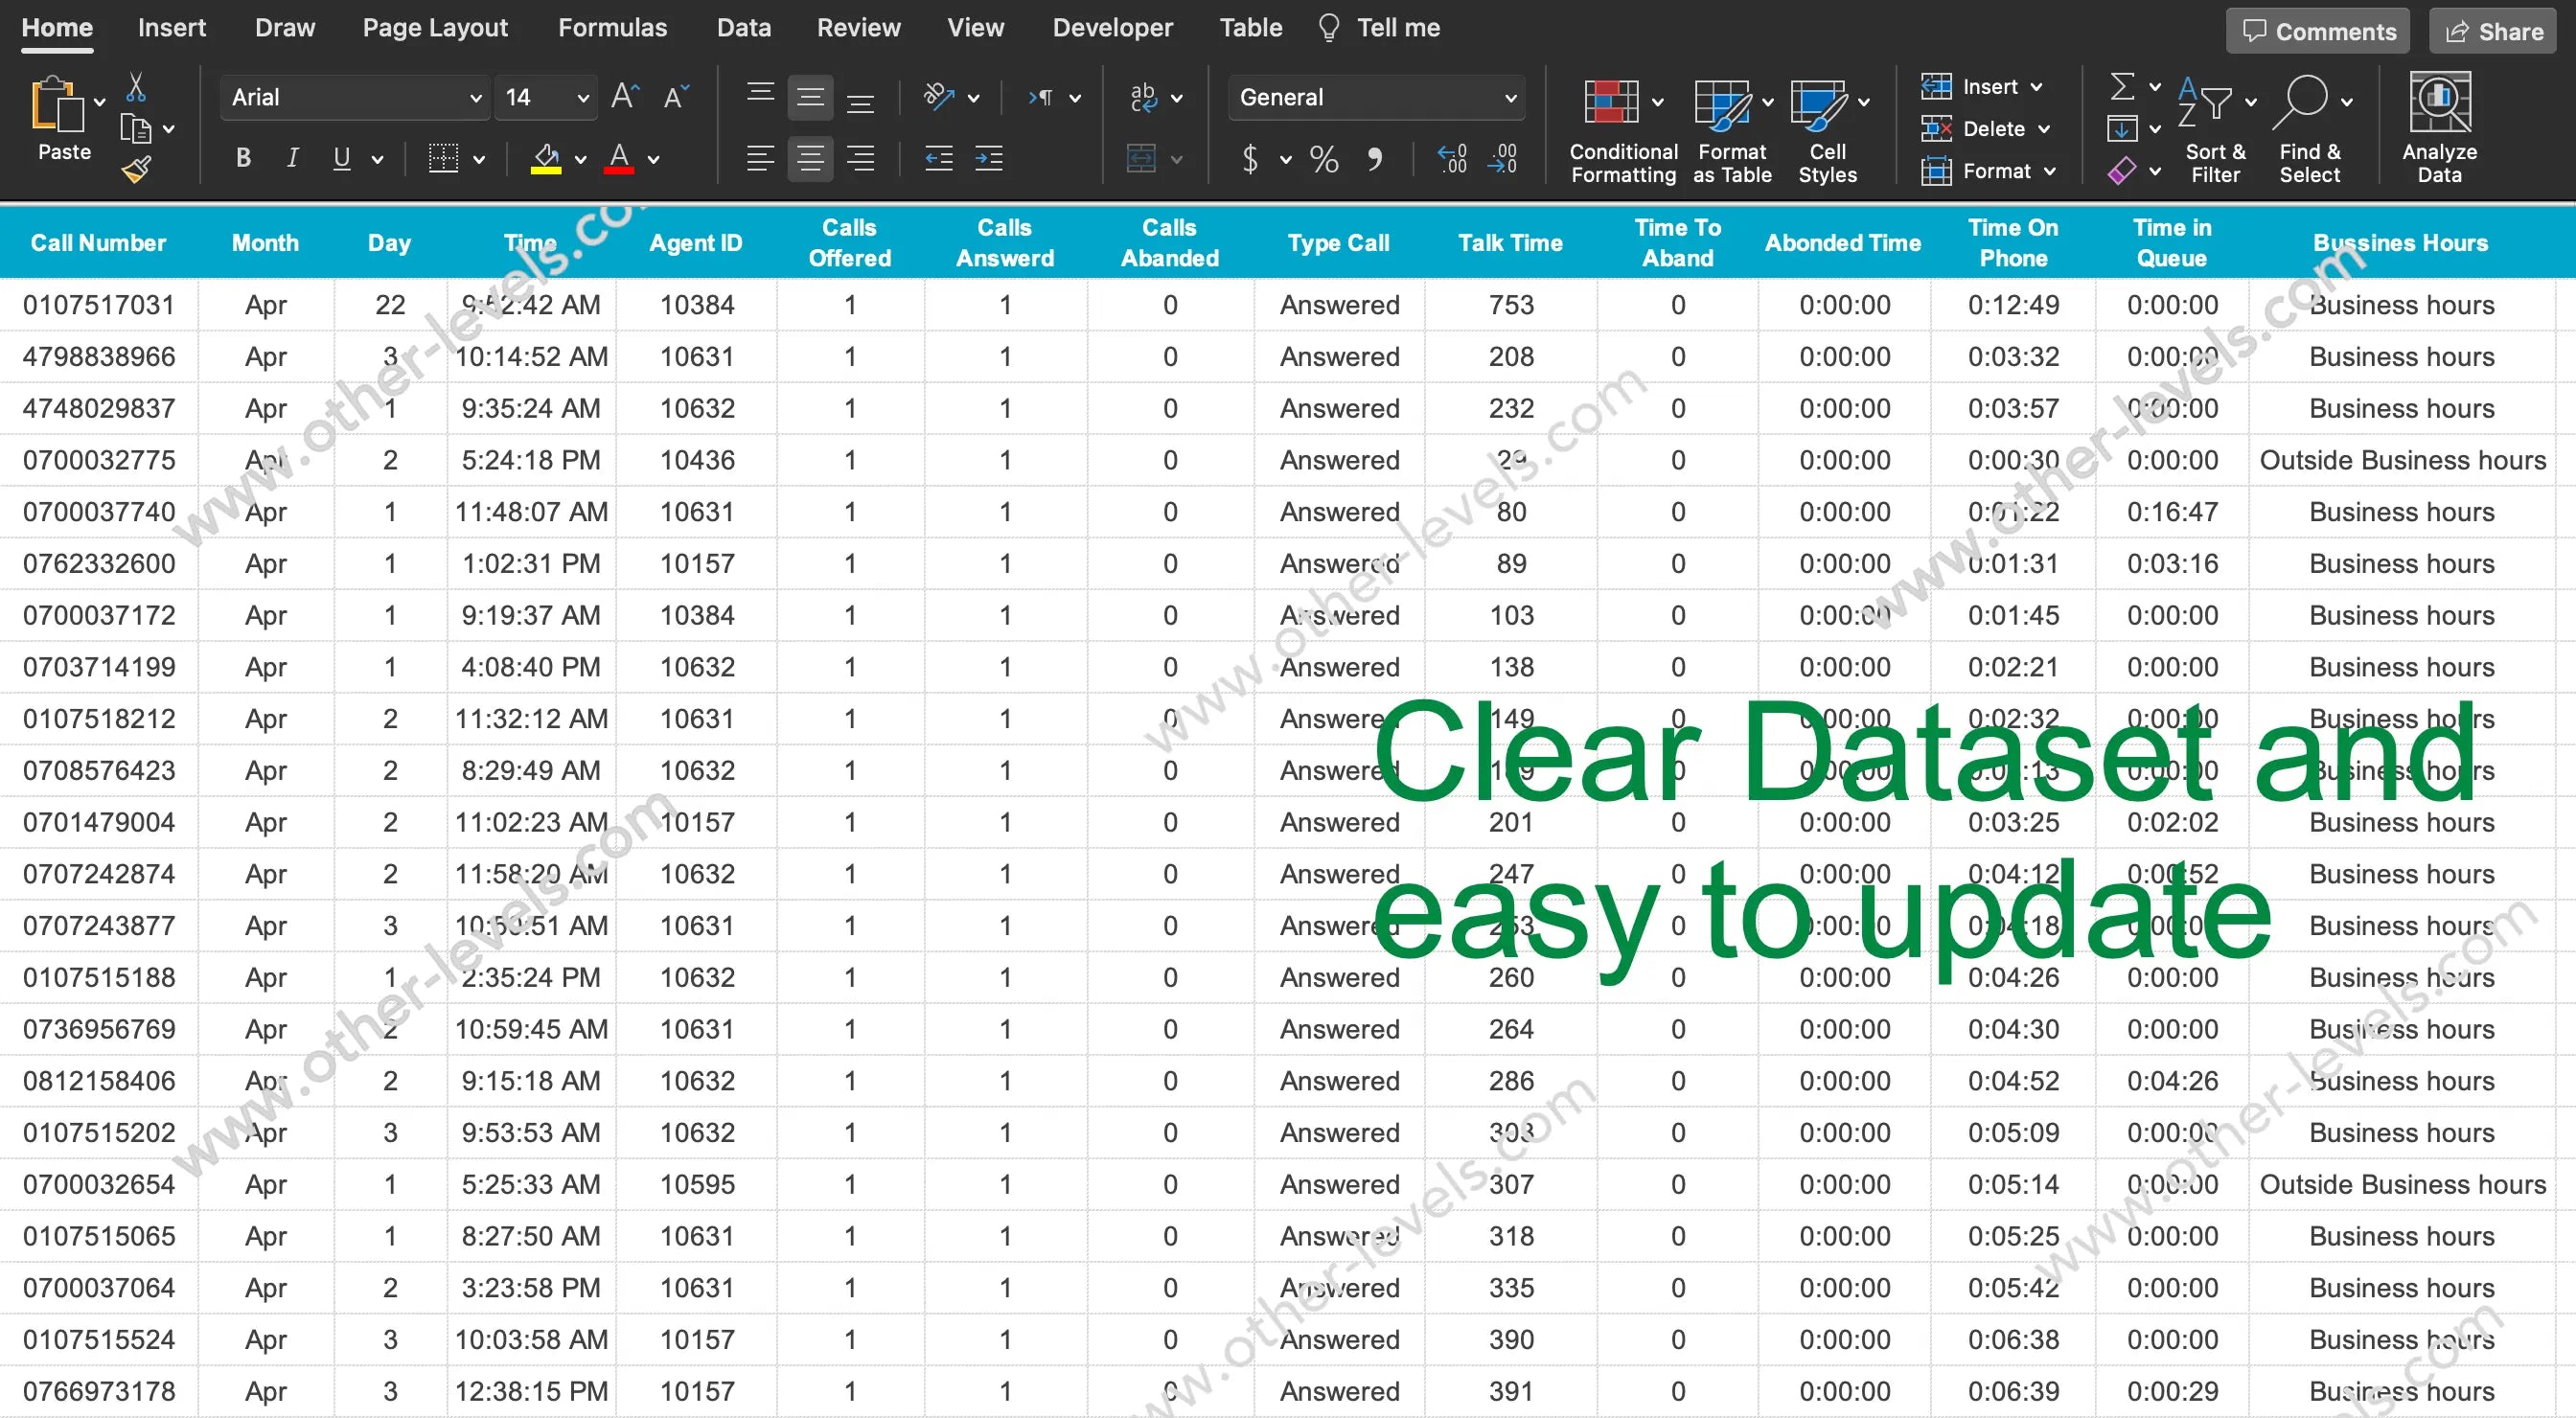
- Adaptable for any inbound call center software data exports—no add-ins required.
- Fully editable will template with clear formatting and intuitive design.
Perfect For
- Operations Managers tracking team efficiency
- Supervisors analyzing response times and SLAs
- Analysts performing call center data analysis
Related Excel Dashboards
Watch the Inbound Call Center Dashboard Tutorial
Inbound Call Center Excel Dashboard tutorial (full video) | Watch the full tutorial on our Other Levels YouTube Channel
Specifications
Get all essential details in one place. From features and package contents to software compatibility and skill level required, this section gives you a clear overview so you know exactly what to expect before download.
Template Features
Package Details
Software Compatibility
Skill Level Required
Intermediate
FAQs
Please read our FAQs page to find out more.
Are the templates fully customizable?
Yes, all our templates are fully customizable. You can adjust the layout, data, and design elements to fit your specific needs. Our templates are designed to be flexible, allowing you to easily tailor them to your preferences.
Can I order a product in any language?
Yes, we provide products in any language. Simply select the "Dashboard language change" Service and once your order is placed, you will receive it within 48 hours.
What happens if I choose the wrong monitor screen size for my dashboard?
If you choose the wrong screen size, the dashboard may not display correctly on your monitor. Elements could appear too large, too small, or misaligned, affecting the readability and usability of the dashboard. We recommend selecting the appropriate screen size to ensure optimal viewing and performance.
Do I need specific skills to use the advanced Excel dashboard templates?
Our advanced Excel dashboards are easy to use, the only thing you need to know is how to work with PivotTables. With basic knowledge of PivotTables, you'll be able to customize and fully utilize these templates effortlessly. "Please check the skill level required"
All dashboards are 100% editable Excel files. Learn how to use them through our video tutorials, included datasets, and lifetime access program.