

Interactive dashboards you can open in a web browser and update from Excel.
Every template in this collection is a complete business dashboard built as a single HTML file. You open it in Chrome, Edge, Firefox or Safari and it runs locally on your own computer, so there is no software to install, no account to create and no Power BI or specialist reporting tool required.
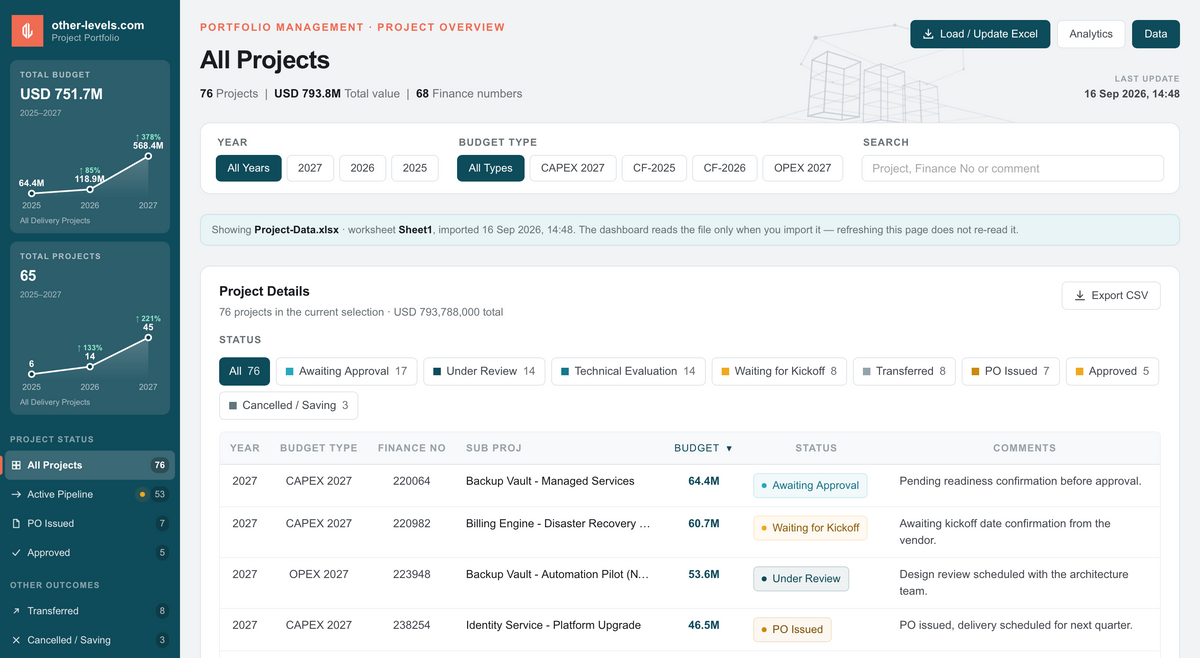
Your data stays somewhere familiar. Each template includes a standard Excel workbook. Enter or paste your own figures, save the file, then load it into the dashboard using the short refresh process explained in the download. The KPIs, charts, filters and tables rebuild around your numbers straight away.
These are working reporting tools rather than static pictures. Filter by period or category, search your records, open individual rows for detail, and export or print what you need.
Use them wherever reporting takes too long: project management, finance, sales, HR and operations. Each one can serve as a KPI dashboard, a management reporting dashboard or an analytics dashboard, depending on the data you put into it.
Every dashboard is a downloadable digital template with clear step-by-step instructions included. No coding is required for normal use.
Explore our curated Excel Dashboard Templates — from Finance and Sales to HR and Inventory dashboards. All templates include step-by-step video tutorials on our Other Levels YouTube Channel.