

Have a spreadsheet full of numbers but no time to build charts? Our new Free Excel Dashboard Maker turns any Excel or CSV file into a clean dashboard in seconds. You upload the file, and the tool builds KPI cards, a trend chart, a top 10 ranking, a share chart and written insights for you. It is free, there is no sign-up, and your data never leaves your browser.
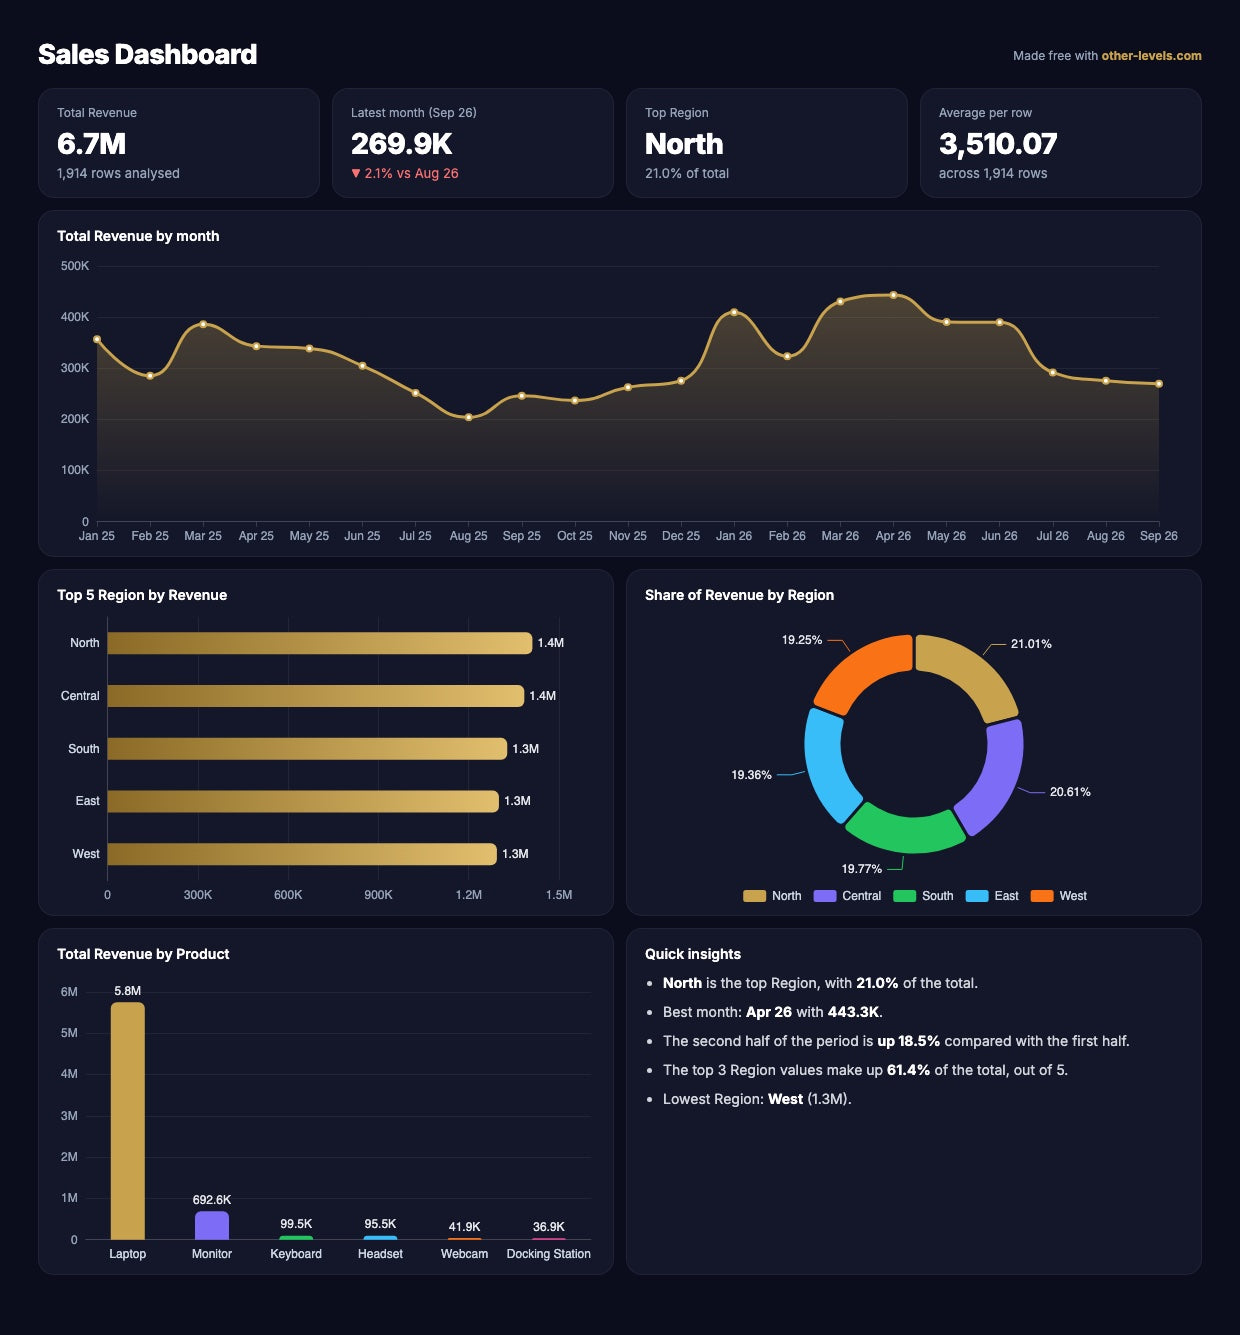
How to turn an Excel sheet into a dashboard in 3 steps
- Prepare a simple table. Put one row of headers at the top (for example Date, Region, Product, Sales) and one record per row below it. Exports from Shopify, QuickBooks, Google Sheets, HR systems and CRMs usually work as they are.
- Upload the file. Open the dashboard maker and drop your .xlsx, .xls or .csv file. The tool finds your date, number and category columns automatically.
- Explore your dashboard. Change the value, the date, the "group by" column and Sum or Average from the menus. The KPIs, charts and insights update instantly.
What the free dashboard generator builds for you
- KPI cards: total, latest month compared with the month before, the top category and the average per row.
- Trend chart: your numbers by day, month or year, picked automatically from your date range.
- Top 10 chart: your best products, regions, departments or customers.
- Share chart: how much each category contributes to the total.
- Second breakdown: the same value split by another column, such as channel or product.
- Quick insights: plain-English notes such as your best month, your top category and whether the second half of the period grew.
Is my data safe?
Yes. The file is read inside your own browser. Nothing is uploaded to our servers or stored anywhere, so you can use it with sales, salary or financial data.
Ideas: dashboards you can make from your files
- Sales dashboard from an order or invoice export: revenue by month, top products and regions.
- Expense dashboard from your accounting export: spending by category and cost center.
- HR dashboard from an employee list: salaries and headcount by department.
- Inventory dashboard from a stock report: stock value by product or warehouse.
- Project dashboard from a task tracker: budget or hours by project and owner.
No data at hand? Download one of our free practice datasets and try it.
Need a dashboard you can edit and reuse?
The free tool gives you a quick picture of your data. When you need a file that updates when your data changes, with slicers, drill-downs and your branding, you have two options:
- Start from one of our 100+ ready-made Excel dashboard templates.
- Let our team build a custom dashboard in Excel, Google Sheets or Power BI on your own data.

Share:
Weekly, Monthly and Annual KPI Report Template in Excel