✅ Instant Digital Delivery | 🔒 Secure Checkout | ⭐ Trusted by 1,000+ Professionals | 💬 24hr Support
Student Performance & At-Risk Excel Dashboard - Attendance & Homework
Pairs well with
Student Performance & At-Risk Excel Dashboard - Attendance & Homework
This Excel Dashboard is built for schools that want a faster, clearer way to spot academic risk early—before it turns into missed targets, unhappy parents, or end-of-term surprises. Picture a grade-level meeting where everyone argues from different spreadsheets. This dashboard replaces that chaos with one view that aligns the team on what matters: performance levels, risk drivers, and where support should go next.
Excel Dashboard Overview
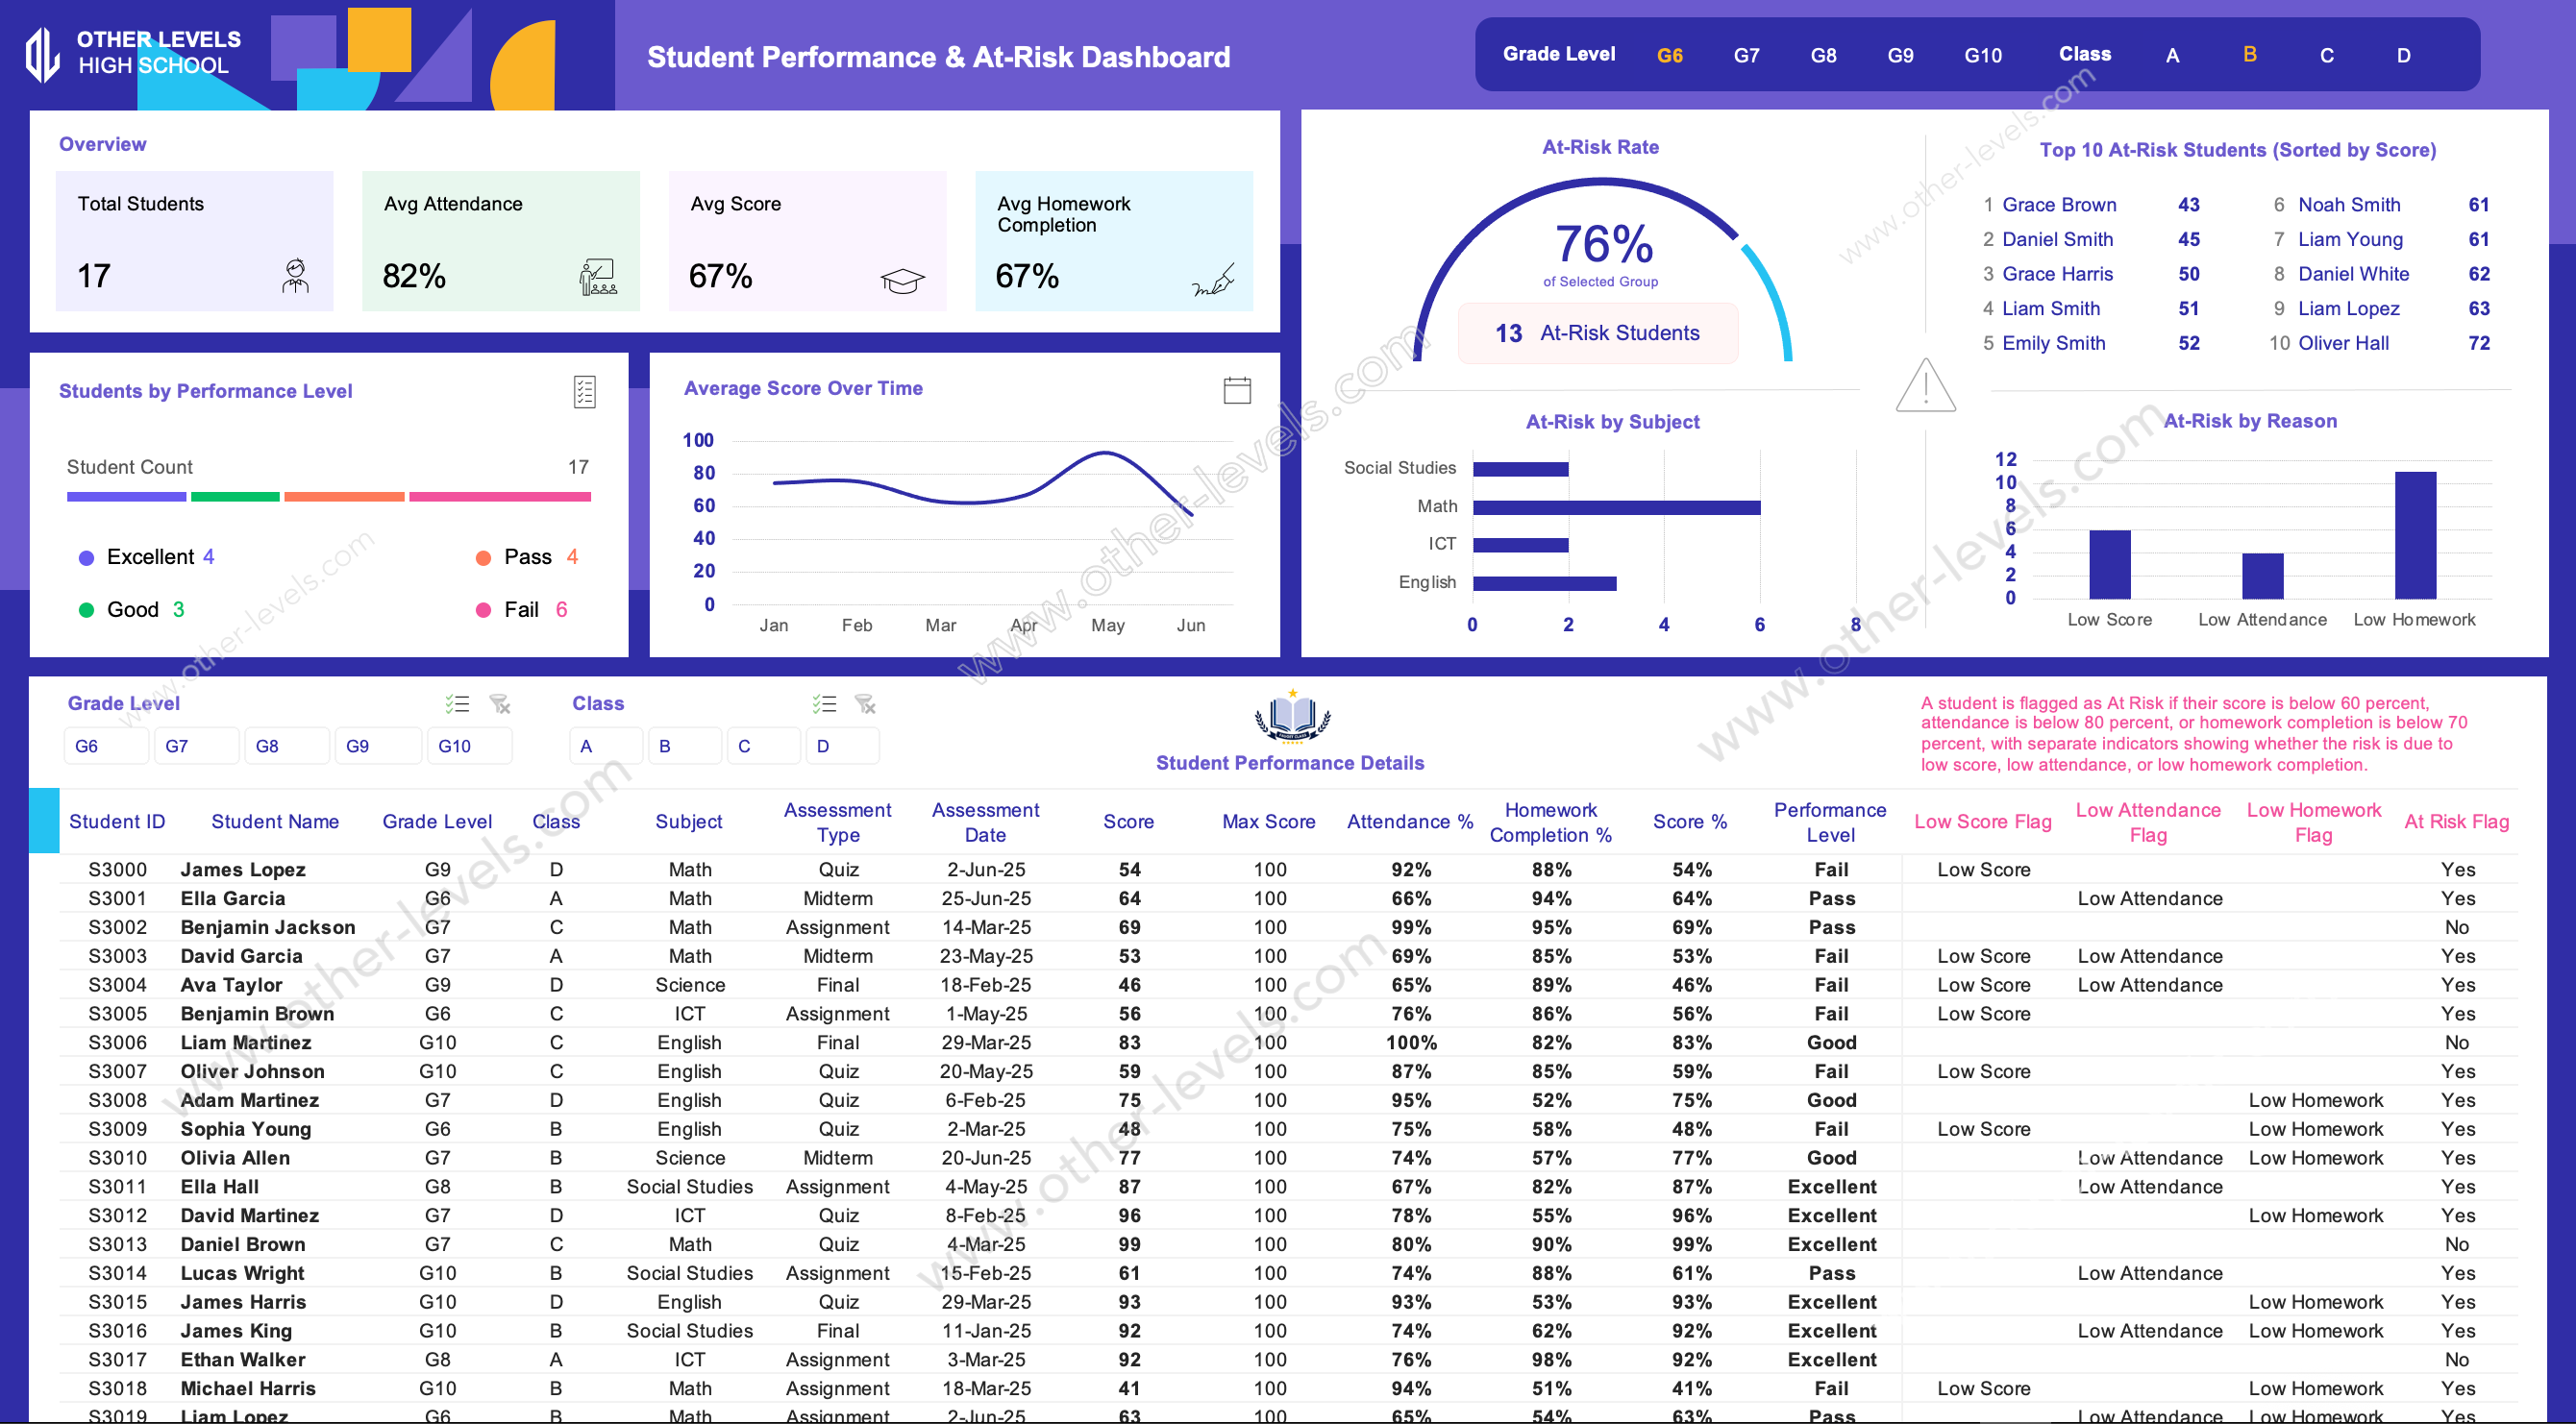
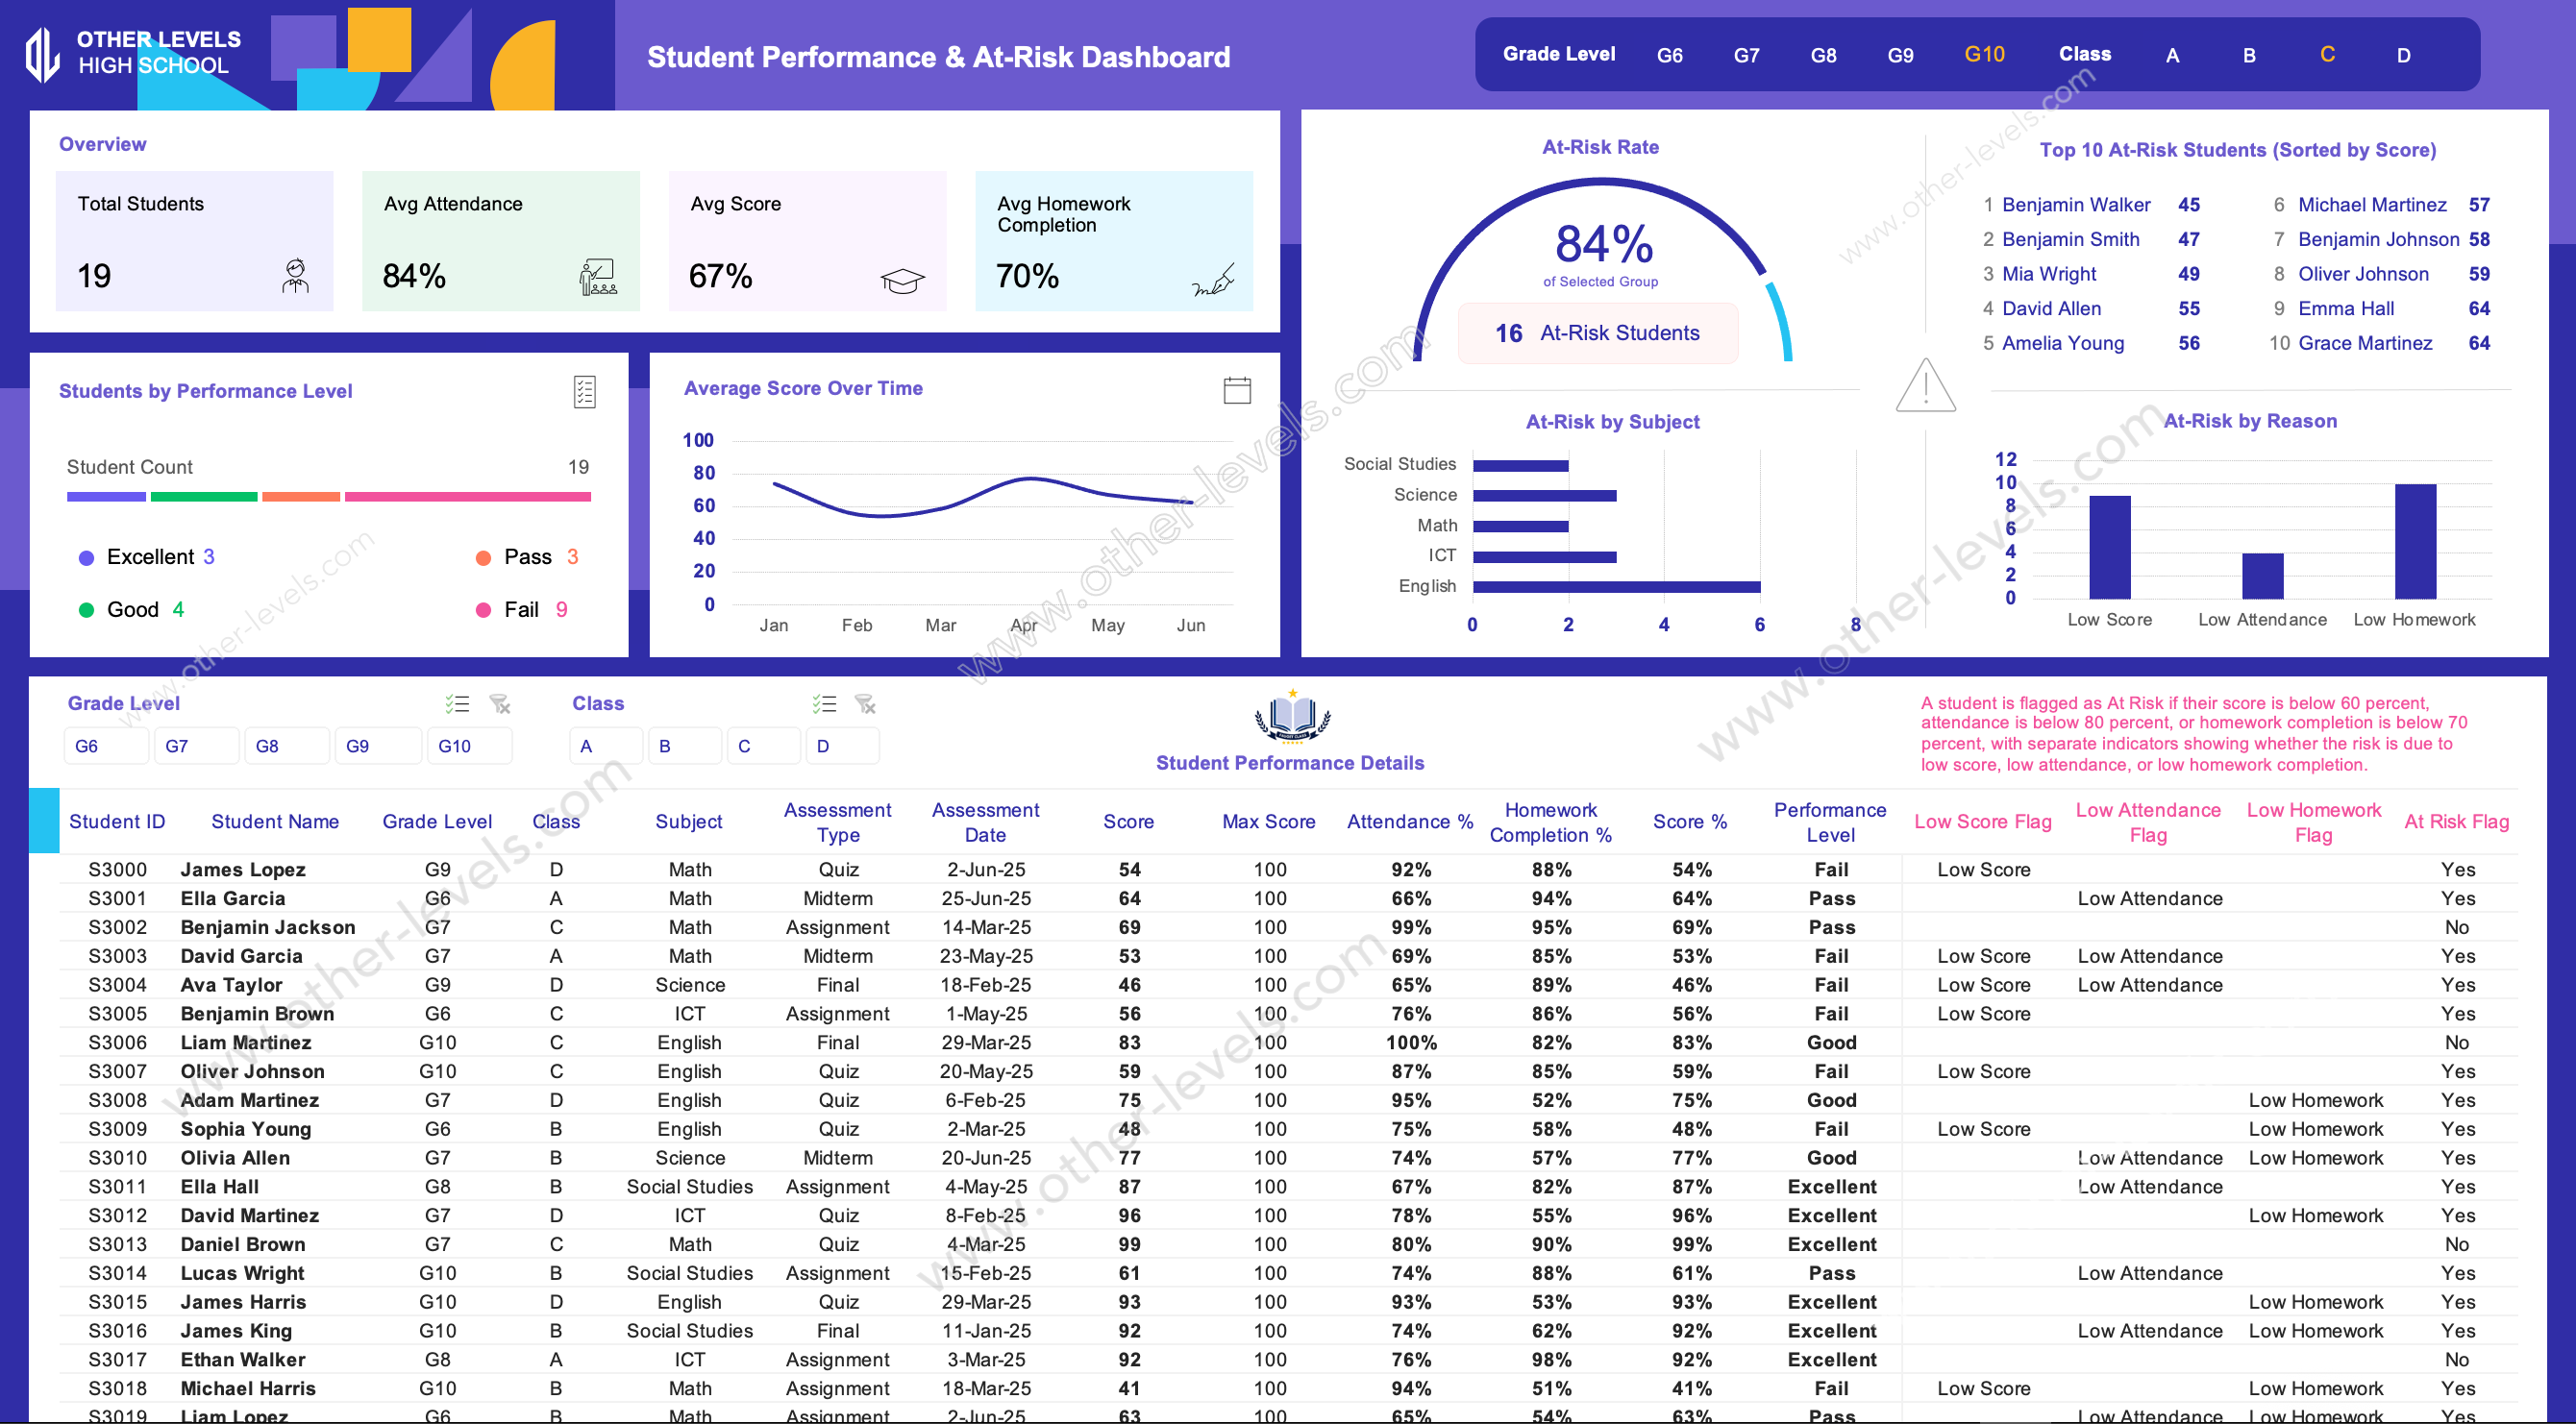
Use it to monitor student achievement alongside engagement signals like attendance and homework completion. Instead of hunting through rows, you filter by grade and class, and the dashboard tells the story: how the group is performing, who needs attention first, and what the most common risk reasons are.
What You Can Analyze
- Performance distribution by level (Excellent, Good, Pass, Fail) for quick group profiling.
- Score trends over time to spot improvement, decline, or instability across periods.
- At-risk insights that separate academic risk from engagement risk.
- Subject hot spots to identify where intervention will have the biggest impact.
Charts Included (Titles & Types)
- Students by Performance Level (Horizontal stacked bar)
- Average Score Over Time (Line chart)
- At-Risk Rate (Gauge / semi-donut indicator)
- Top 10 At-Risk Students (Sorted by Score) (Ranked list)
- At-Risk by Subject (Horizontal bar chart)
- At-Risk by Reason (Column chart)
Key Features
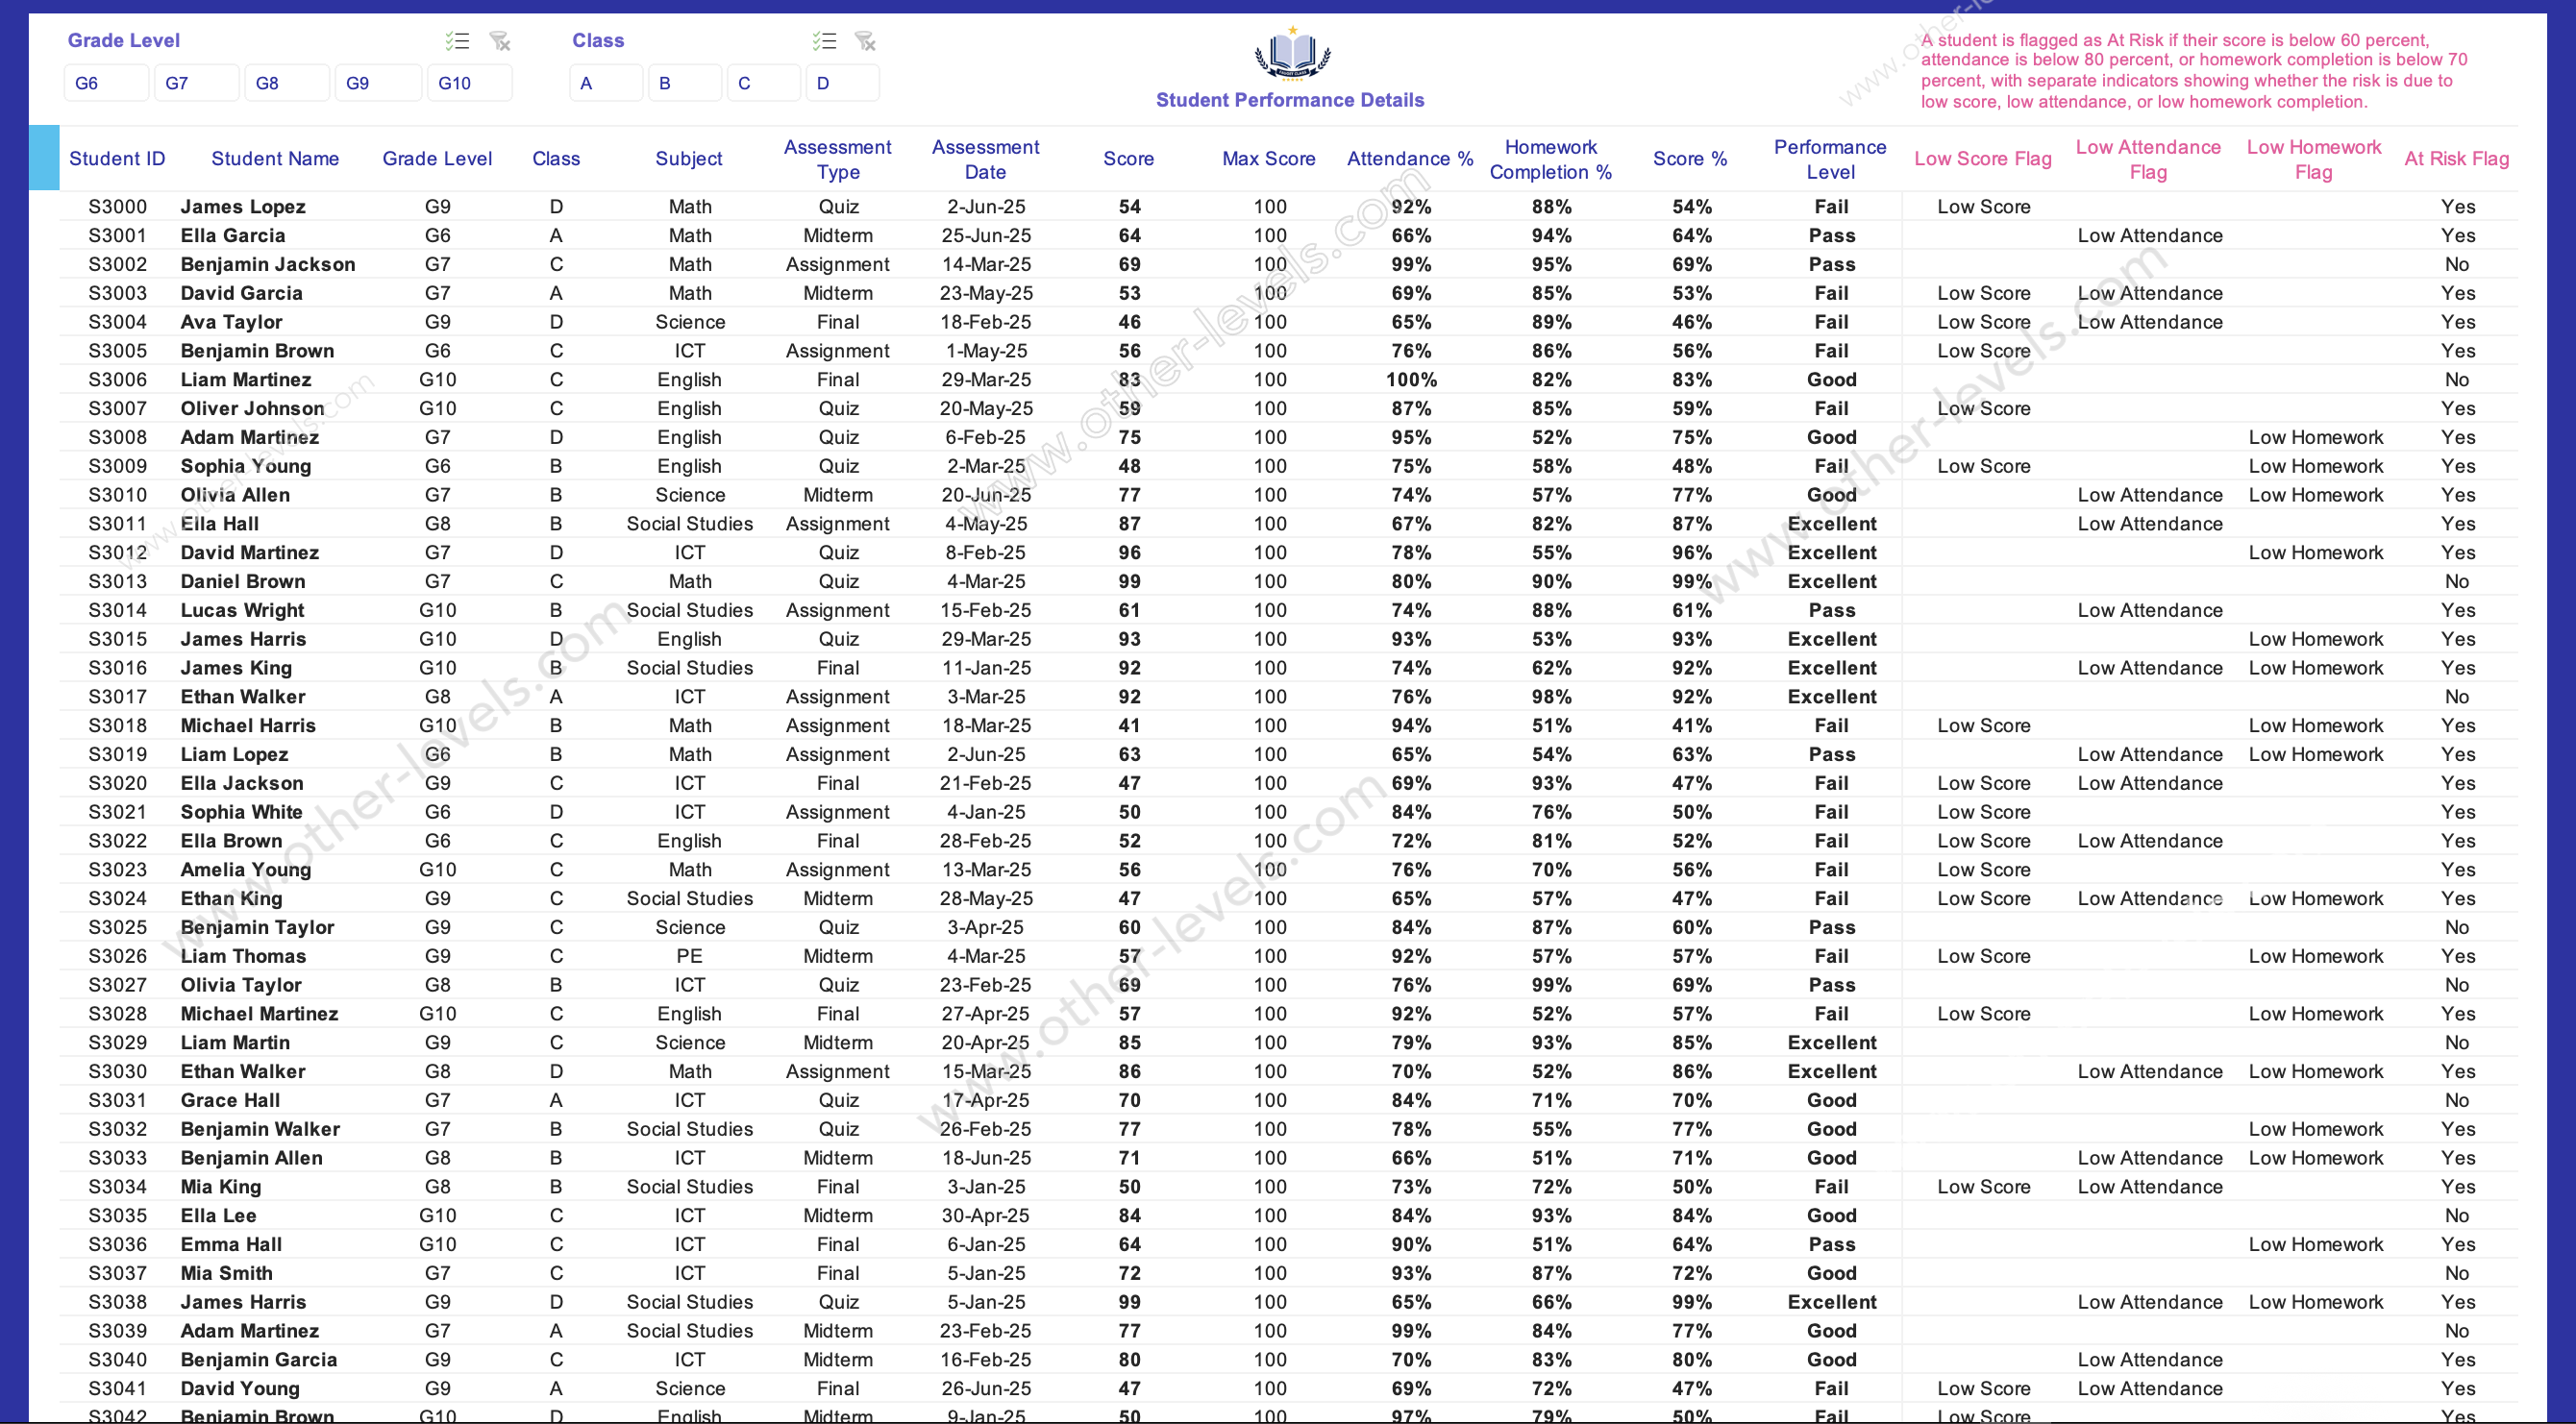
- Interactive filters for Grade Level and Class to focus analysis instantly.
- Automated flag logic that highlights Low Score, Low Attendance, and Low Homework drivers.
- Student-level drill-down table with assessment context, percentages, and risk indicators.
- Clean, print-friendly layout that works for leadership reviews and staff meetings.
Who This Is For
- School leaders who need analytics for education without complicated tools.
- Teams preparing a simple school performance fact sheet for internal reporting.
- Coordinators handling student enrollment growth who want visibility into outcomes.
- Admins looking for data analytics for schools to support faster interventions.
How It Helps in Real Work
In practice, it becomes your weekly check-in tool. One glance shows whether a class needs attendance follow-up, homework routines, or academic support. If you’re building repeatable reporting across terms, this can act as a will template for consistent tracking.
Use Cases
- Grade-level performance reviews and intervention planning
- Subject-level support targeting and resource allocation
- Term-by-term monitoring using analytics for education to guide actions
- Operational reporting aligned with how to manage a school successfully principles
Related Excel Dashboard Templates
- Customer Satisfaction Score and SLA metrics Excel Dashboard for teams that want a KPI-driven reporting view with clear analytics for education-style accountability.
- Mega Project Cashflow and Funding Strategy Masterplan Excel Dashboard if you also manage planning workflows and need a structured approach to how to manage school projects.
Specifications
Get all essential details in one place. From features and package contents to software compatibility and skill level required, this section gives you a clear overview so you know exactly what to expect before download.
Template Features
Package Details
Software Compatibility
Skill Level Required
Beginner
FAQs
Please read our FAQs page to find out more.
Are the templates fully customizable?
Yes, all our templates are fully customizable. You can adjust the layout, data, and design elements to fit your specific needs. Our templates are designed to be flexible, allowing you to easily tailor them to your preferences.
Can I order a product in any language?
Yes, we provide products in any language. Simply select the "Dashboard language change" Service and once your order is placed, you will receive it within 48 hours.
What happens if I choose the wrong monitor screen size for my dashboard?
If you choose the wrong screen size, the dashboard may not display correctly on your monitor. Elements could appear too large, too small, or misaligned, affecting the readability and usability of the dashboard. We recommend selecting the appropriate screen size to ensure optimal viewing and performance.
Do I need specific skills to use the advanced Excel dashboard templates?
Our advanced Excel dashboards are easy to use, the only thing you need to know is how to work with PivotTables. With basic knowledge of PivotTables, you'll be able to customize and fully utilize these templates effortlessly. "Please check the skill level required"
All dashboards are 100% editable Excel files. Learn how to use them through our video tutorials, included datasets, and lifetime access program.