

Sales Analysis and Sales Growth Dashboard Templates – Excel
Pairs well with
Overview: Sales Analysis and Growth Excel Dashboard
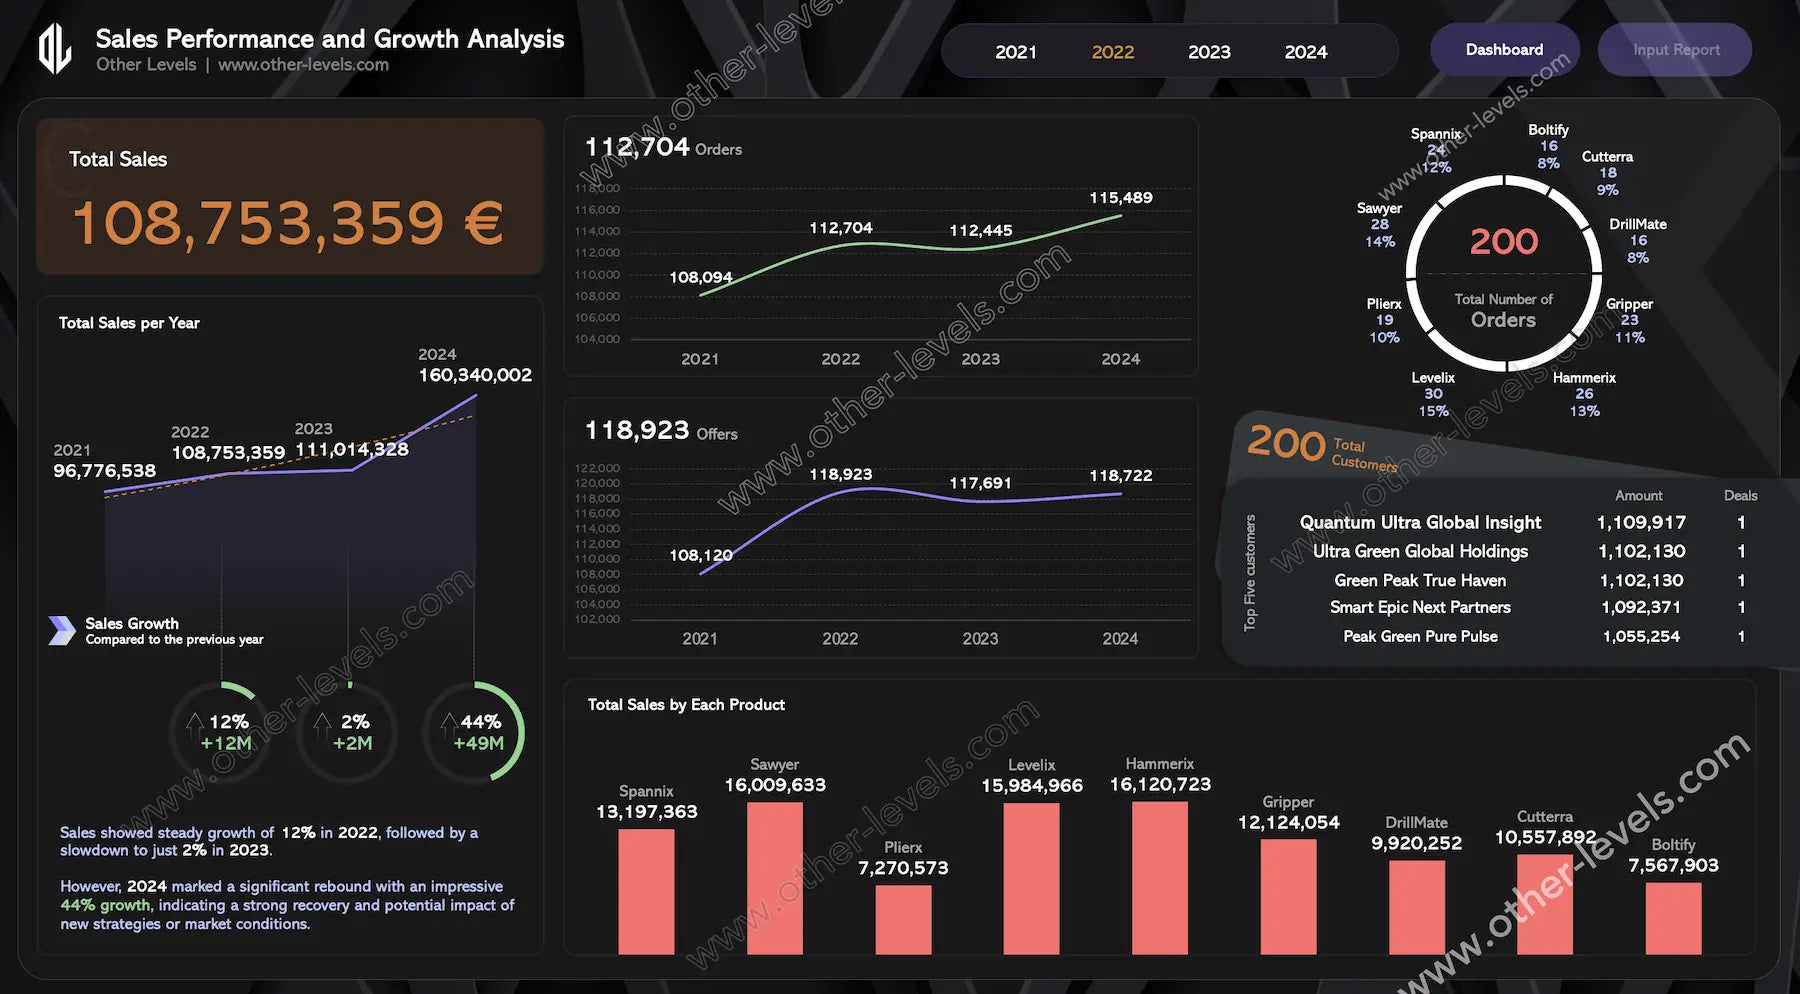
Here’s the thing—teams drown in tabs fast. This Excel Dashboard from our Dashboard Templates lineup keeps everything tidy and readable. You get clean sales analysis, quick stories for stakeholders, and space for deeper sales data analysis when you need it. In practice, it’s built to show momentum and real sales growth without the clutter.
Related Dashboards for Next-Level Insights
Want to go further—either on sales intelligence or finance? These two pair perfectly with this dashboard:
- Advanced Sales Intelligence Dashboard - Excel Sales Insights
- Dynamic Profit & Loss Dashboard with Interactive Slicers & Smart Indic.
What You Get at a Glance
- Total Sales and Total Orders for instant scale.
- Total Offers to read pipeline activity early.
- Distinct Total Customers for reach and retention signals.
- average order value to spot pricing and mix shifts.
- sales kpis that roll up the story without manual work.
- Clear sales metrics and extra sales metrics to track when you want more depth.
Trends You Can Explain in a Meeting
Year-over-Year Sales Trend
You’ll notice a smooth line that makes direction obvious. Call out improvements, plateaus, or dips in seconds—perfect when someone asks “what changed?” It’s the heartbeat of sales growth.
Orders Trend
Volume tells its own story. This view separates throughput from revenue so you can see pace even when pricing shifts.
Offers Trend
Here’s where the pipeline begins. Track quoting patterns and spot slowdowns before they become missed targets.
Products and Customers That Move the Needle
Product Mix
A donut shows share by product—fast. You’ll notice leaders and gaps right away.
Sales by Product
A ranked column chart compares products side by side. Simple, visual, and great for portfolio decisions.
Top Customers
A concise leaderboard highlights key accounts by revenue and deals. It’s the short list your account team needs.
Customer Engagement
Use customer engagement metrics with a practical customer engagement strategy to read repeat behavior, quote cadence, and growth opportunities.
Sales Team Coaching
Filters make it easy to view performance through a salesperson manager lens. Compare pipelines and coach with data-backed salesperson strategies—no guesswork, no hunting across tabs.
Data Model and Setup
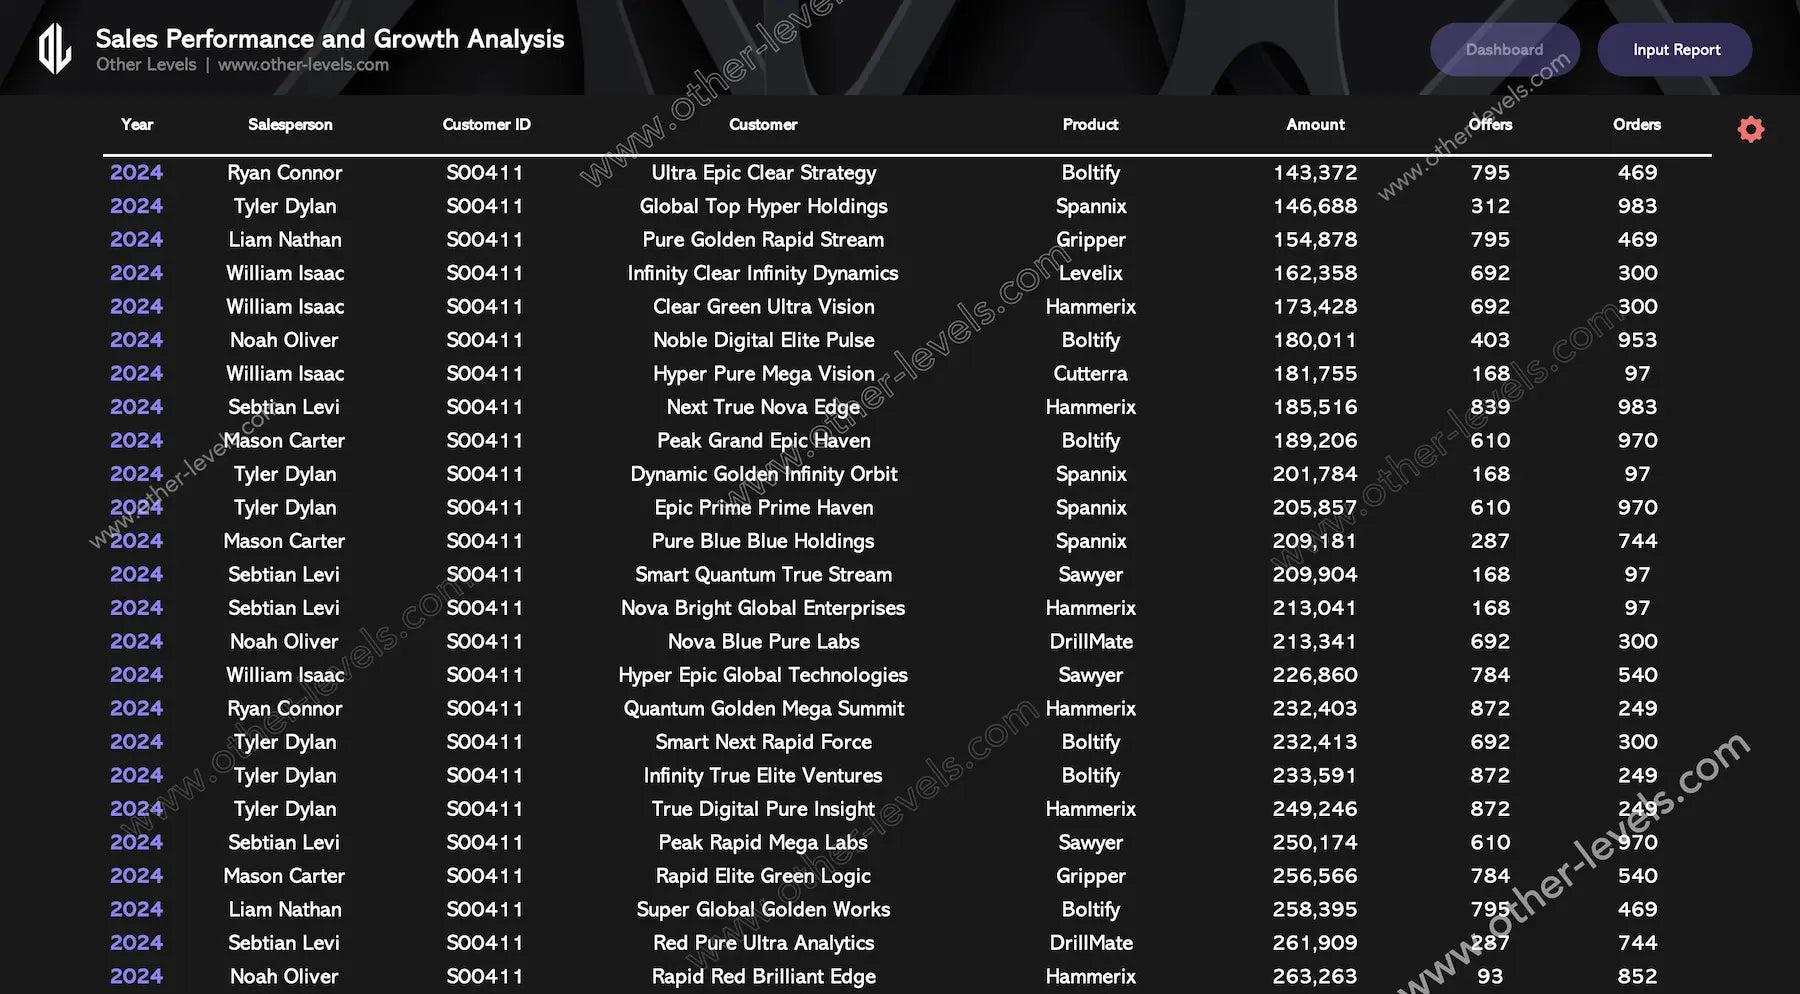
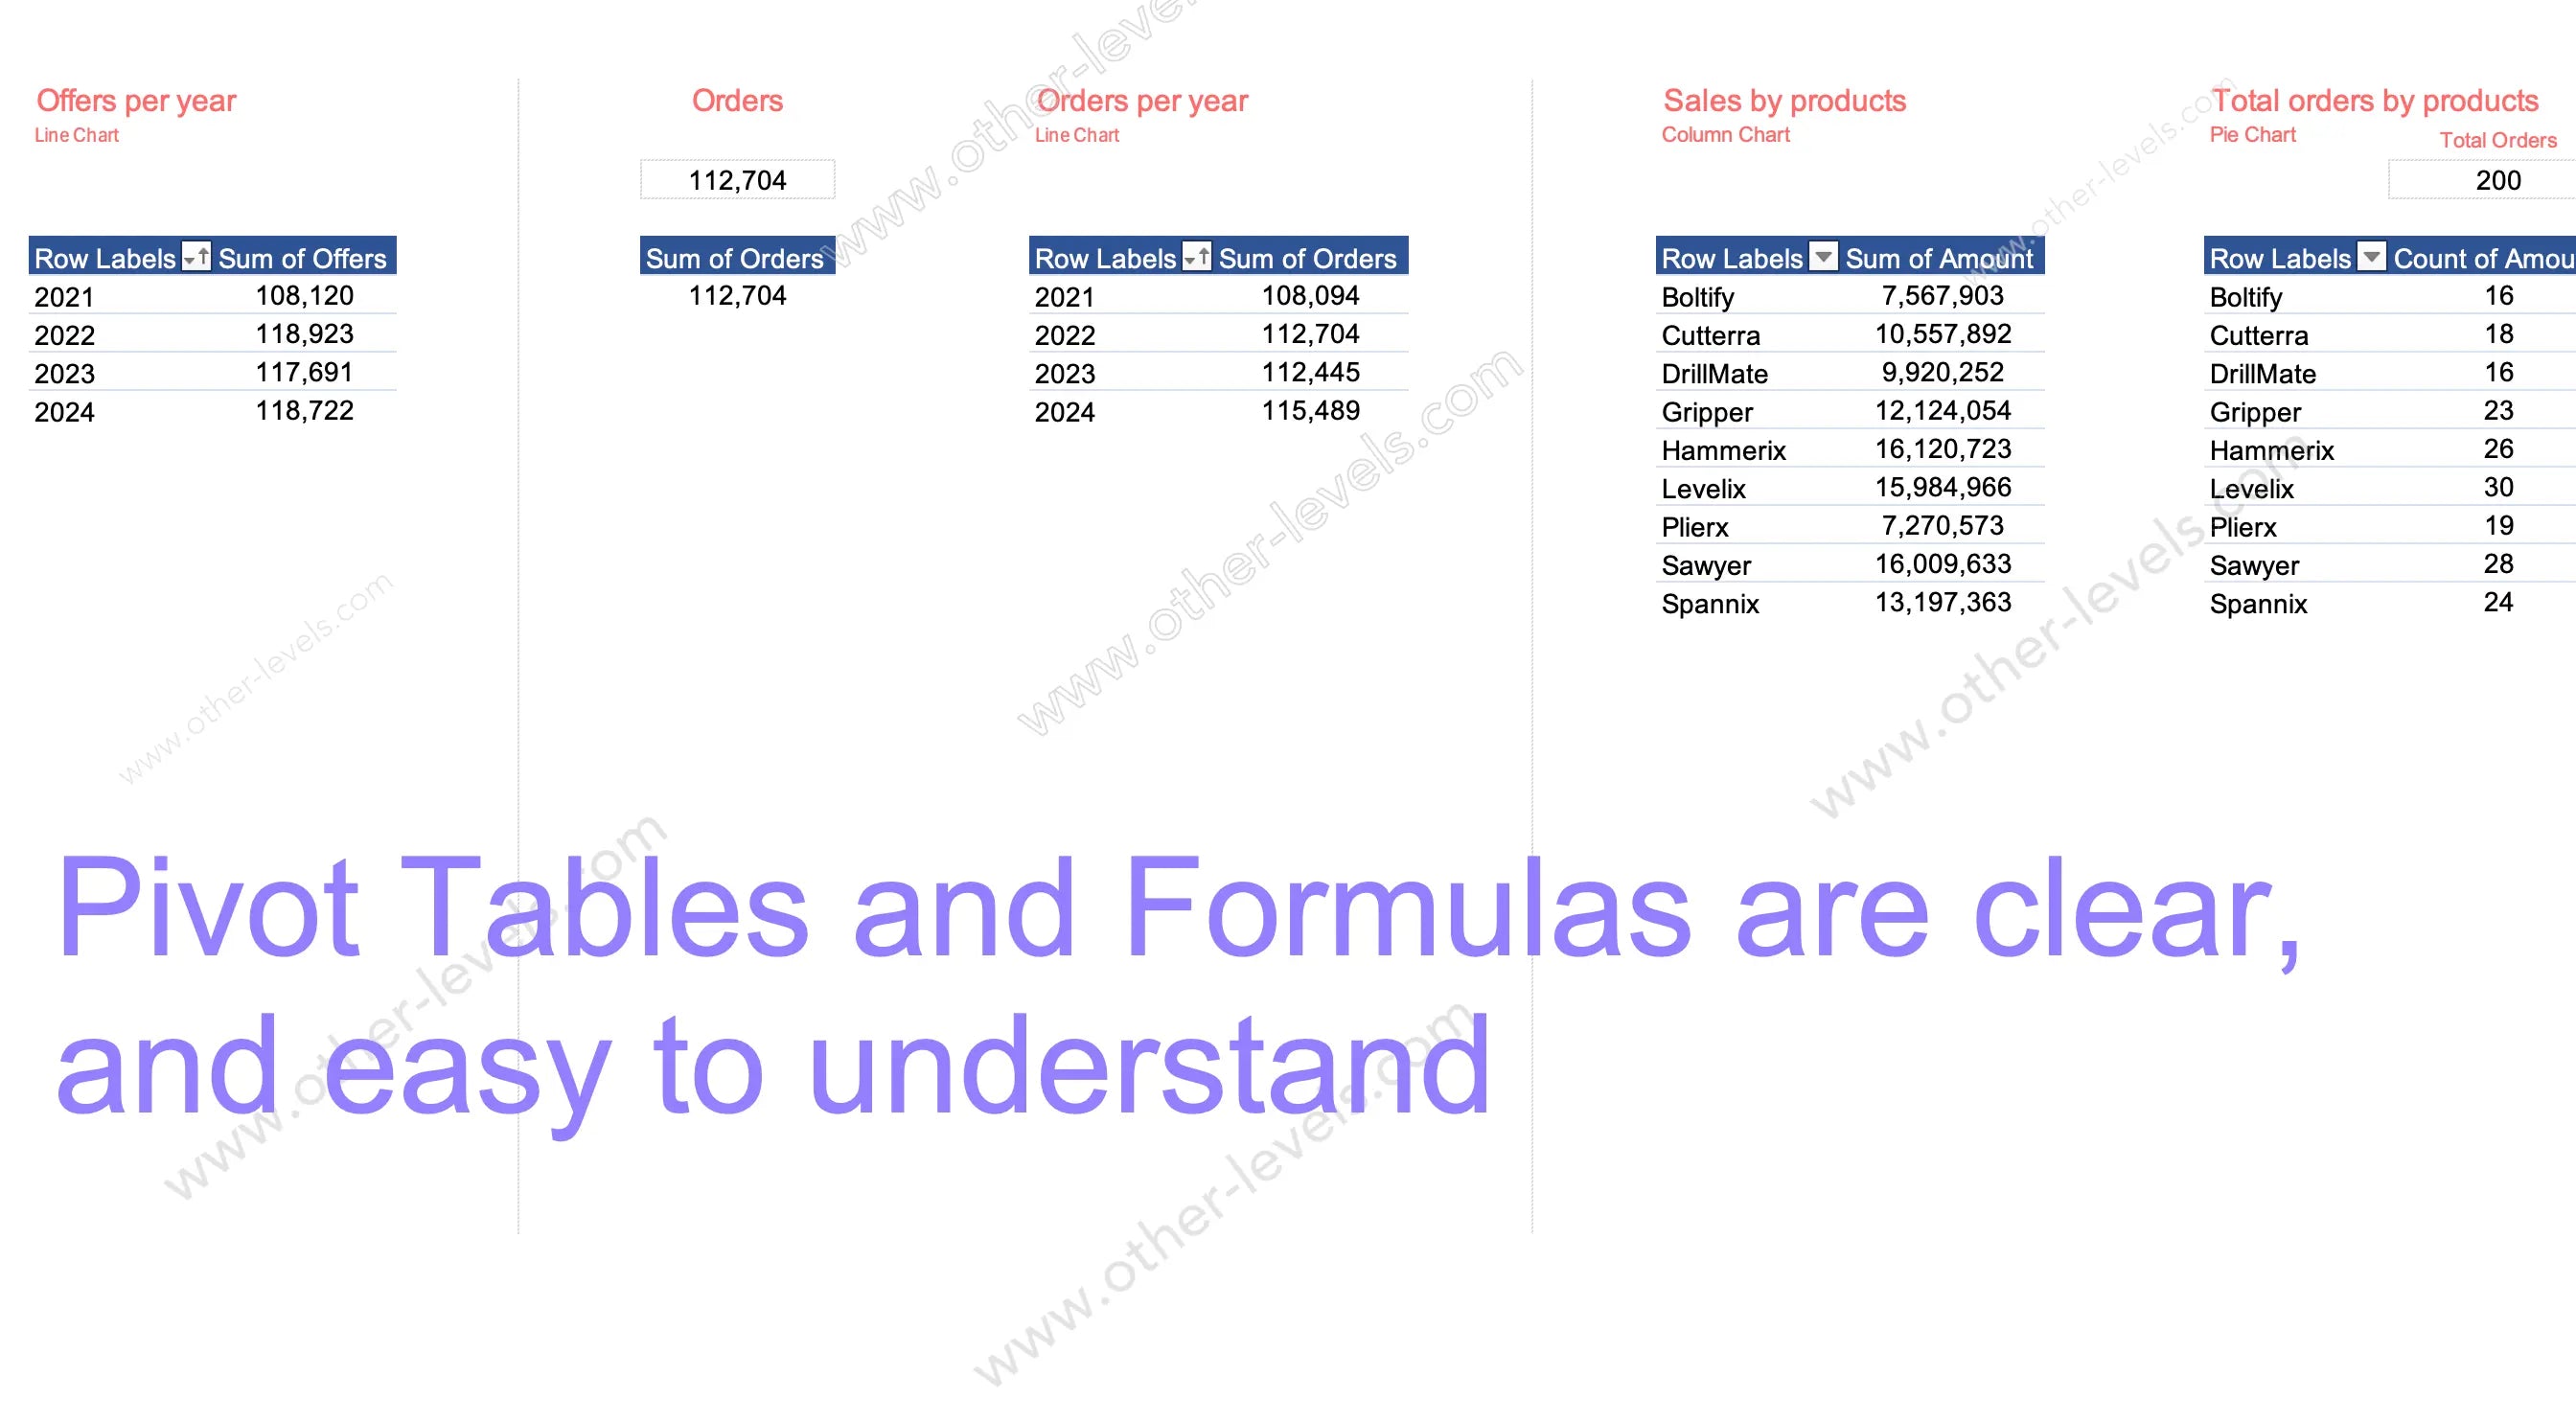
A single tidy data model powers the whole page. Paste new rows, refresh, done. If you want to explore ad-hoc views, just create pivottable in excel from the same source and you’re off.
Interactivity and Navigation
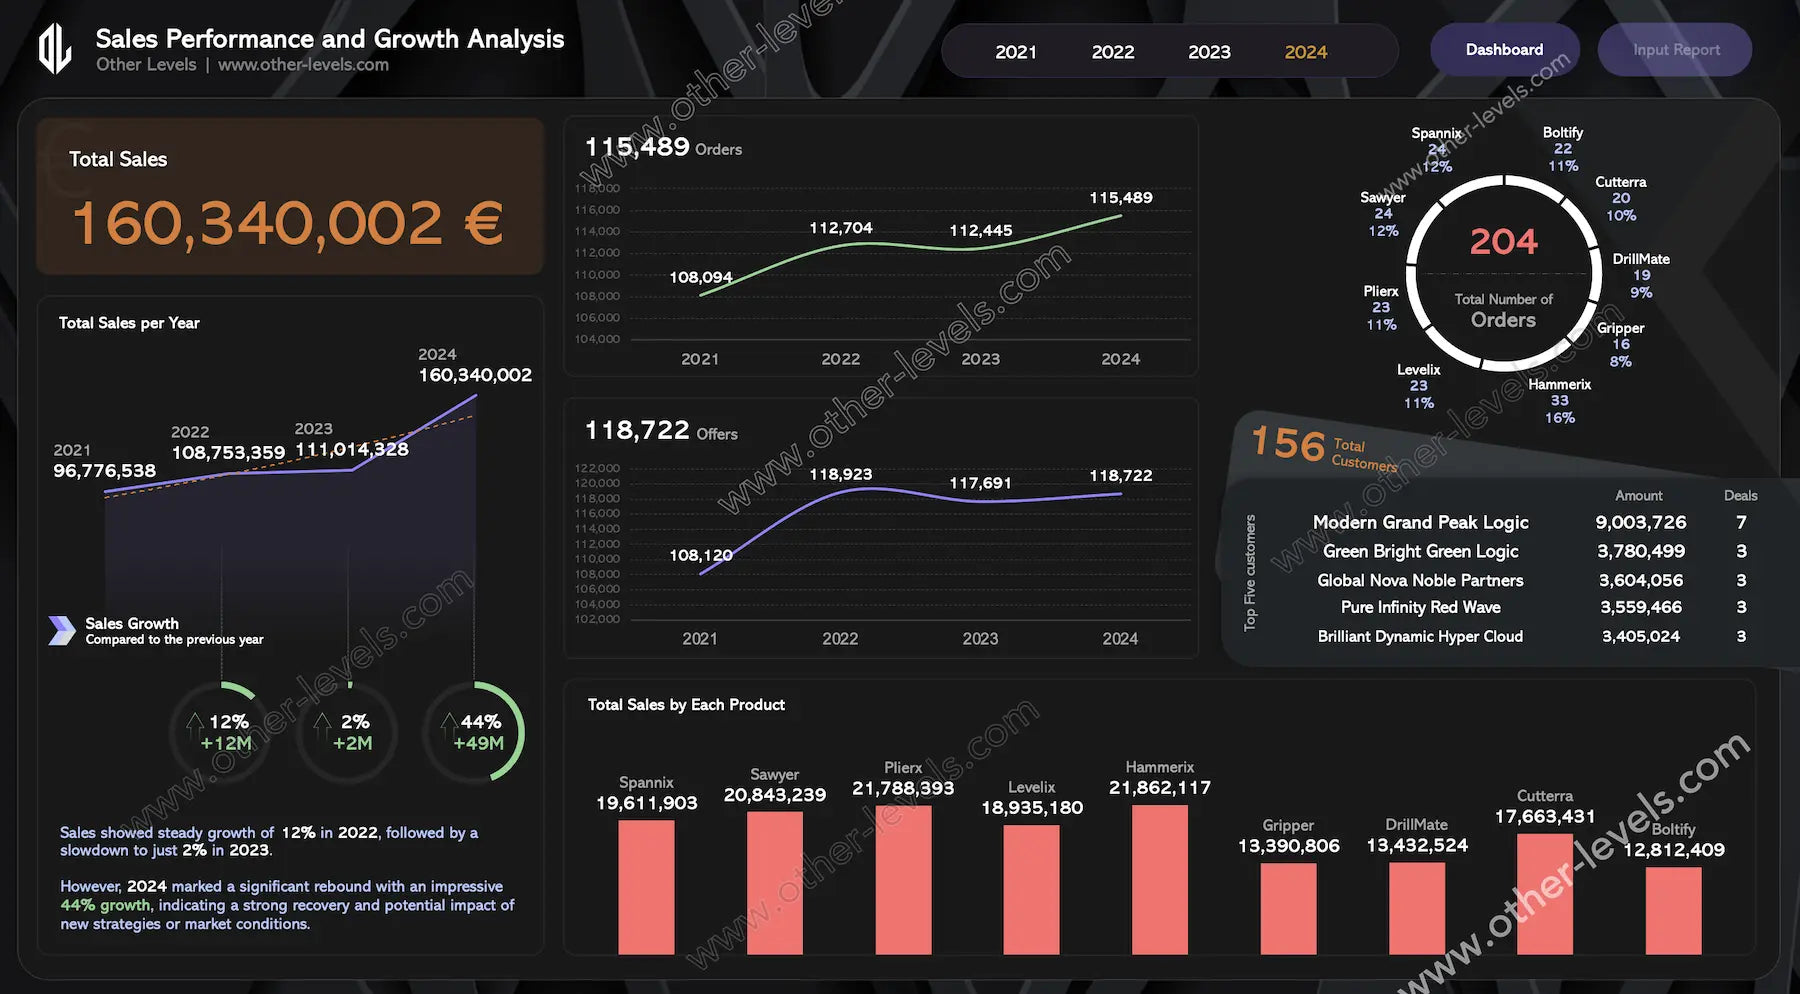
- Year toggles filter every visual together—no broken context.
- Quick buttons jump between the dashboard and the input table.
- Everything stays synced, so the story matches end to end.
How to Use It
- Add your rows to the Input sheet using the provided headers.
- Refresh all—charts and cards update instantly.
- Pick a year (or a few). Start with KPIs, then scan trends, product mix, product ranking, and top customers.
- Drill by product, rep, or customer. Share the view; keep the context.
Customize to Your Workflow
- Add slicers for product and salesperson for faster reviews.
- Expose extra diagnostics like win rate, cycle time, and quote aging alongside your sales metrics to track.
- Need cost views too? Extend the source to cover spending categories and align with excel format for expense reports in finance.
Questions This Dashboard Answers
- Are we growing, and where is that growth really coming from?
- Which products lead, and which need focus?
- Who are our most valuable customers right now?
- Which sales metrics explain momentum—today, this quarter, and this year?
Video Tutorial: Sales Performance and Growth Analysis in Excel
Specifications
Get all essential details in one place. From features and package contents to software compatibility and skill level required, this section gives you a clear overview so you know exactly what to expect before download.
Template Features
Package Details
Software Compatibility
Skill Level Required
Intermediate
FAQs
Please read our FAQs page to find out more.
Are the templates fully customizable?
Yes, all our templates are fully customizable. You can adjust the layout, data, and design elements to fit your specific needs. Our templates are designed to be flexible, allowing you to easily tailor them to your preferences.
Can I order a product in any language?
Yes, we provide products in any language. Simply select the "Dashboard language change" Service and once your order is placed, you will receive it within 48 hours.
What happens if I choose the wrong monitor screen size for my dashboard?
If you choose the wrong screen size, the dashboard may not display correctly on your monitor. Elements could appear too large, too small, or misaligned, affecting the readability and usability of the dashboard. We recommend selecting the appropriate screen size to ensure optimal viewing and performance.
Do I need specific skills to use the advanced Excel dashboard templates?
Our advanced Excel dashboards are easy to use, the only thing you need to know is how to work with PivotTables. With basic knowledge of PivotTables, you'll be able to customize and fully utilize these templates effortlessly. "Please check the skill level required"
All dashboards are 100% editable Excel files. Learn how to use them through our video tutorials, included datasets, and lifetime access program.

