Next Gen Personal Finance App – Excel Mobile Template Pack
Pairs well with
Next Gen Personal Finance App – Excel Mobile Template Pack
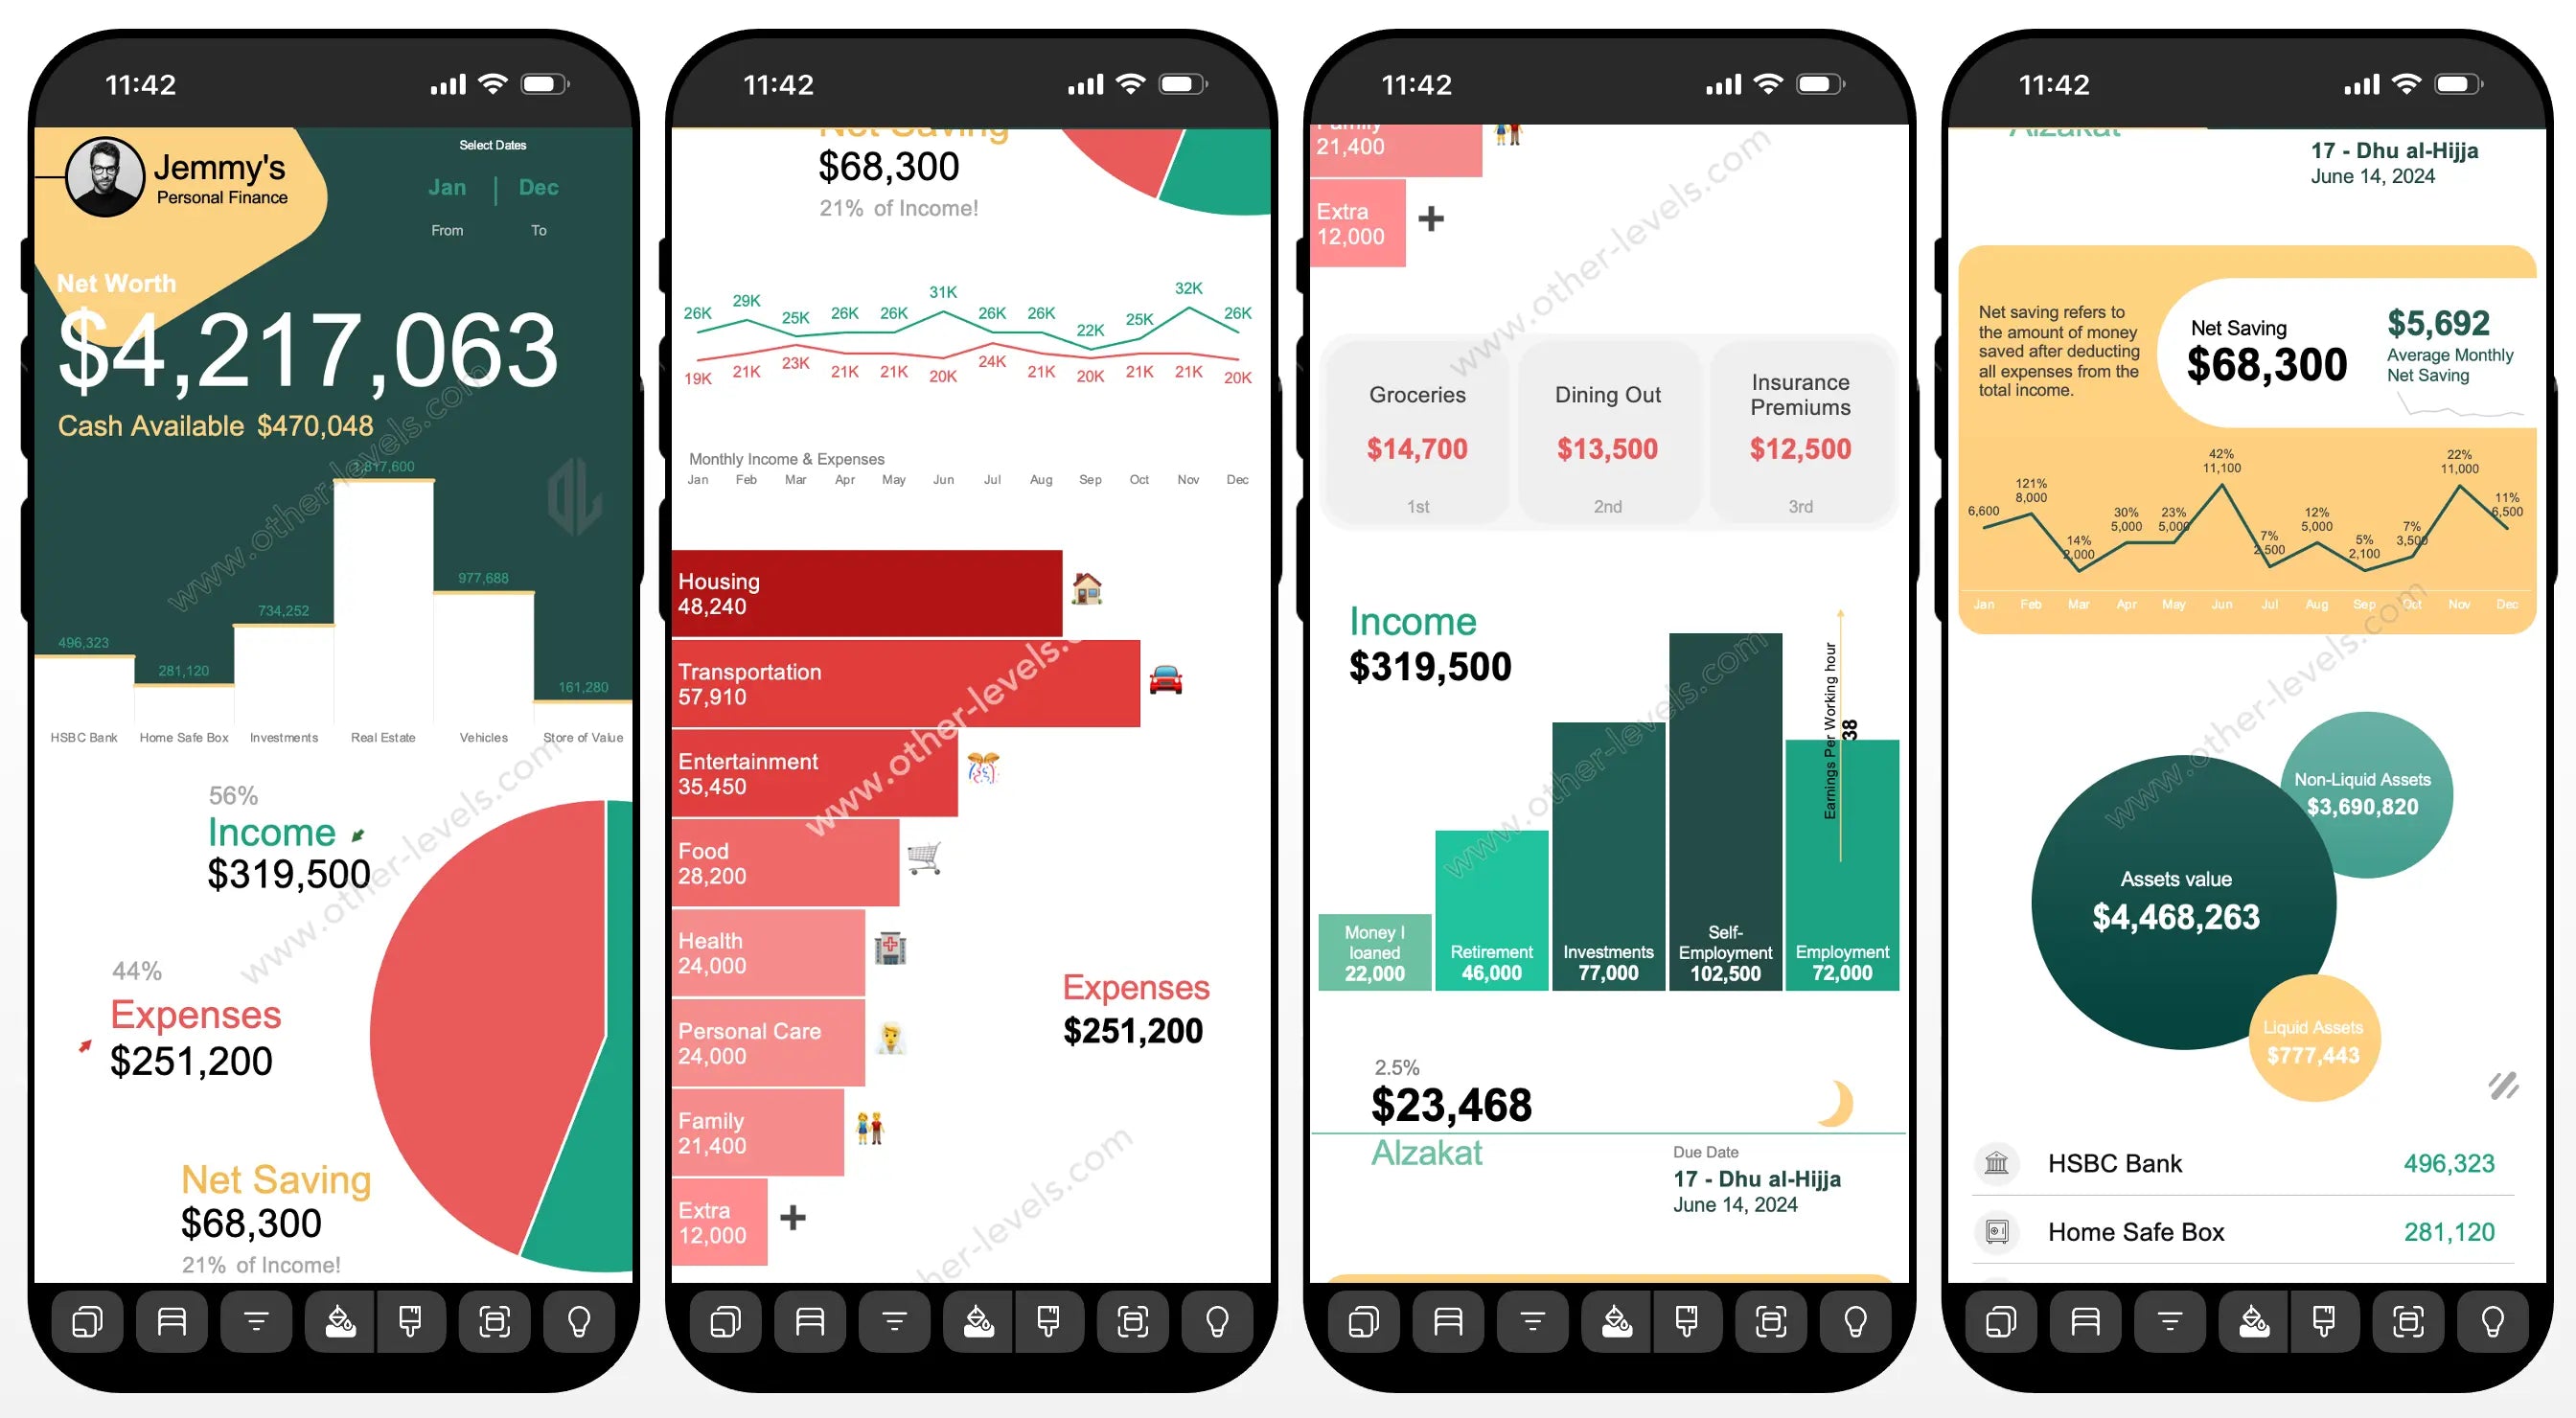
Part of our Next Gen Personal Finance Dashboard Templates and the Excel Dashboard collection. It’s a friendly personal finance app made for excel mobile. Here’s the thing: you open it, log a few lines, and the picture clears up fast.
What You Get
- Quick filters and tiles so you can customize dashboard views in seconds.
- Clean sheets: an income and expense sheet plus a guided income and expense tracker.
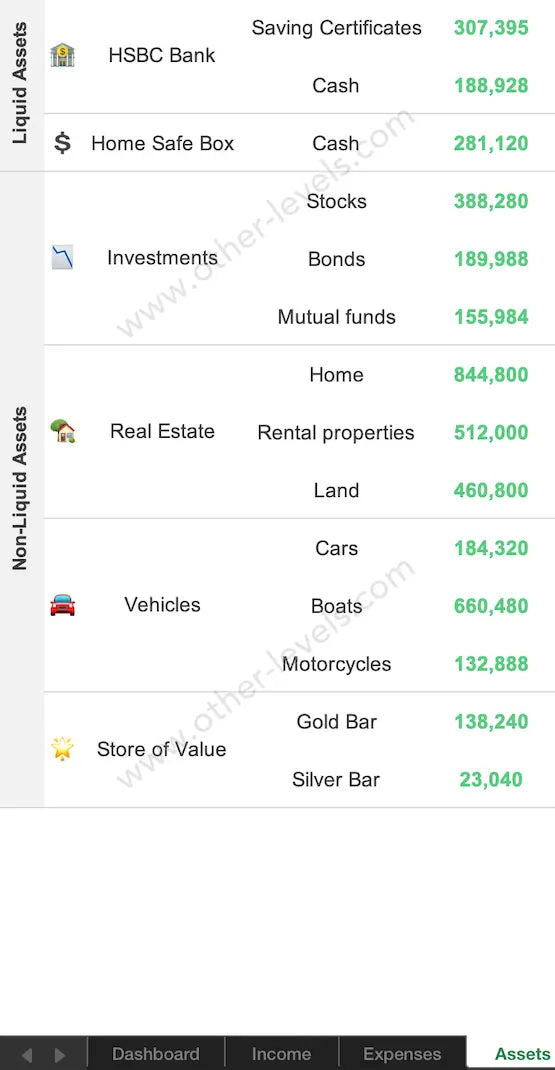
- A ready personal finance balance sheet that rolls up to your net asset value.
- One-tap visuals with a built-in pie chart generator and simple pie chart views.
- Everyday helpers: a quick personal finance calculator and a sticky quick notes section.
Mobile First
Built for thumbs. In practice, buttons are big, text is readable, and charts glide. Use desktop when you want, but excel in mobile keeps the routine effortless.
How the Dashboard Thinks
Headline KPIs
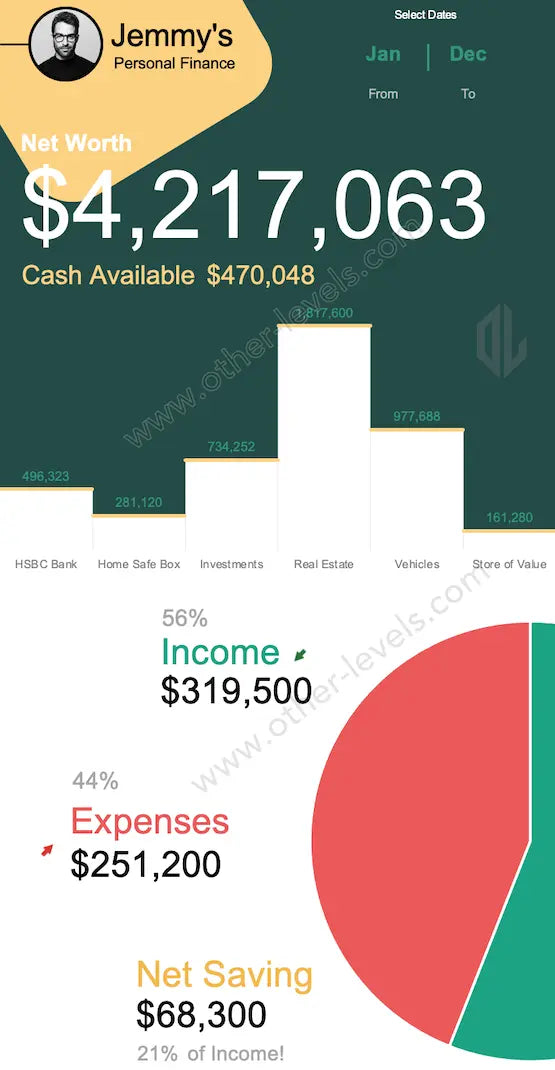
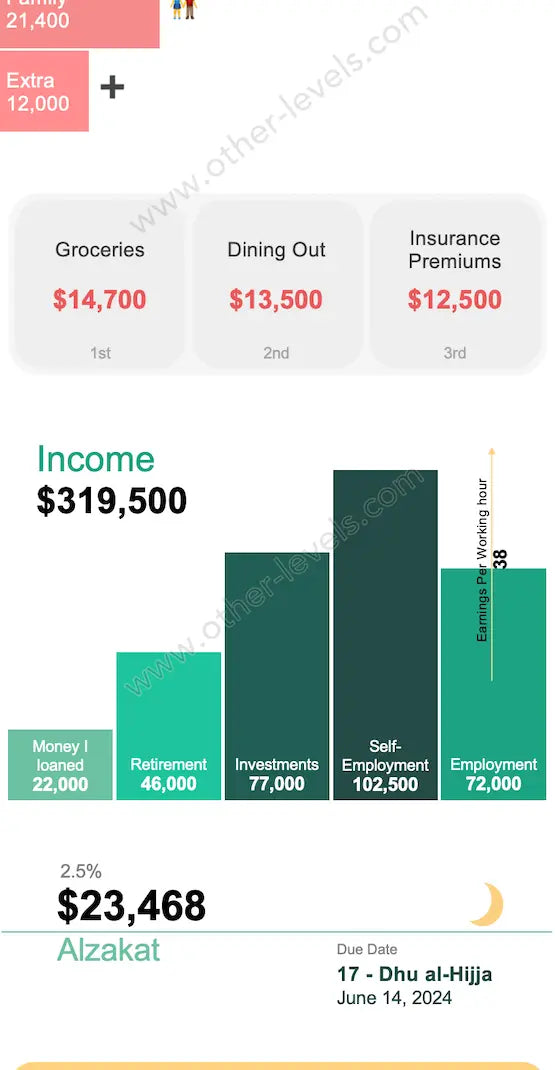
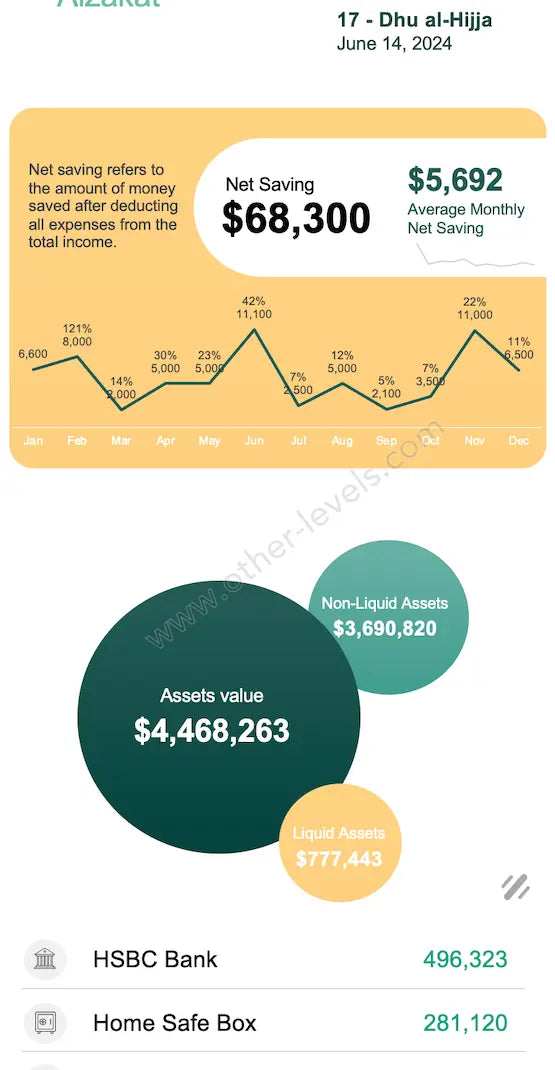
You’ll notice the essentials first—income, expenses, and net savings. No hunting around. Just the signal.
Category Insights
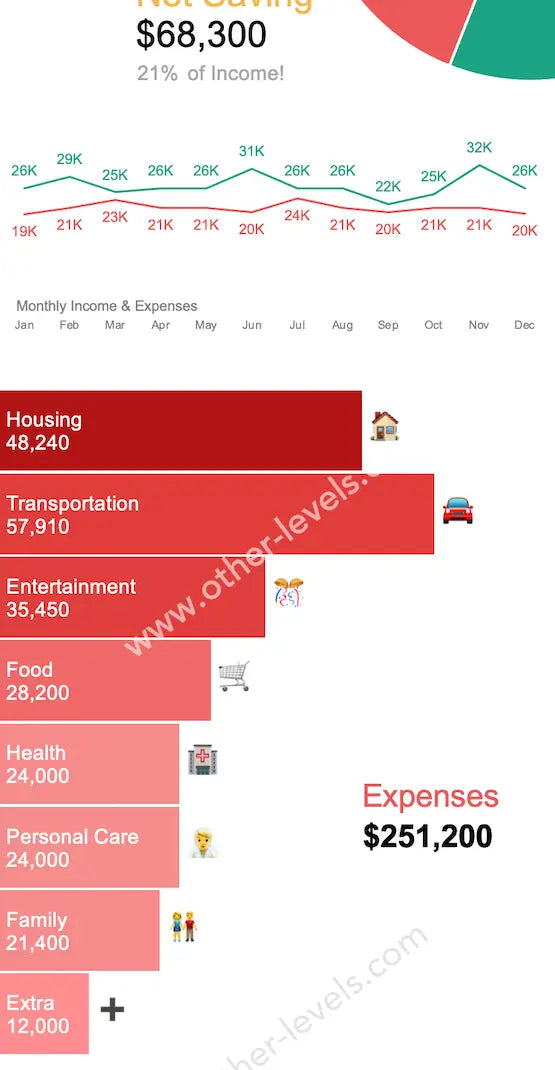
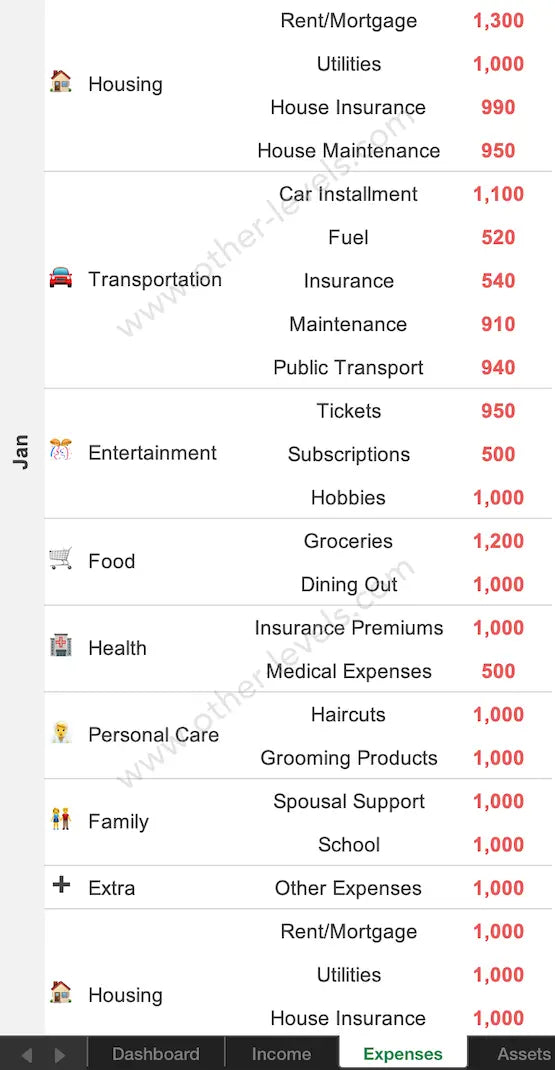
Spending groups stack up clearly. You see which bucket is loud this month, then decide what to cut—or keep.
Instant Visuals
Tap the pie chart generator. Get a fast split of where money flows. It’s the quick read you check on the train.
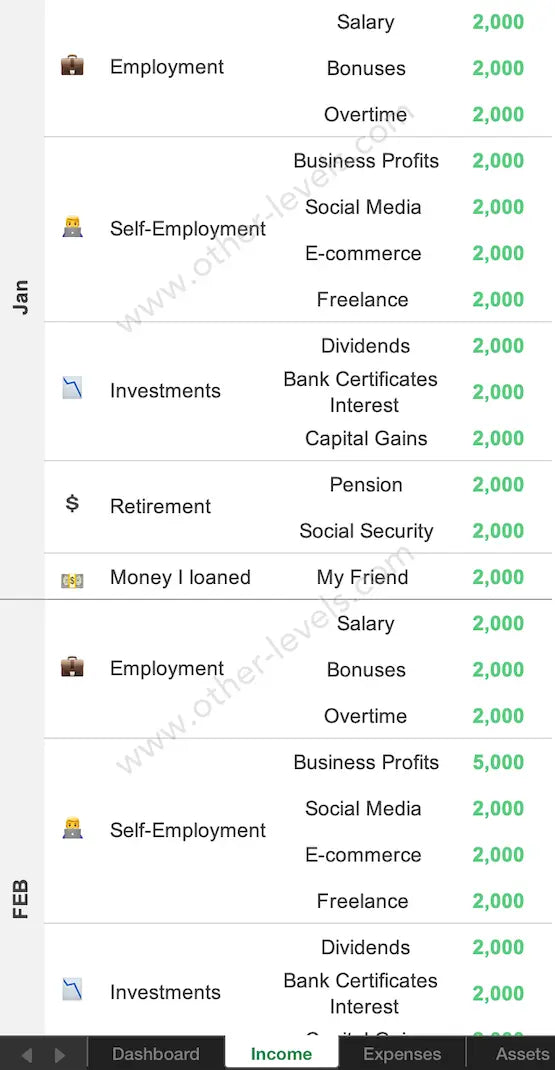
Income
Structured Sources
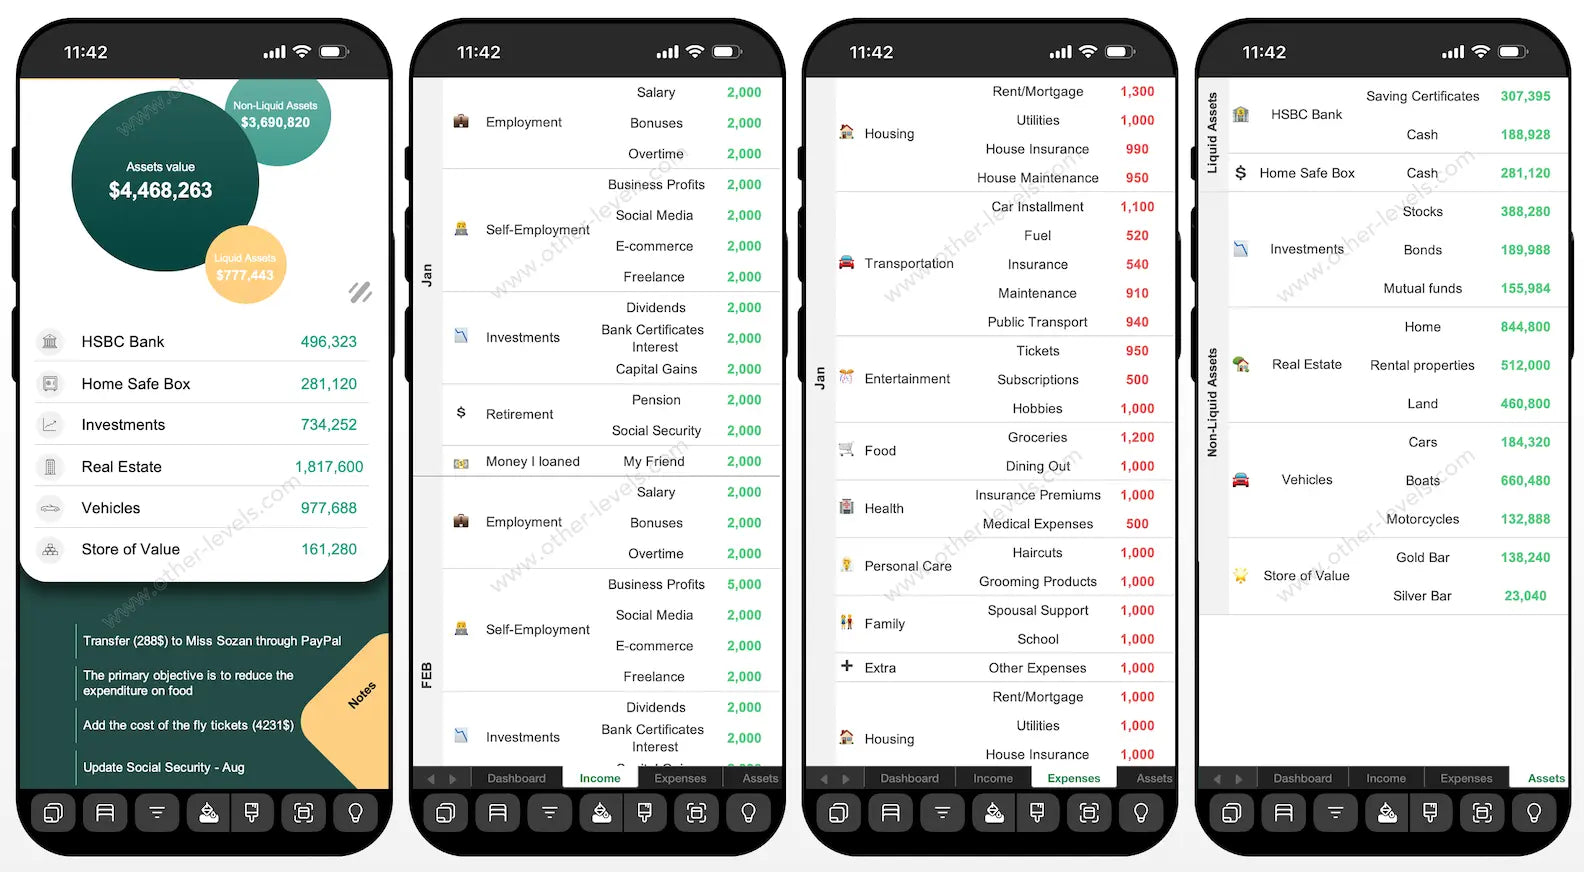
Salaries, side gigs, dividends—log once and move on. The entries power the income and expense tracker automatically.
For Freelancers
The optional self employment income statement template keeps revenue, costs, and margin tidy. Less admin. More focus.
Expenses
Everyday Categories
Housing, transportation, food, health, family—real life stuff. Totals roll into trends so you can react quickly.
Bill-Friendly Notes
Add a reminder, a due date, or a short tag. The flow stays simple, the picture stays honest.
Assets
Liquid vs Non-Liquid
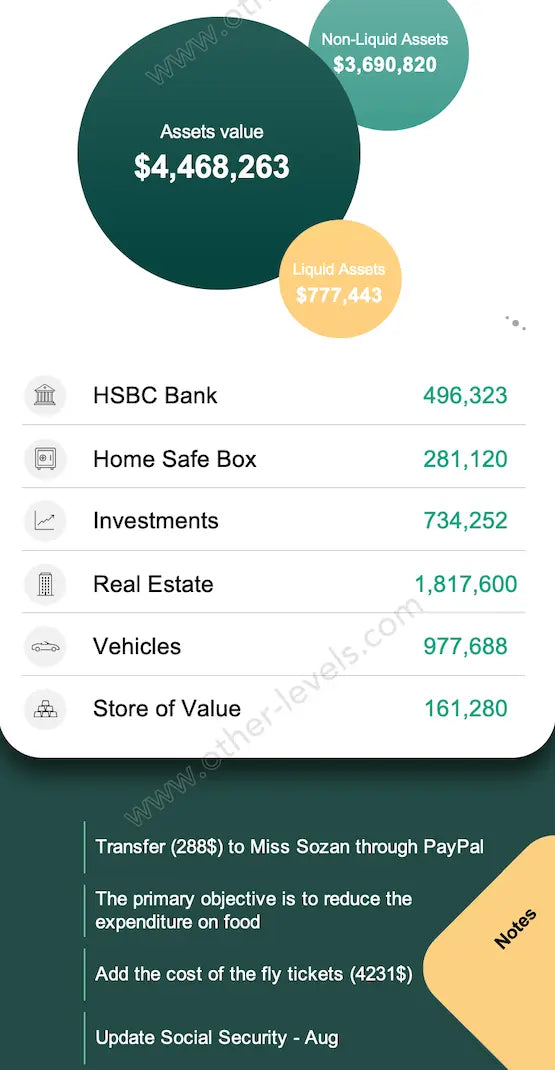
Banks and wallets up top. Real estate, vehicles, and long holds below. The split makes liquidity obvious at a glance.
Perspective
Track net asset value. If you’re modeling utilities or regulated lines, add regulated asset value. It’s there when you need it.
Planning & Obligations
Zakat calculator
A focused zakat calculator estimates what’s due from eligible assets. Clear and respectful of your process.
Estate Index
Keep simple pointers in a will template index sheet. For legal details, always talk to a professional.
Reports & Sharing
Hand-Off Ready
Export a tidy excel format for expense reports. Share with a partner or an accountant. No cleanup needed.
Open Anywhere
Store it in the cloud and rely on data sync. One workbook. Phone and desktop. No broken charts.
Under the Hood
Transactions Table
- Date, Type (Income/Expense/Transfer)
- Category, Subcategory, Account/Asset
- Amount, Method, Note
- Month and Year helpers for fast pivots
Assets Table
- Class (Liquid/Non-Liquid), Type (bank, cash, stock, home, vehicle, gold)
- Item/Name, Balance/Value, eligibility flags, notes
Statements & KPIs
Rollups power financial performance and the personal finance balance sheet. No extra formulas from you.
Go Further
Beyond Basics
If you want deeper views, explore scenarios that go beyond personal finance—like comparing regulated asset value with net asset value for planning.
Make It Yours
Fast Customization
Rename categories, hide tiles, add small fields. You can customize dashboard elements without macros. It’s all native Excel.
Daily Rhythm
Simple Routine
- Open on phone. Add lines in the income and expense sheet.
- Glance at net savings and the loudest categories.
- Drop a reminder in the quick notes section. Keep moving.
FAQ
Does it really work well on phones?
Yes. It’s tuned for excel in mobile. Tap, log, done.
Can I analyze results quickly?
Absolutely. Use the visuals and the personal finance calculator for quick checks, then export in excel format for expense reports when you need a shareable file.
How do I keep files aligned?
Save to a cloud folder. With data sync, you open the same file everywhere and everything stays in step.
Getting Started
- Download and open in excel mobile or desktop.
- Enter opening balances and a few transactions.
- Create a quick visual with the pie chart generator. See the pattern. Act on it.
Related Dashboards You Might Like
Watch The Tutorial
Specifications
Get all essential details in one place. From features and package contents to software compatibility and skill level required, this section gives you a clear overview so you know exactly what to expect before download.
Template Features
Package Details
Software Compatibility
Skill Level Required
Intermediate
FAQs
Please read our FAQs page to find out more.
Are the templates fully customizable?
Yes, all our templates are fully customizable. You can adjust the layout, data, and design elements to fit your specific needs. Our templates are designed to be flexible, allowing you to easily tailor them to your preferences.
Can I order a product in any language?
Yes, we provide products in any language. Simply select the "Dashboard language change" Service and once your order is placed, you will receive it within 48 hours.
What happens if I choose the wrong monitor screen size for my dashboard?
If you choose the wrong screen size, the dashboard may not display correctly on your monitor. Elements could appear too large, too small, or misaligned, affecting the readability and usability of the dashboard. We recommend selecting the appropriate screen size to ensure optimal viewing and performance.
Do I need specific skills to use the advanced Excel dashboard templates?
Our advanced Excel dashboards are easy to use, the only thing you need to know is how to work with PivotTables. With basic knowledge of PivotTables, you'll be able to customize and fully utilize these templates effortlessly. "Please check the skill level required"
All dashboards are 100% editable Excel files. Learn how to use them through our video tutorials, included datasets, and lifetime access program.

