

Excel Dashboard for Medical Service Companies - Improve Efficiency
Pairs well with
Excel Dashboard for Medical Service Companies to Improve Efficiency
The Excel Dashboard for healthcare analytics is a complete reporting system designed for hospitals and medical service companies that need clarity, not clutter. It connects real patient, financial, and departmental data into one interactive view—helping healthcare leaders improve operational efficiency and make faster, data-driven decisions. Whether you manage a clinic or a large hospital, this template gives you instant visibility into performance trends, invoice flow, and patient engagement patterns.
All-in-One Medical Dashboard for Real Insights
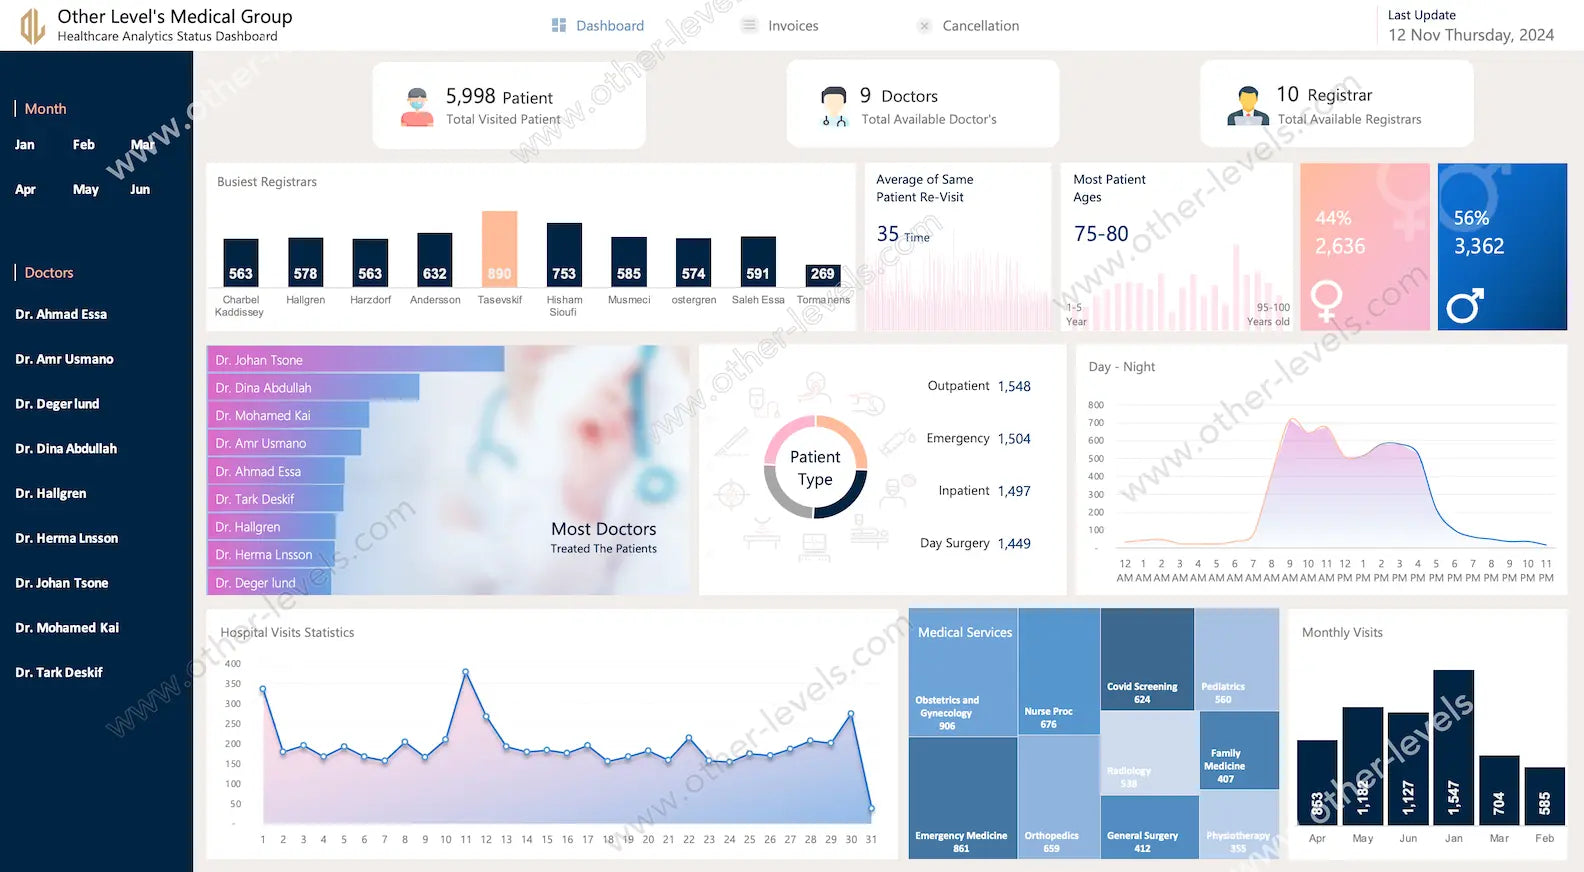
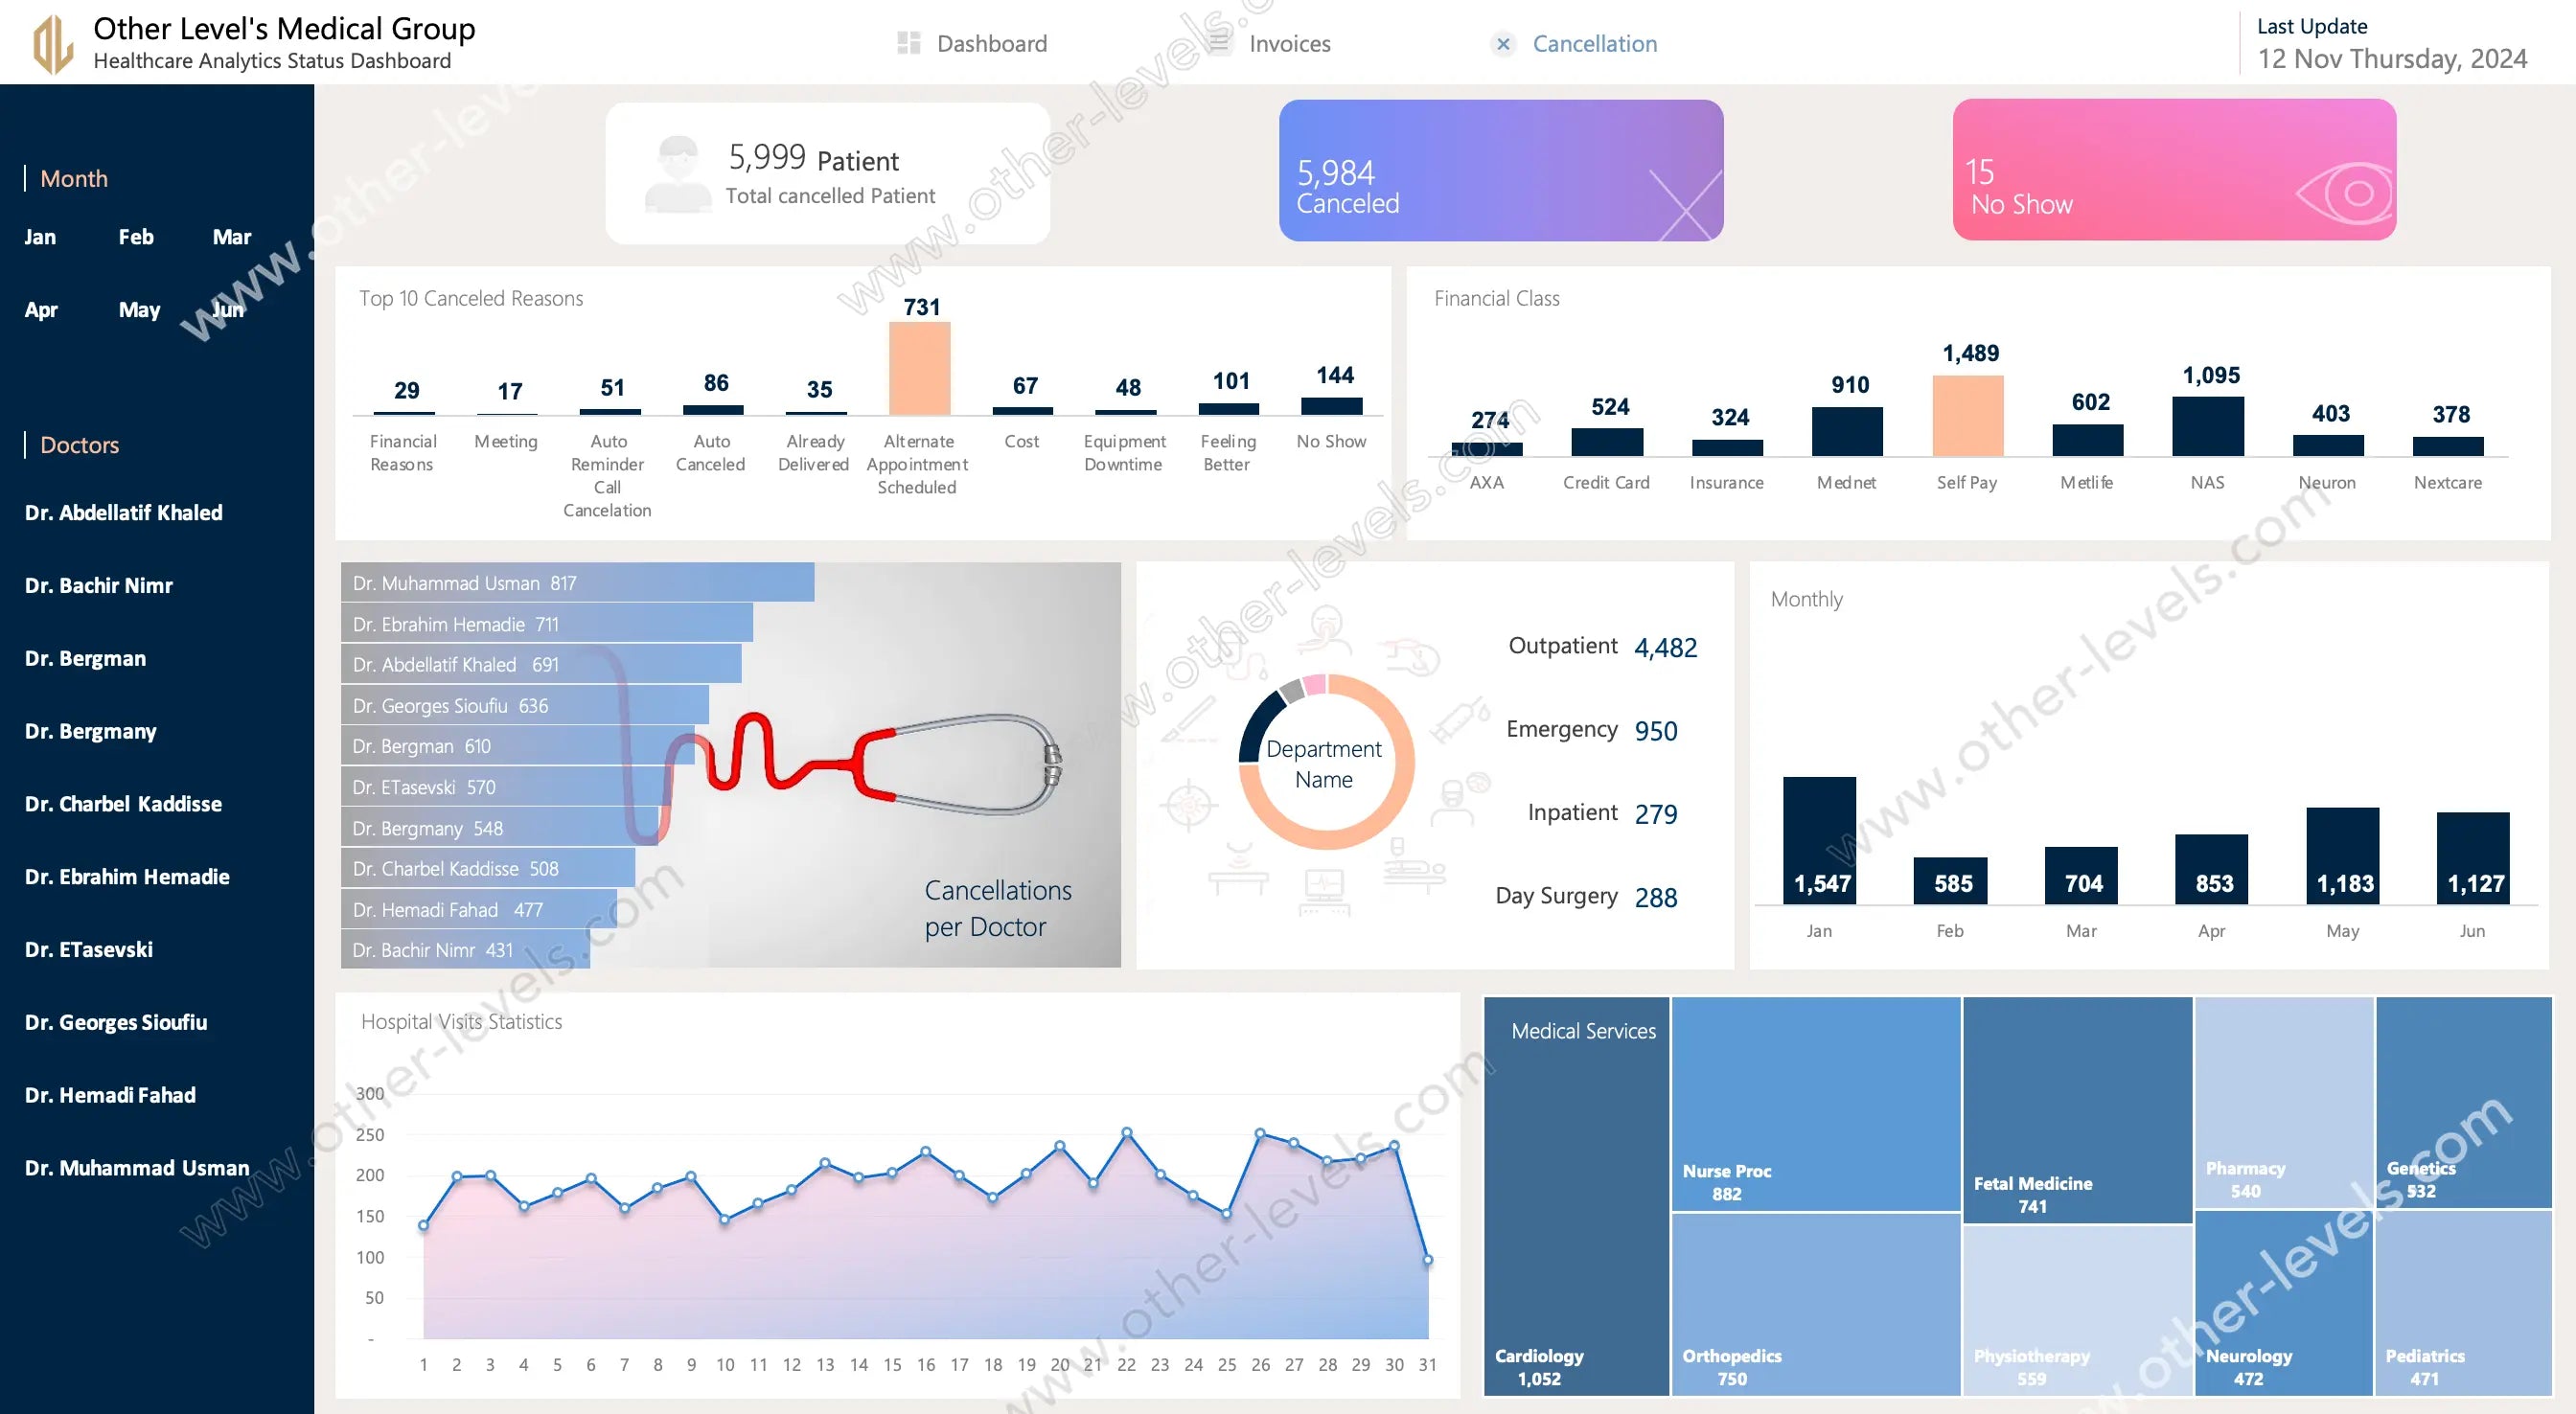
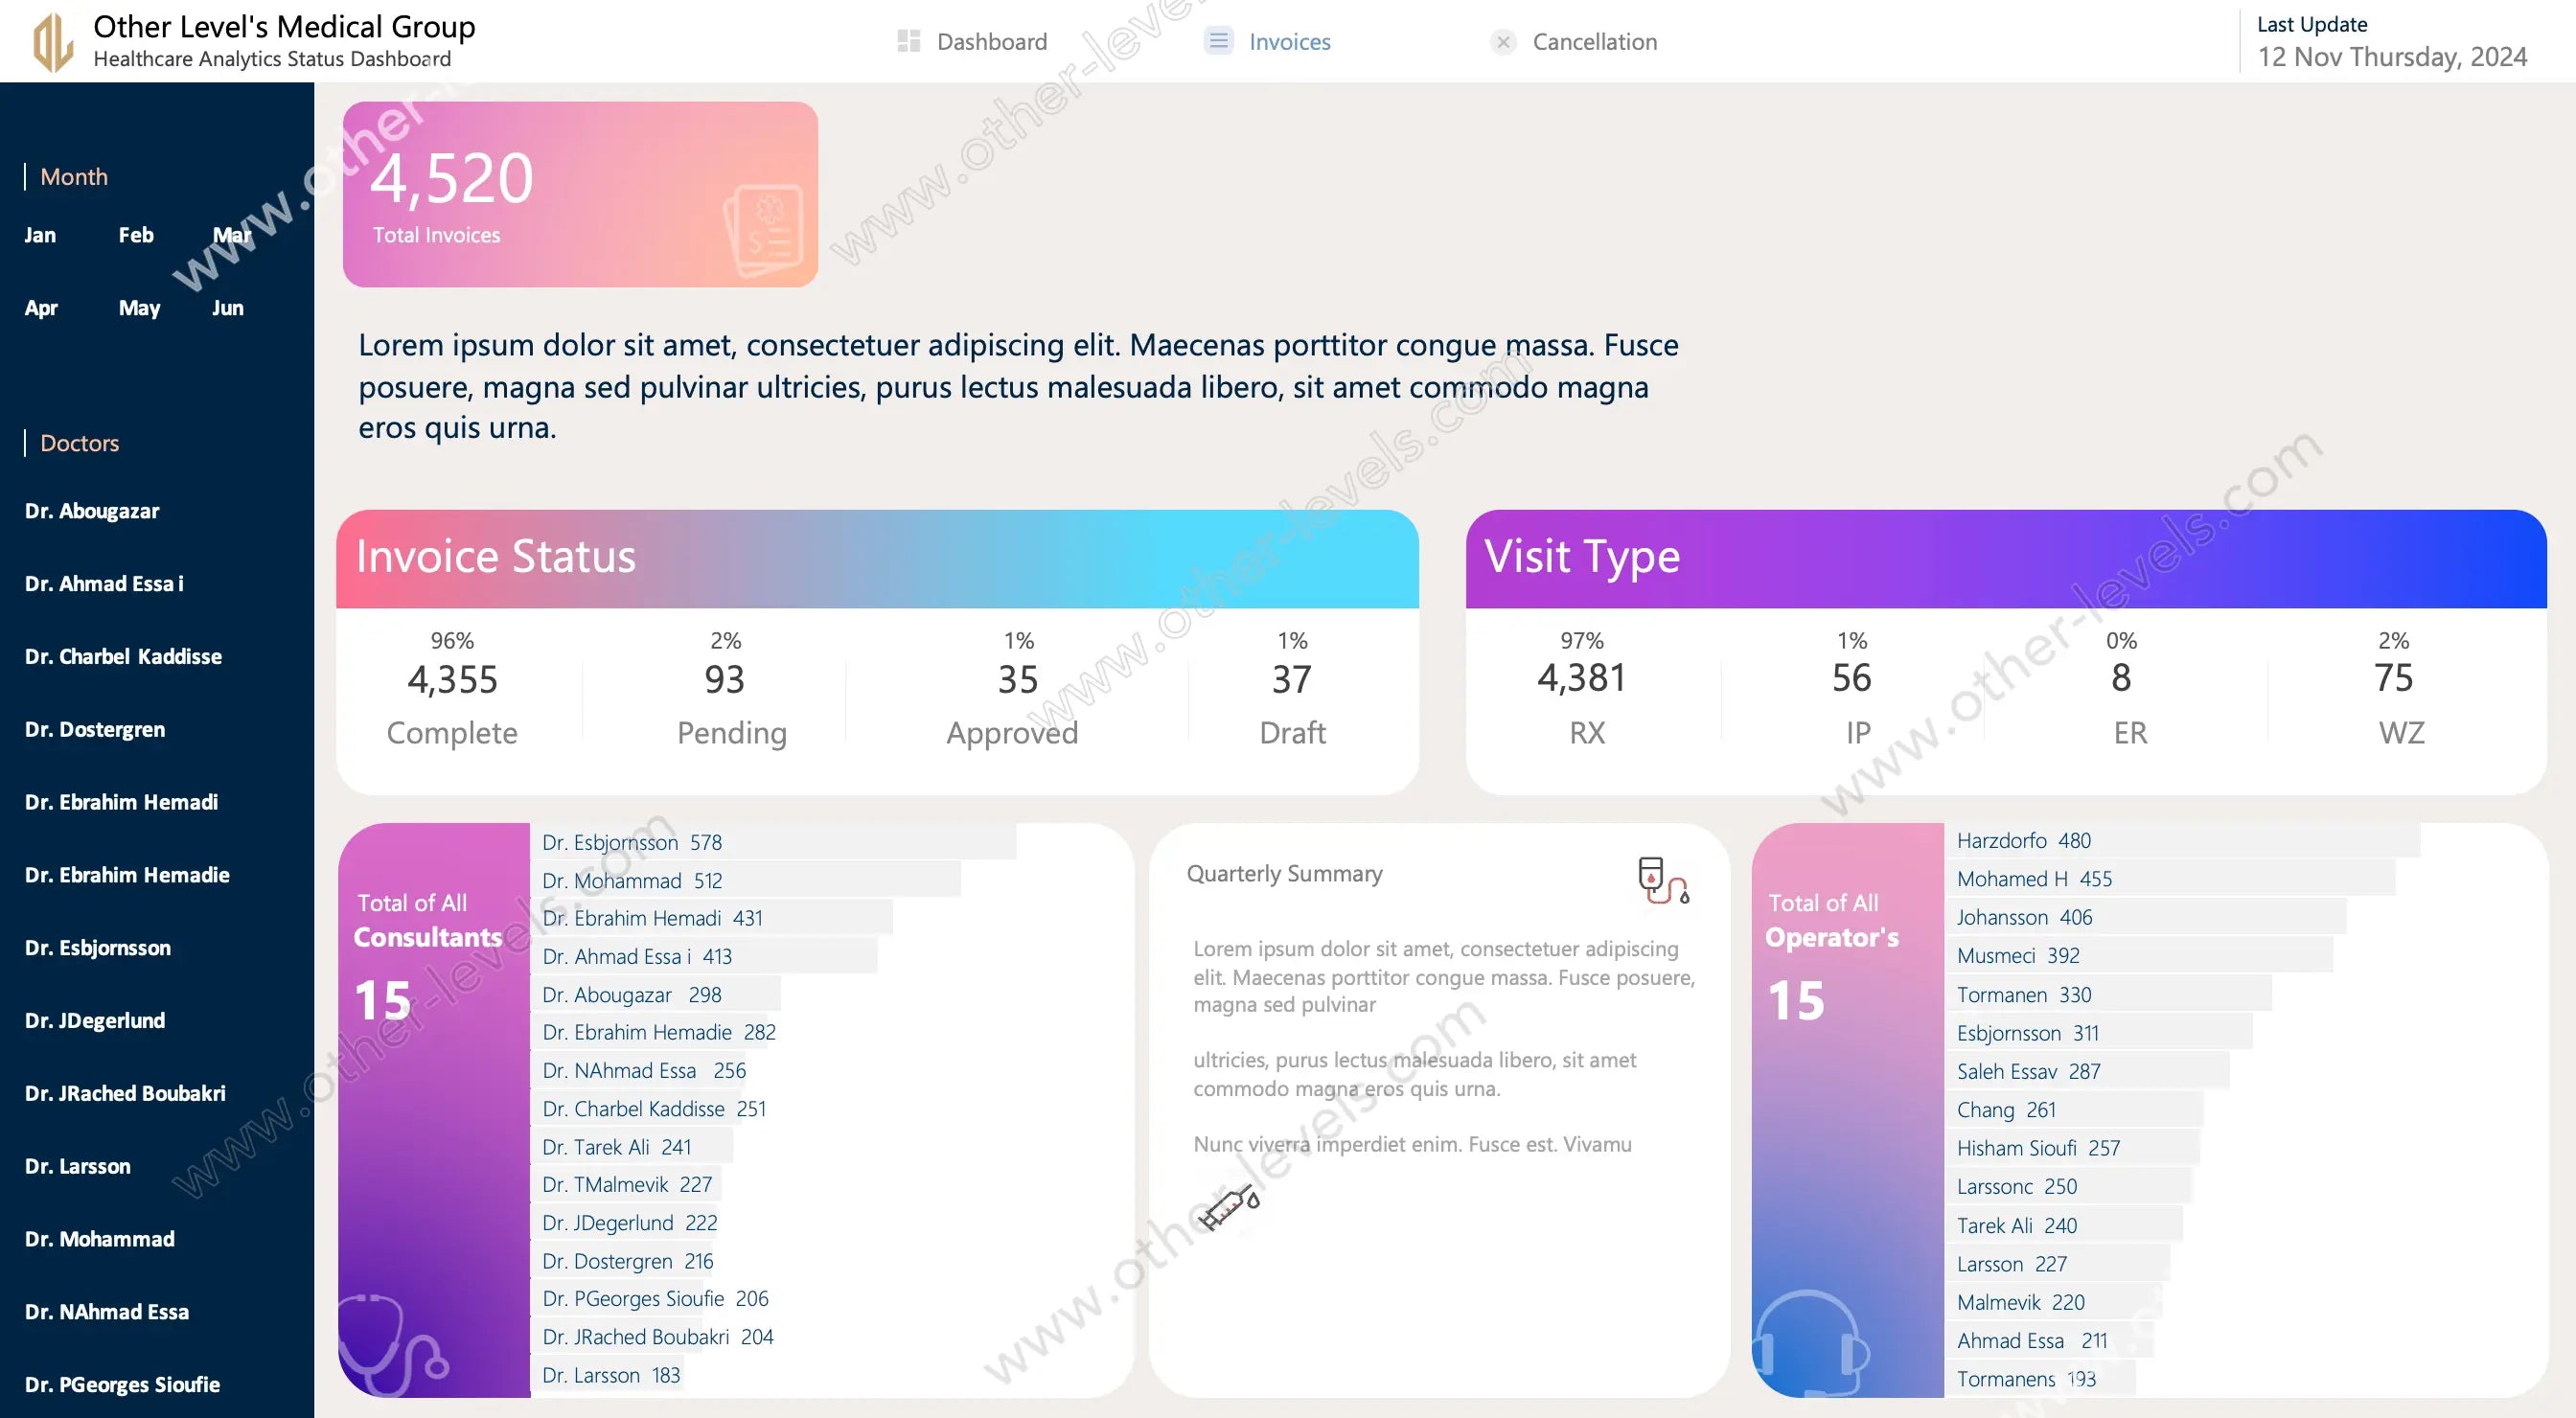
This medical dashboard combines three analytical views: Dashboard, Invoices, and Cancellations. Each section includes KPI cards, pivot-driven charts, and slicer-based filters for instant updates. From tracking total patients and visit types to understanding doctor workloads and no-show rates, it’s the most practical patient dashboard you can deploy right away.
Core Features & Analysis Views
- Patient Overview: Monitor total visits, gender ratio, age ranges, and day/night activity through clean line and area charts.
- Invoice Dashboard: Manage completed, pending, and approved bills with bar and donut charts—ideal for finance and performance consulting reviews.
- Cancellation Analytics: Identify cancellation causes, doctor impact, and departmental trends using treemaps and comparative bars.
- Medical Services Breakdown: Compare outpatient, inpatient, and emergency service loads to align with your operational goals.
Why Hospitals Choose This Template
- Designed for any medical services company or clinic with multiple departments.
- Optimized for executives who need visual clarity and quick decisions from one invoice dashboard.
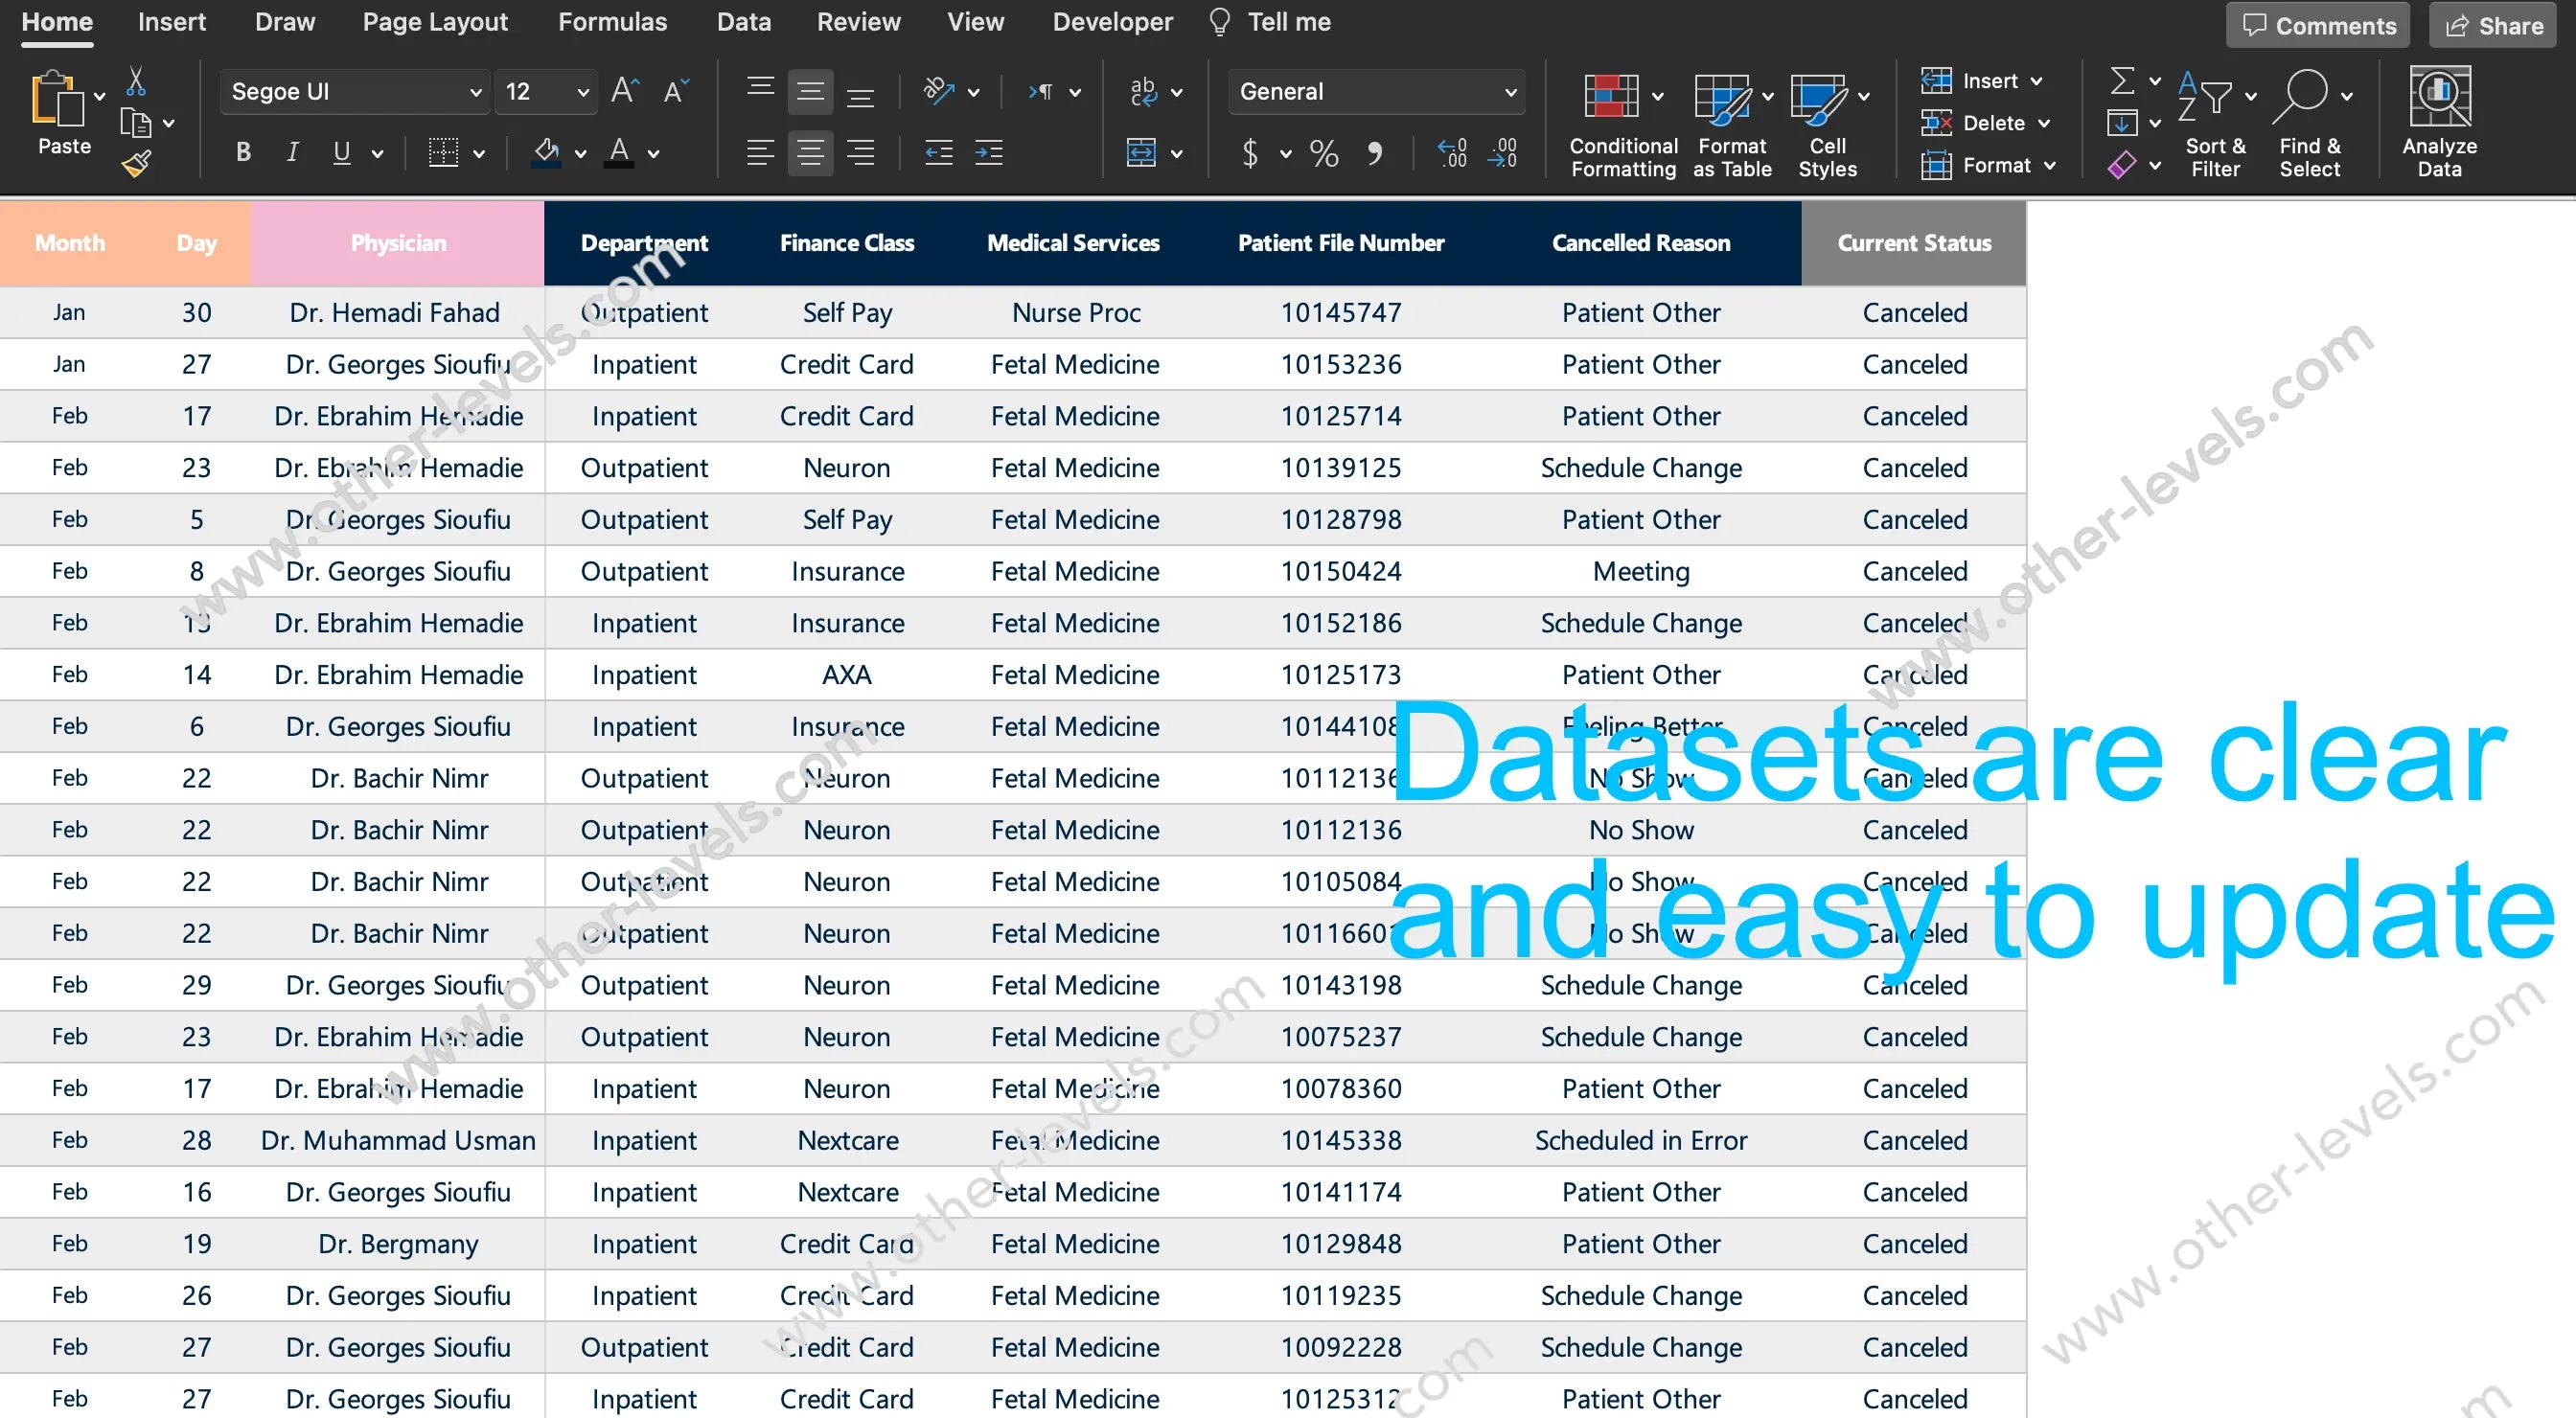
- Built with Excel formulas, pivot tables, and slicers—no add-ins required.
- Completely editable colors, metrics, and data sources for customization.
Use Cases
- Healthcare operations and management reporting
- Hospital finance and billing analysis
- Department-level KPI tracking and patient activation measure programs
- Performance reviews and strategic planning sessions
With this Healthcare Excel Dashboard, you can transform raw hospital data into a modern decision tool—showing executives, consultants, and managers exactly what matters most in one clean, visual interface. For organizations analyzing communication and service trends, explore our Inbound Call Center Data Analysis & Interactive Excel Dashboard and the advanced Call Center Performance Dashboard - Comprehensive Excel Analytics for deeper performance insights across departments.
Watch the full tutorial on our Other Levels YouTube Channel
Specifications
Get all essential details in one place. From features and package contents to software compatibility and skill level required, this section gives you a clear overview so you know exactly what to expect before download.
Template Features
Package Details
Software Compatibility
Skill Level Required
Intermediate
FAQs
Please read our FAQs page to find out more.
Are the templates fully customizable?
Yes, all our templates are fully customizable. You can adjust the layout, data, and design elements to fit your specific needs. Our templates are designed to be flexible, allowing you to easily tailor them to your preferences.
Can I order a product in any language?
Yes, we provide products in any language. Simply select the "Dashboard language change" Service and once your order is placed, you will receive it within 48 hours.
What happens if I choose the wrong monitor screen size for my dashboard?
If you choose the wrong screen size, the dashboard may not display correctly on your monitor. Elements could appear too large, too small, or misaligned, affecting the readability and usability of the dashboard. We recommend selecting the appropriate screen size to ensure optimal viewing and performance.
Do I need specific skills to use the advanced Excel dashboard templates?
Our advanced Excel dashboards are easy to use, the only thing you need to know is how to work with PivotTables. With basic knowledge of PivotTables, you'll be able to customize and fully utilize these templates effortlessly. "Please check the skill level required"
All dashboards are 100% editable Excel files. Learn how to use them through our video tutorials, included datasets, and lifetime access program.

