✅ Instant Digital Delivery | 🔒 Secure Checkout | ⭐ Trusted by 1,000+ Professionals | 💬 24hr Support
Sales Growth Excel Dashboard – Purchases, Profits & Performance
Pairs well with
Overview: Purchases, Sales and Profits Excel Dashboard – Business Performance Template
This isn’t just another Sales Growth Excel Dashboard. It’s an all-in-one performance guide that turns weekly raw data into a clean, reliable Spreadsheet narrative. Purchases, sales, and profits sit in one structured view so you stop hunting across tabs and start deciding. Direction, momentum, and health are front and center—so leaders and analysts act faster with confidence.
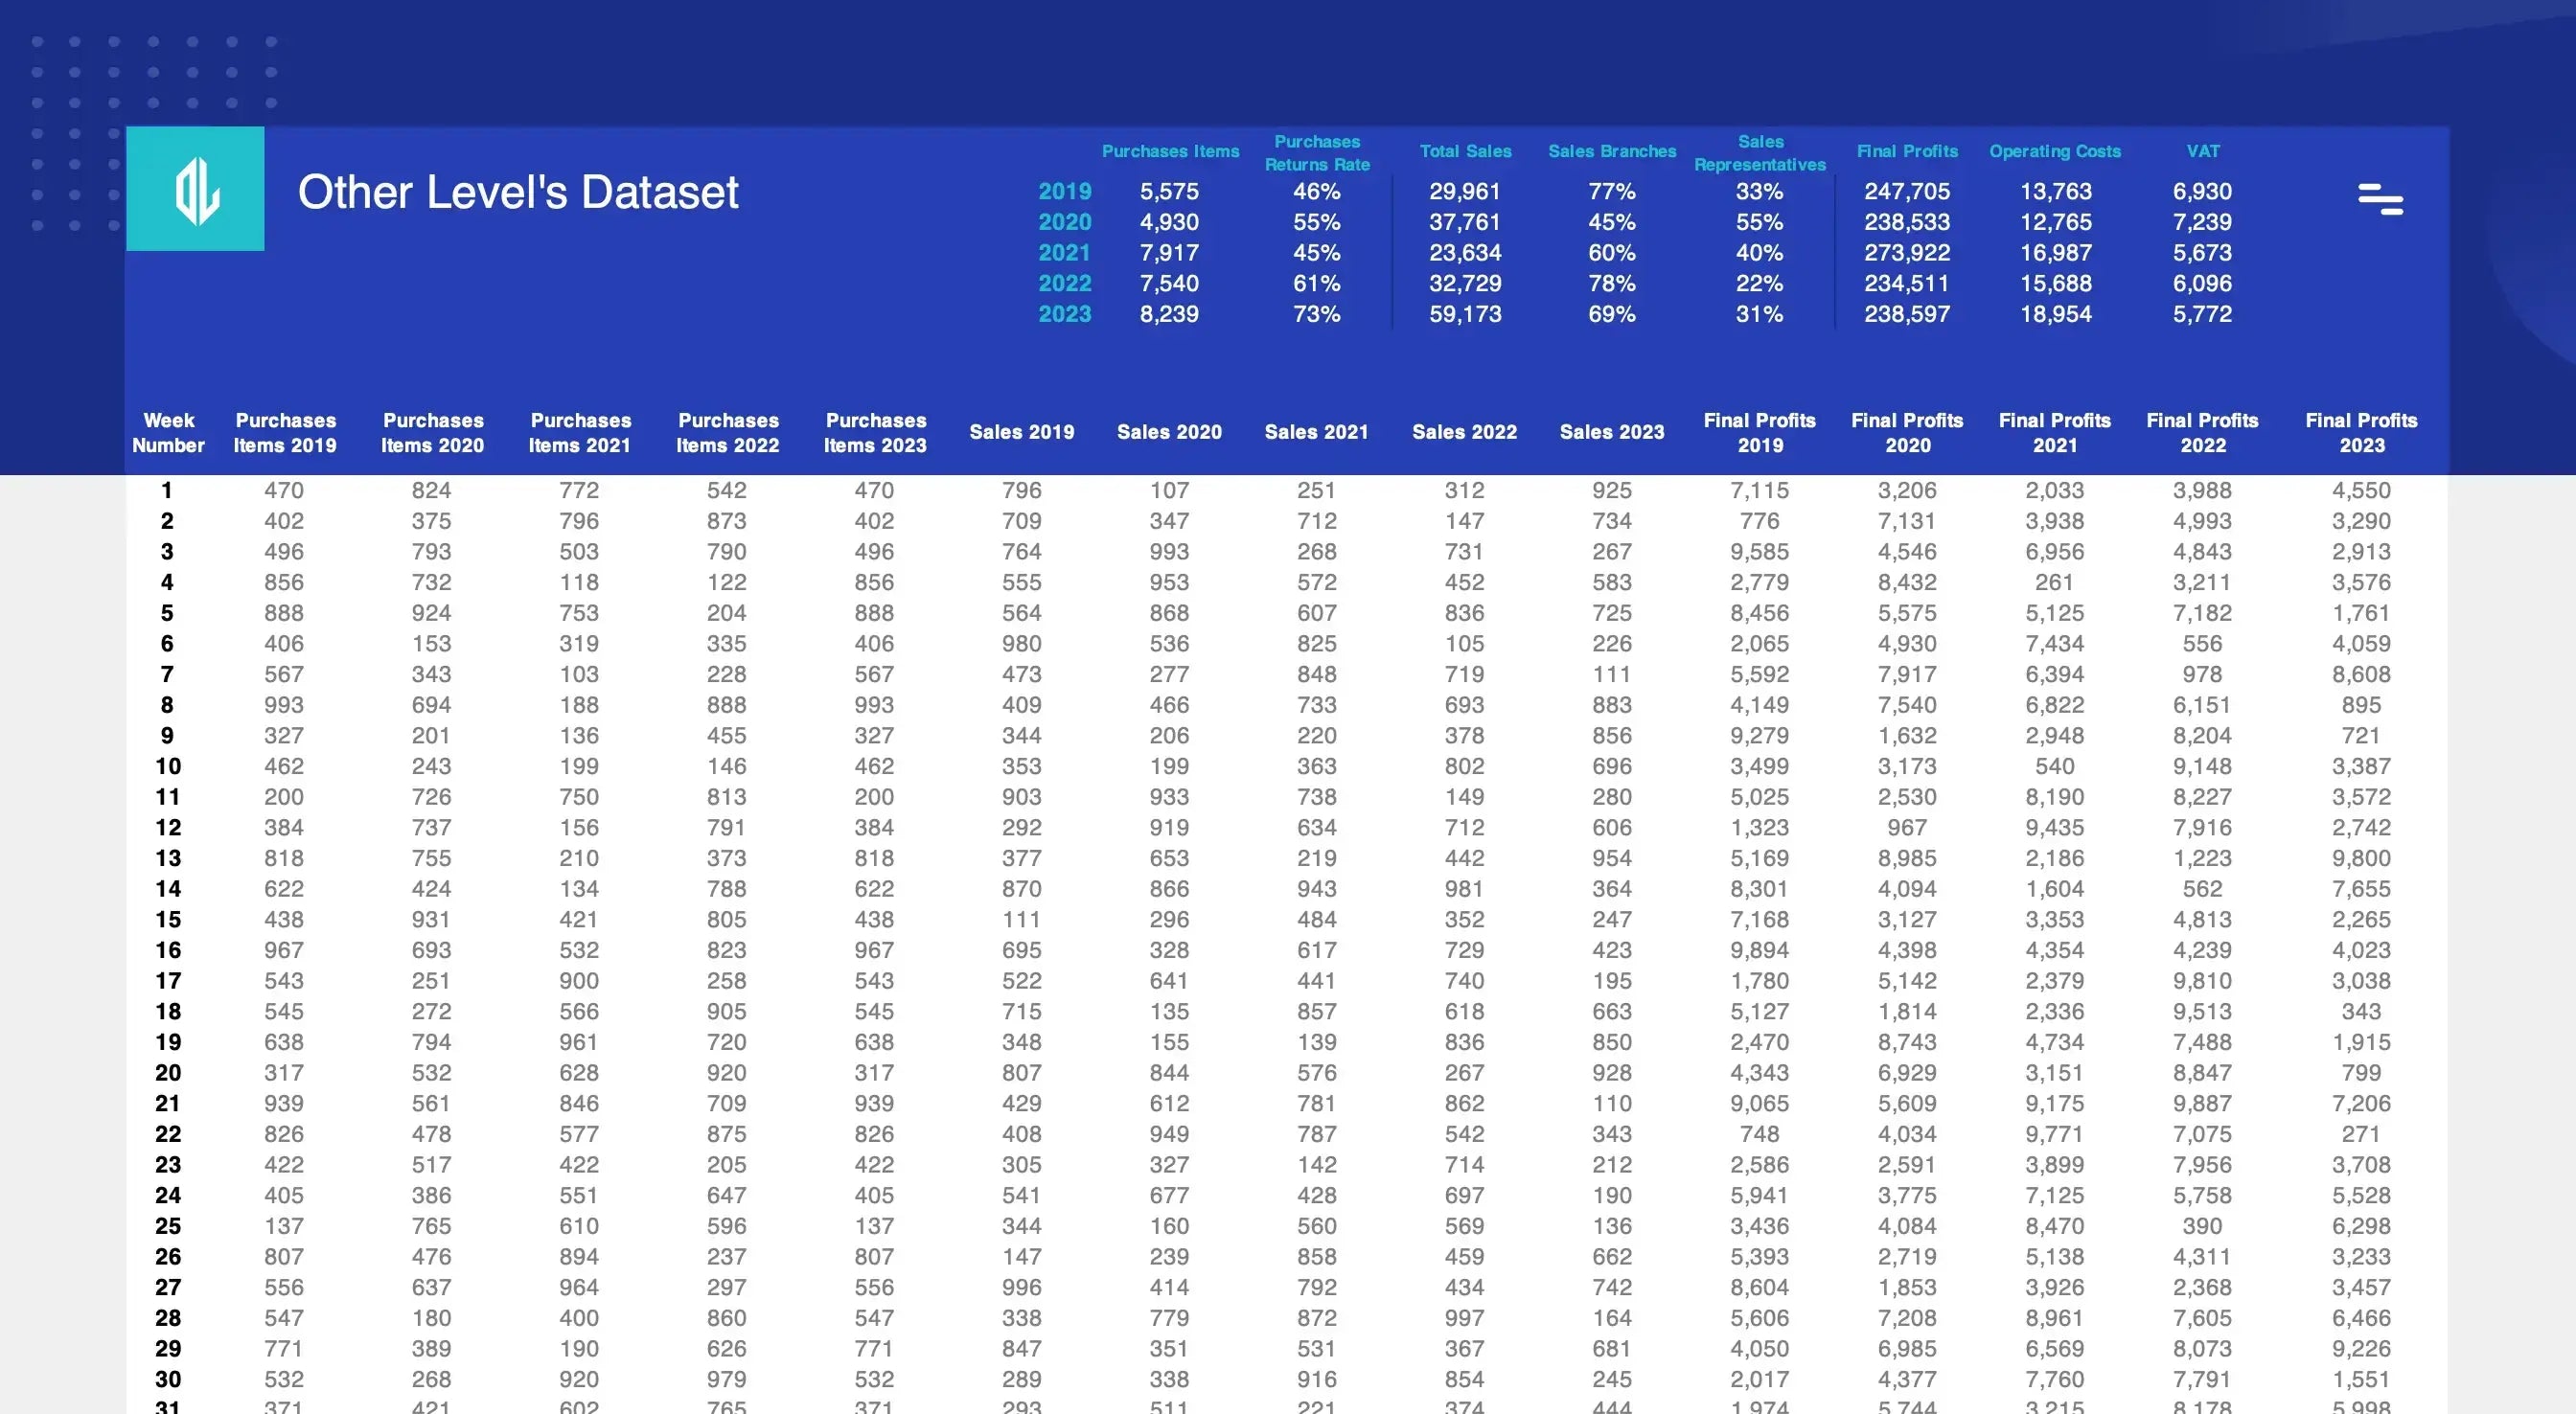
What the Spreadsheet captures
Data is organized week by week, year over year—covering purchases, sales, profits, VAT, and operating costs. It’s engineered for pivot tables, so sales data analysis or a weekly report is a few clicks. For deeper sales insights and forecasting, pair it with the Advanced Sales Intelligence Dashboard - Excel Sales Insights.
Dashboard Layout & Features
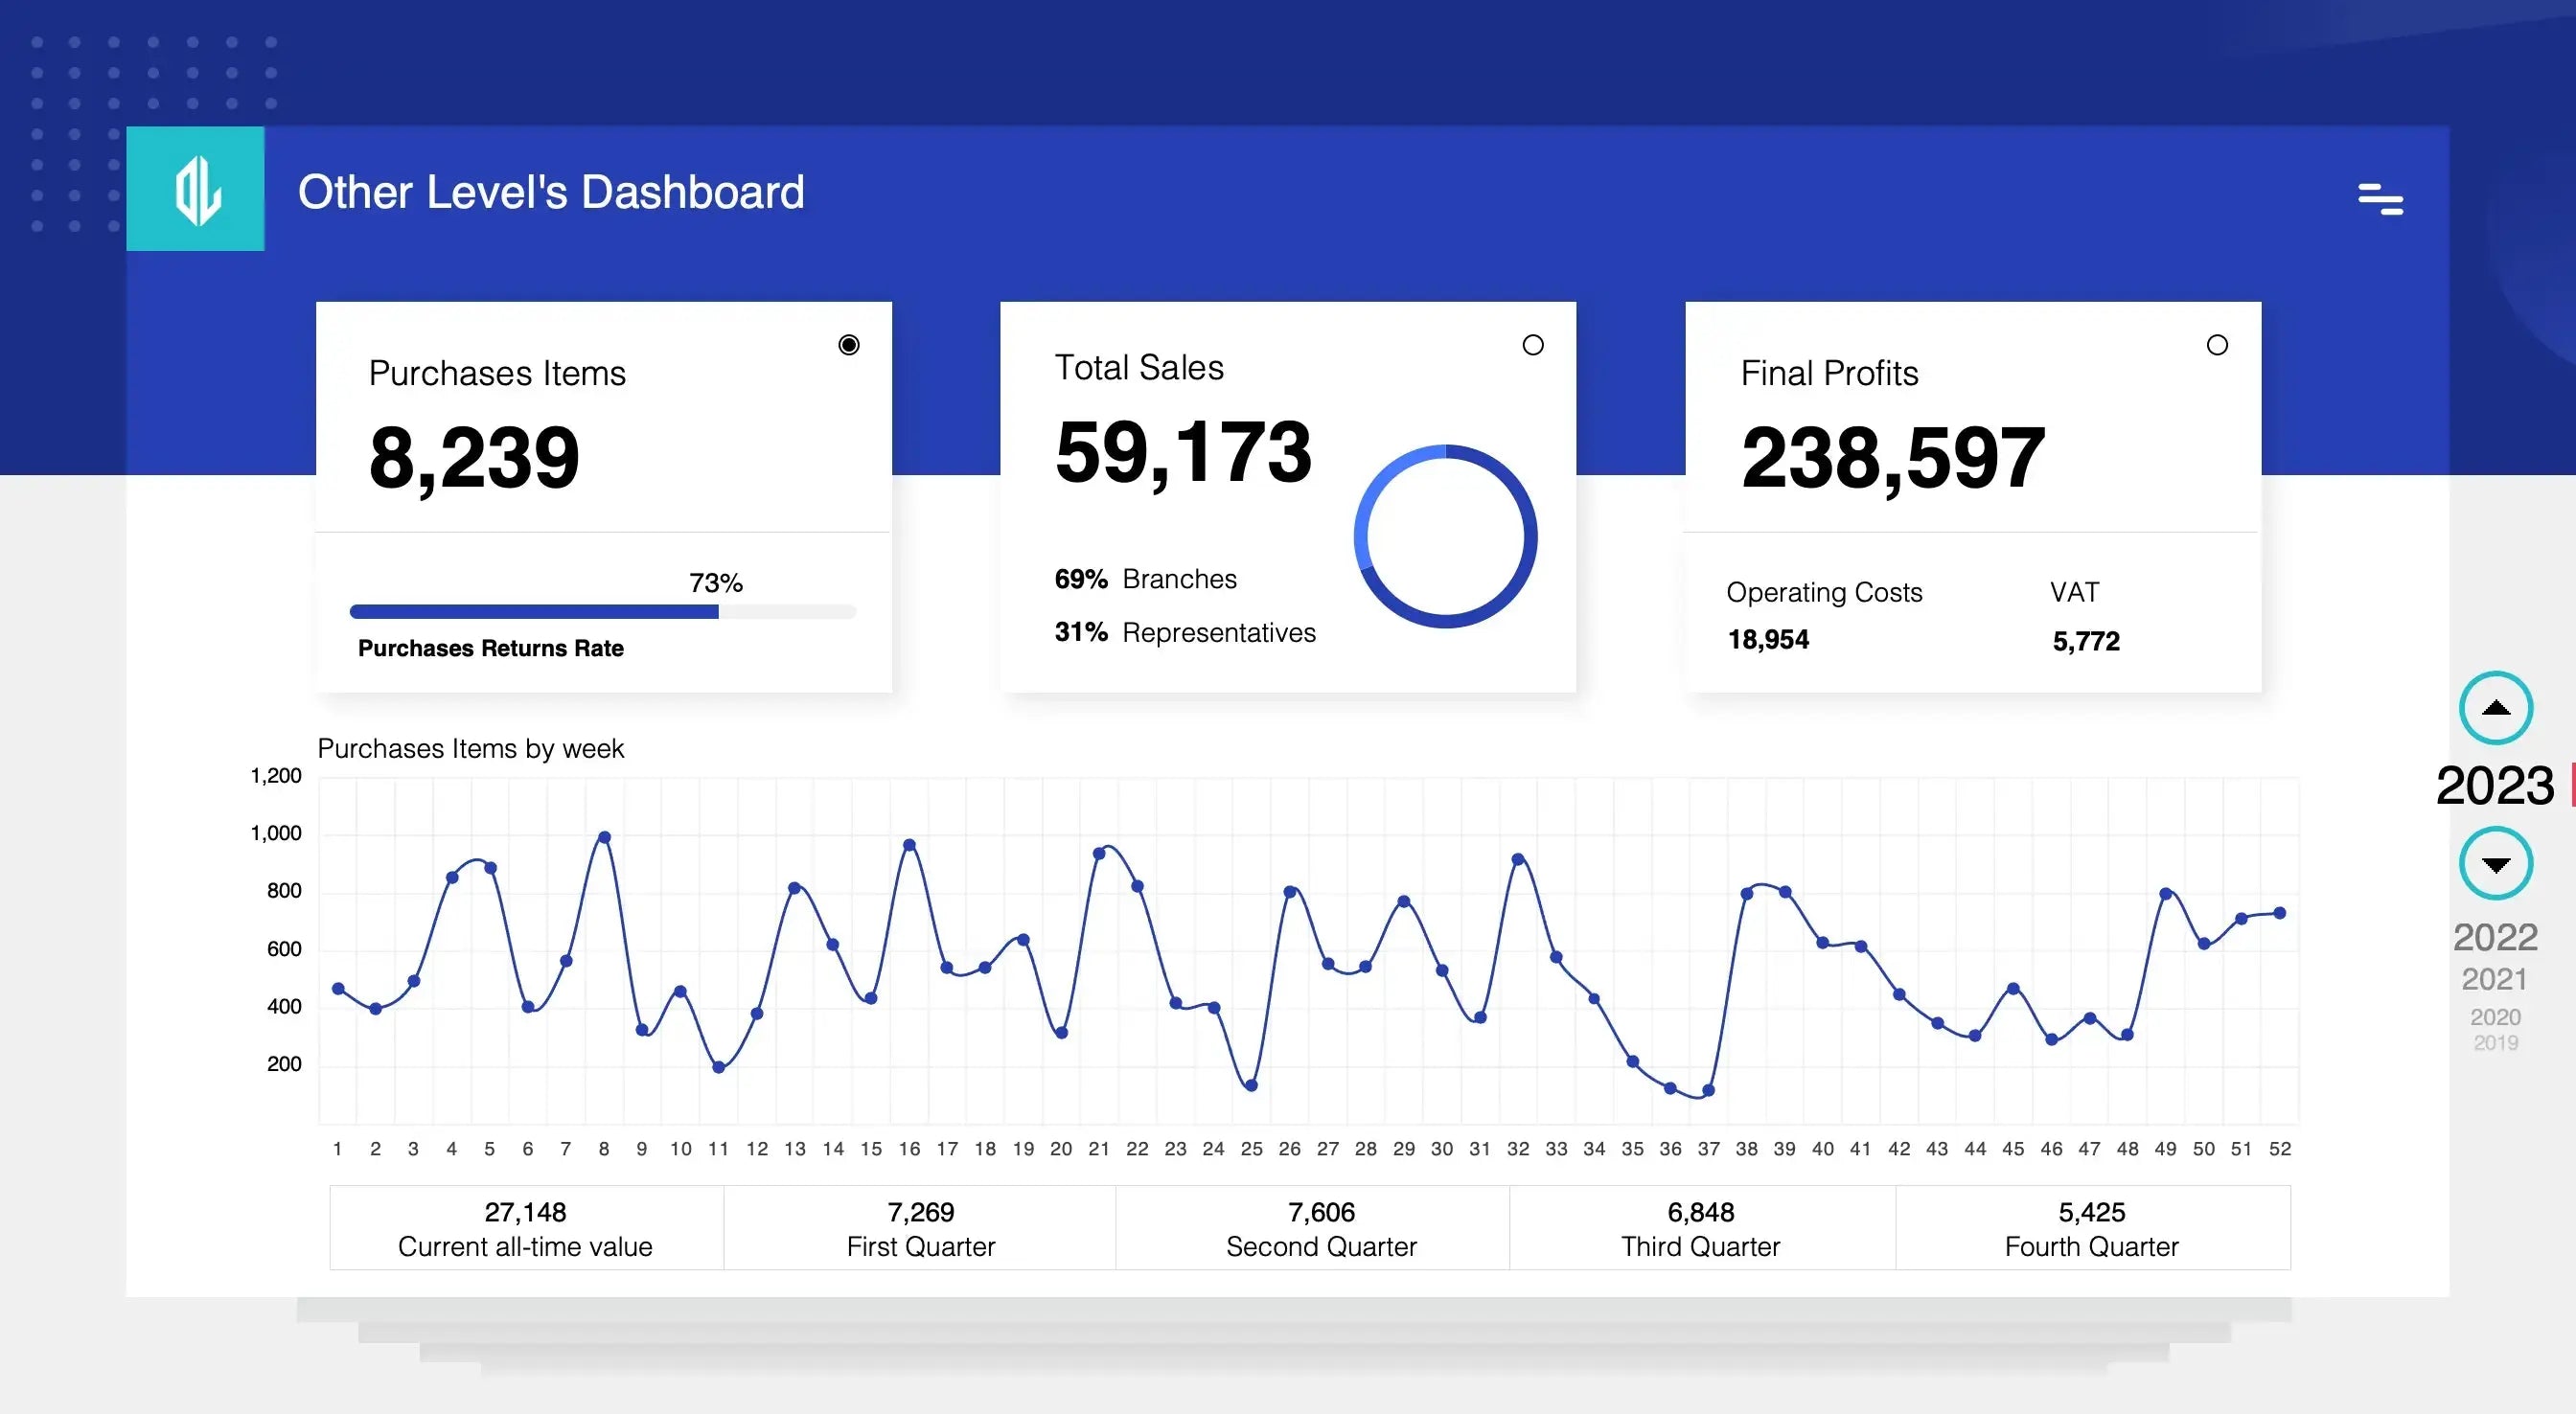
Top KPIs that make sense
Three crisp KPI cards: Purchases with a progress bar for returns; Sales with a donut split by branches and reps—ideal for sales performance management; Profits broken down with costs and VAT for instant profit and loss clarity. Metrics align to recognized financial kpi standards.
Trends you can spot instantly
A clean Line Chart surfaces weekly peaks, dips, and seasonality to drive sales growth. Quarterly tiles (Q1–Q4) summarize totals beneath the trend, while a running cumulation shows momentum—answering the leadership question: “How are we trending this year versus last?”
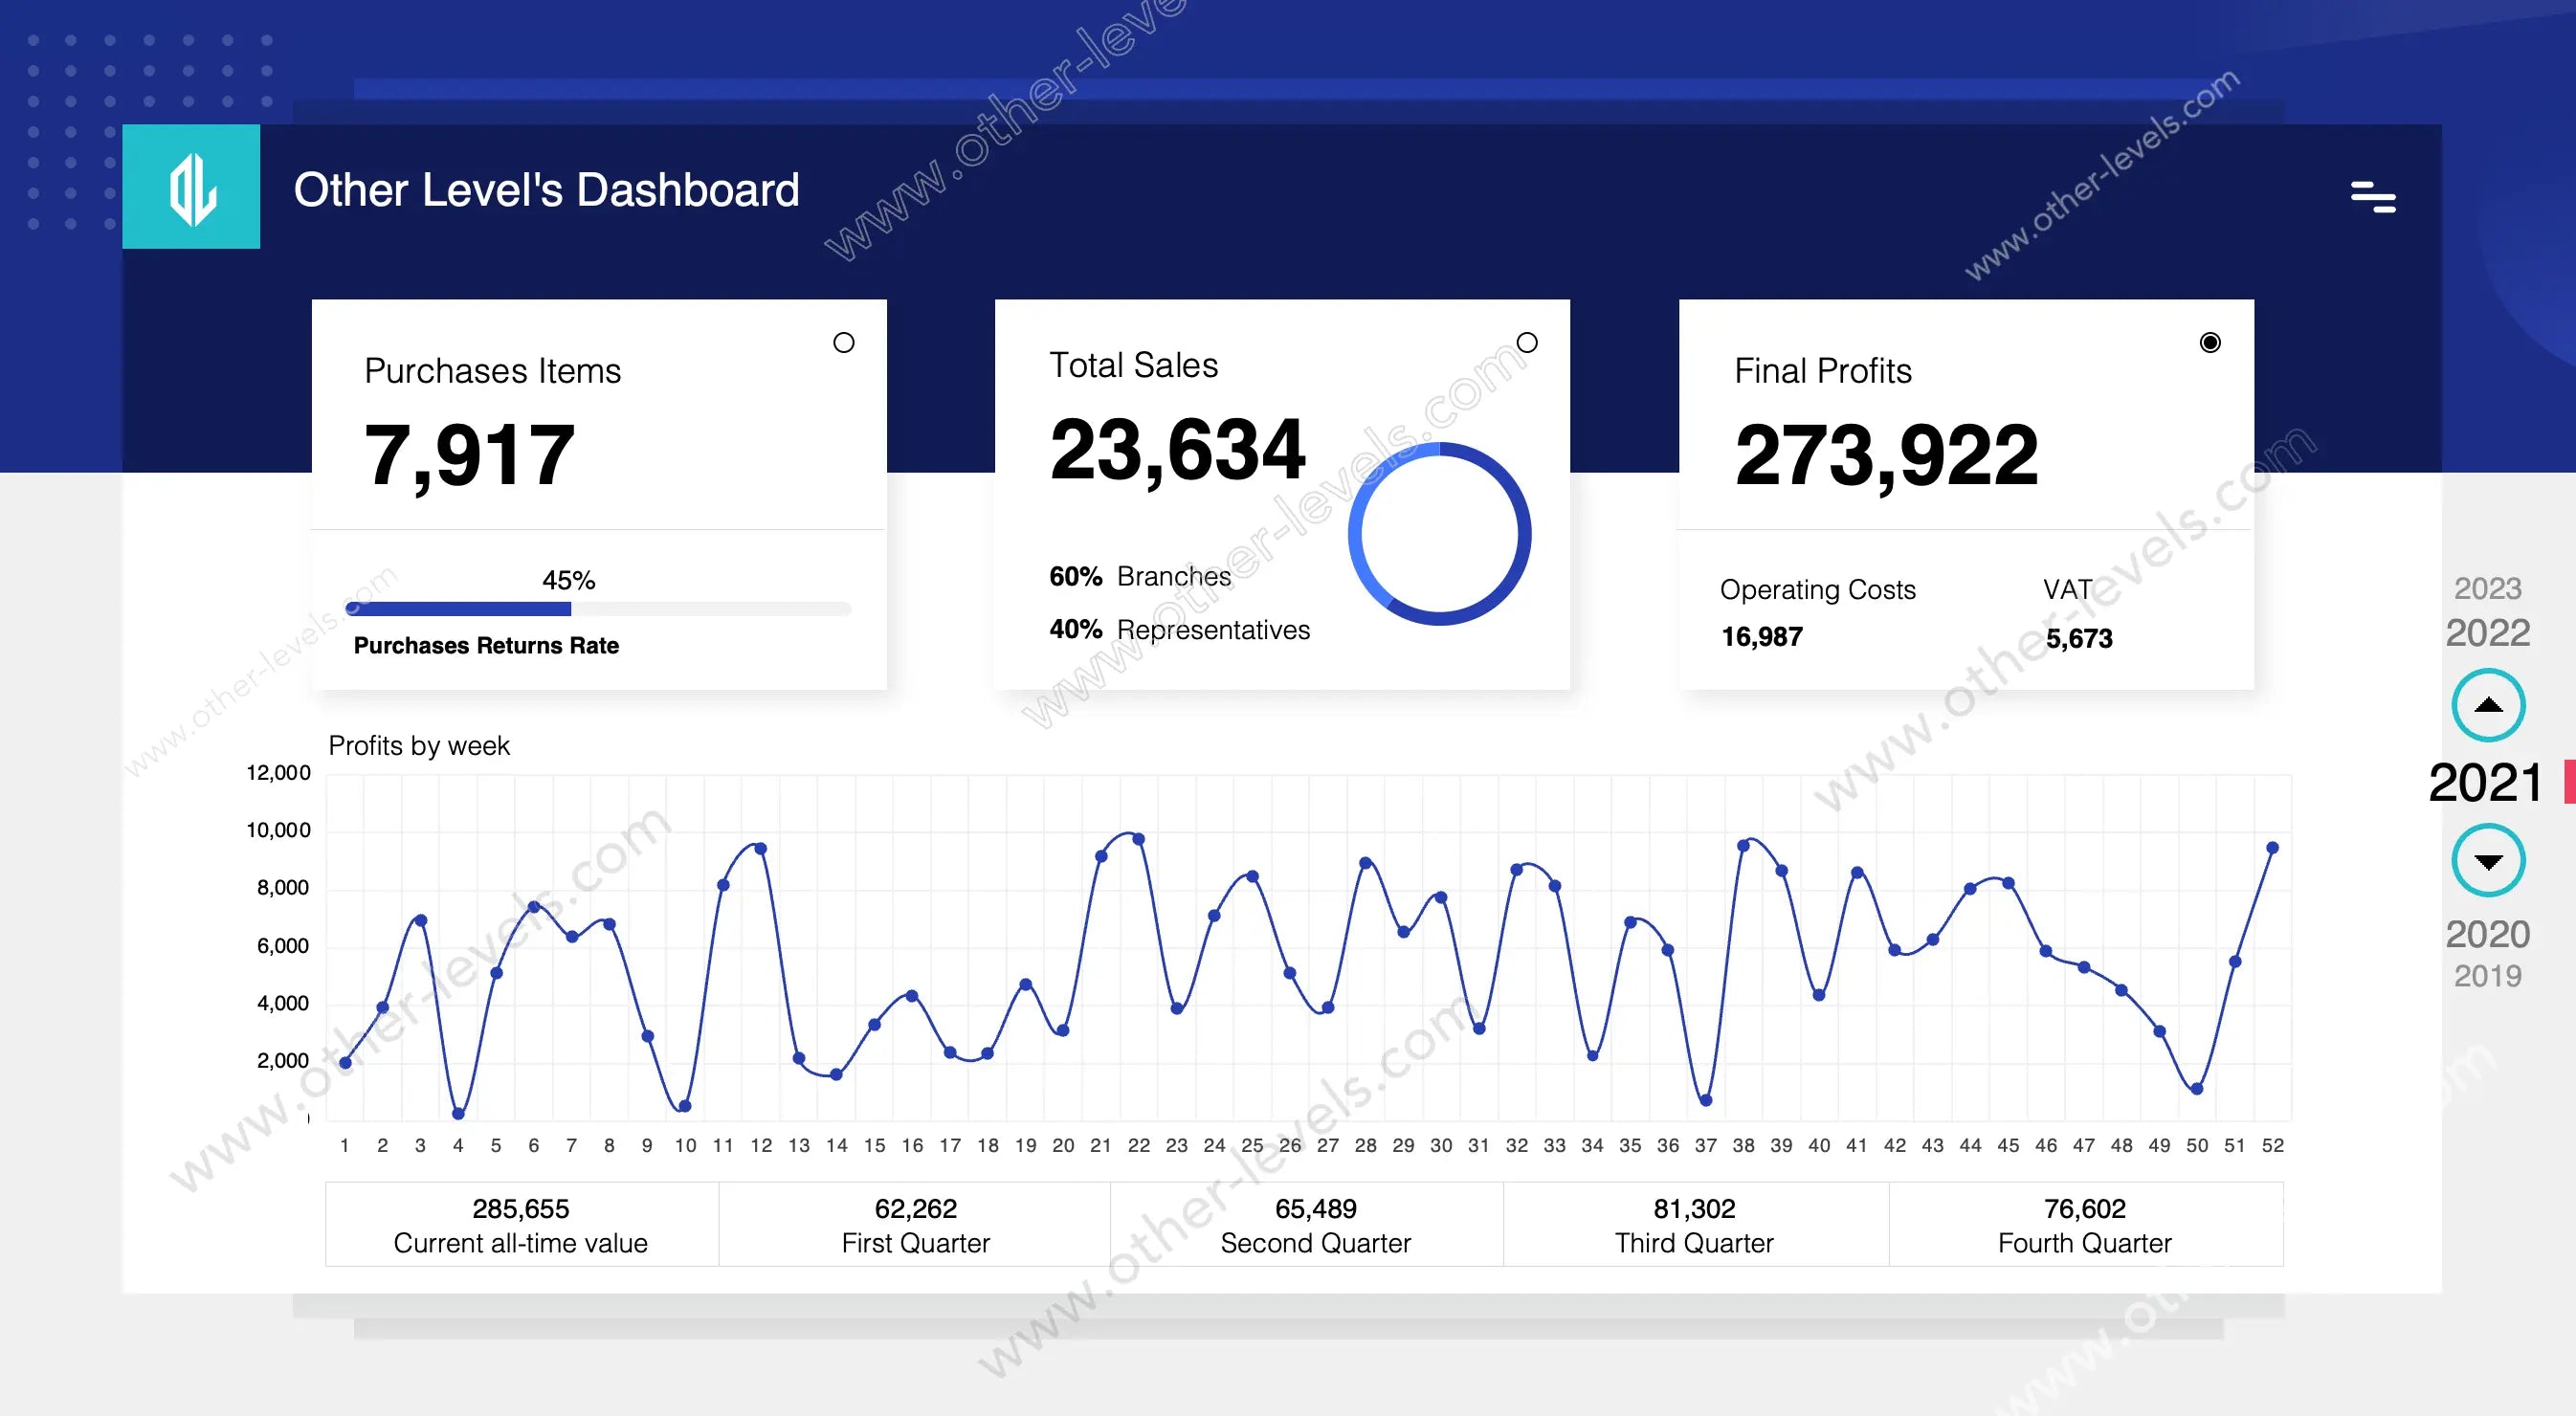
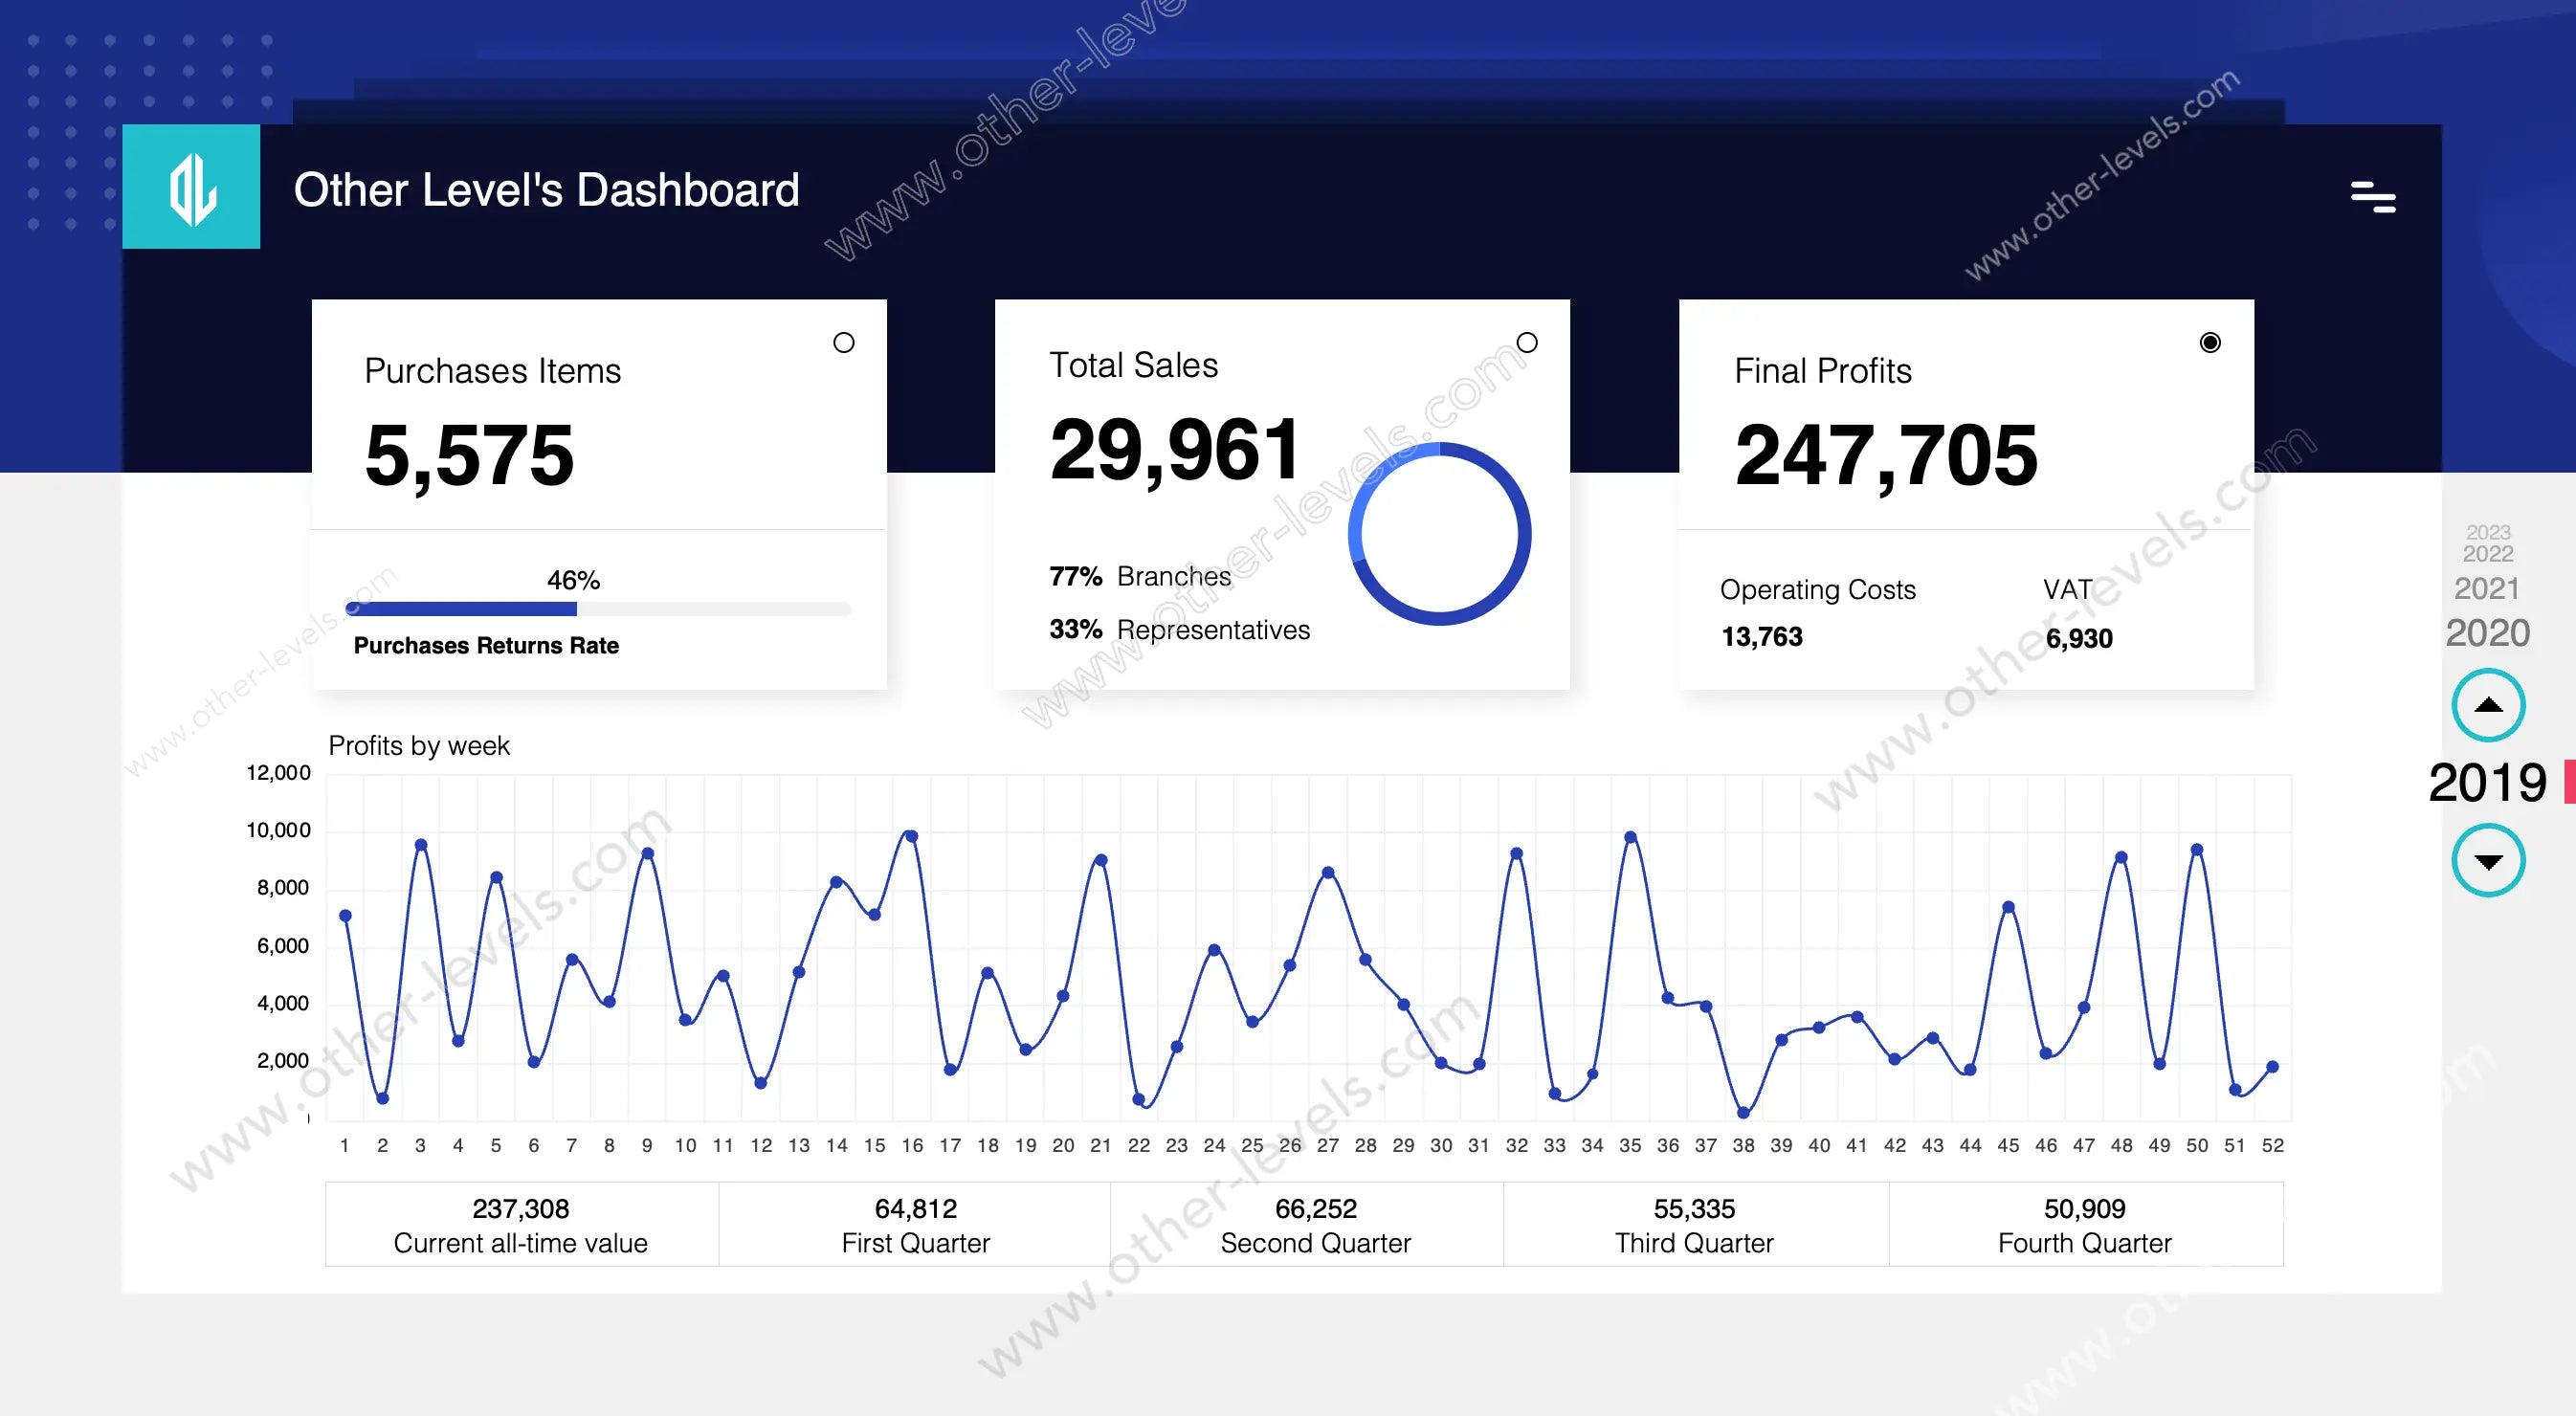
Compare years with one click
A year slicer (2019–2023) refreshes every KPI, chart, and total instantly—faster and clearer than scrolling raw sheets, with transparent drill-down for audit.
Chart Types You’ll See
- KPI Cards – headline numbers for purchases, sales, profits.
- Progress Bar – Purchases Return Rate tracking.
- Donut Chart – sales split by branches and reps.
- Line Chart – weekly flow of purchases, sales, or profits.
- Quarterly Totals – compact summaries under the trend line.
- Year Slicer – one control that drives the entire view.
Profitability Analysis
Beyond revenue, you get the full profit and loss picture—costs, VAT, and margins—so converting to a profit and loss template for finance packs is straightforward. For advanced breakdowns, see the Dynamic Profit & Loss Dashboard with Interactive Slicers & Smart Indic.
Margins without the confusion
Built-in profit margin calculation clarifies weekly and quarterly margin drivers, distinguishes gross margin vs gross profit, and keeps calculating profit margin consistent across channels.
Purchasing Insights
The Purchases area goes beyond totals. A progress bar highlights return rates for key purchase insights on supplier quality and purchasing effectiveness. Align with a purchase order template excel or a signed purchase order template to complete the source-to-pay workflow.
Sales Intelligence
The donut reveals where sales originate (branches vs reps) while the weekly line captures campaign impacts and demand shifts—real-world sales analysis and everyday sales performance management.
Reporting & Export
Outputs are presentation-ready. Clean tables and tidy charts drop into board packs, finance decks, or your excel format for expense reports. Under the hood, pivot tables, named ranges, and robust formulas preserve a reliable financial performance story on refresh.
Who it’s for
Business owners get a fast read on business performance. Analysts get repeatable sales analysis and margin tracking. Finance and operations get a professional Excel Dashboard aligned to reporting standards and ready to scale.
Video Tutorial — Dynamic Sales Growth Dashboard in Excel
Prefer to see it in action? Here’s a practical walkthrough showing how each piece works together in real scenarios.
Engagement & Sales Performance Dashboard in Excel tutorial
Watch the full tutorial on our Other Levels YouTube Channel
Specifications
Get all essential details in one place. From features and package contents to software compatibility and skill level required, this section gives you a clear overview so you know exactly what to expect before download.
Template Features
Package Details
Software Compatibility
Skill Level Required
Advanced
FAQs
Please read our FAQs page to find out more.
Are the templates fully customizable?
Yes, all our templates are fully customizable. You can adjust the layout, data, and design elements to fit your specific needs. Our templates are designed to be flexible, allowing you to easily tailor them to your preferences.
Can I order a product in any language?
Yes, we provide products in any language. Simply select the "Dashboard language change" Service and once your order is placed, you will receive it within 48 hours.
What happens if I choose the wrong monitor screen size for my dashboard?
If you choose the wrong screen size, the dashboard may not display correctly on your monitor. Elements could appear too large, too small, or misaligned, affecting the readability and usability of the dashboard. We recommend selecting the appropriate screen size to ensure optimal viewing and performance.
Do I need specific skills to use the advanced Excel dashboard templates?
Our advanced Excel dashboards are easy to use, the only thing you need to know is how to work with PivotTables. With basic knowledge of PivotTables, you'll be able to customize and fully utilize these templates effortlessly. "Please check the skill level required"
All dashboards are 100% editable Excel files. Learn how to use them through our video tutorials, included datasets, and lifetime access program.