
✅ Instant Digital Delivery | 🔒 Secure Checkout | ⭐ Trusted by 1,000+ Professionals | 💬 24hr Support
Revenue Management and Customer Engagement Metrics
Pairs well with
Revenue Management and Customer Engagement Metrics – Excel Spreadsheet Template
This sales Spreadsheet keeps the story simple. Here’s the thing: you open it, and the right accounts pop out. You’ll notice the strongest opportunities first, then the weak spots. In practice, it’s a fast way to align revenue management with a realistic customer engagement strategy.
What You Can Analyze
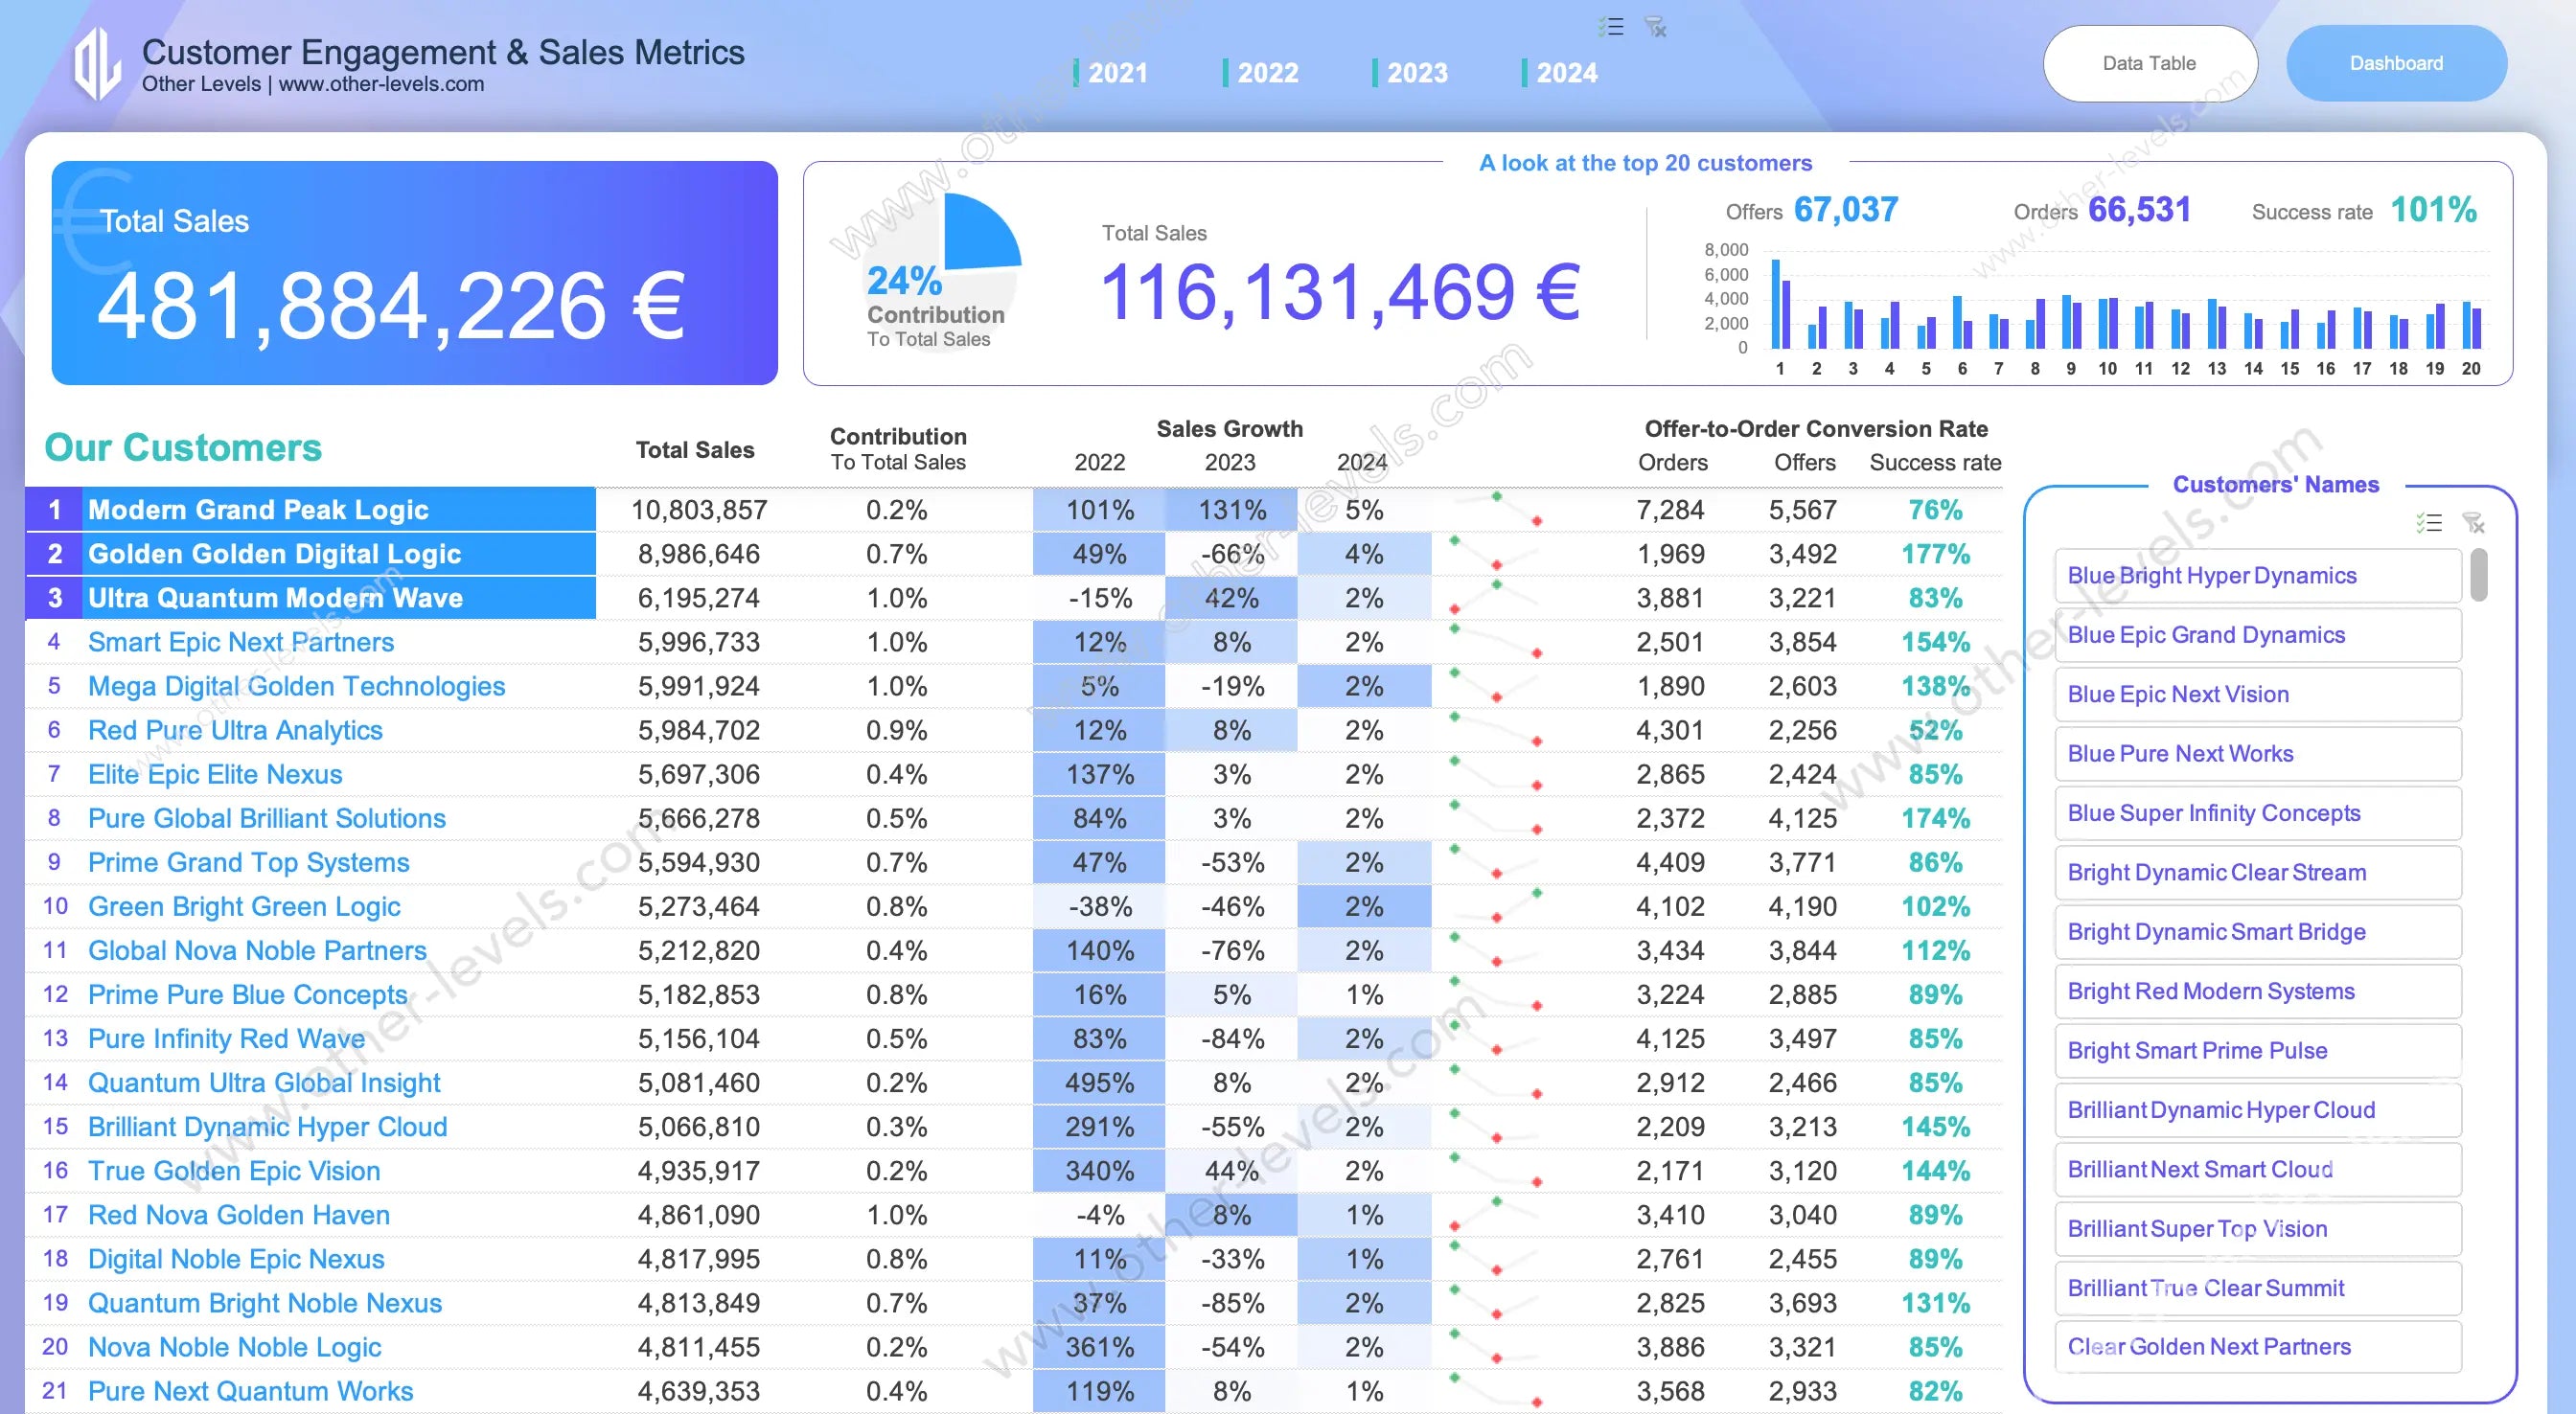
Total Sales at a Glance
See overall customer sales for your current filters. Keep a short list of the sales metrics to track so teams focus on what actually moves results.
Contribution to Total
Which accounts carry the load? The share view shows concentration, so you can spread risk or double down—without guesswork.
Top Customers View
You’ll notice quick bars for offers and orders, plus a clear success rate to compare engagement quality across the top accounts. It’s the fast scan you need before a meeting.
Customer Leaderboard
A ranked table tells the running story—customer names, revenue share, recent trend markers, and the pulse of sales growth. Skim it like headlines; dive in when something spikes or stalls.
Conversion and Engagement
Offers on one side, orders on the other. A single conversion rate formula ties it together. No hunting through sheets, no mental math.
Multi-Year Context
Year-over-year changes reveal if momentum is real or just a blip. In practice, this is where forecasting gets grounded.
Interactive Controls
Year Slicer
Toggle one year for focus or a few for context. It’s your call.
Customer Slicer
Zoom into a segment or isolate a single account. You’ll notice outliers fast.
One-Click Navigation
Jump between Dashboard and Data Table with buttons. No scrolling marathons.
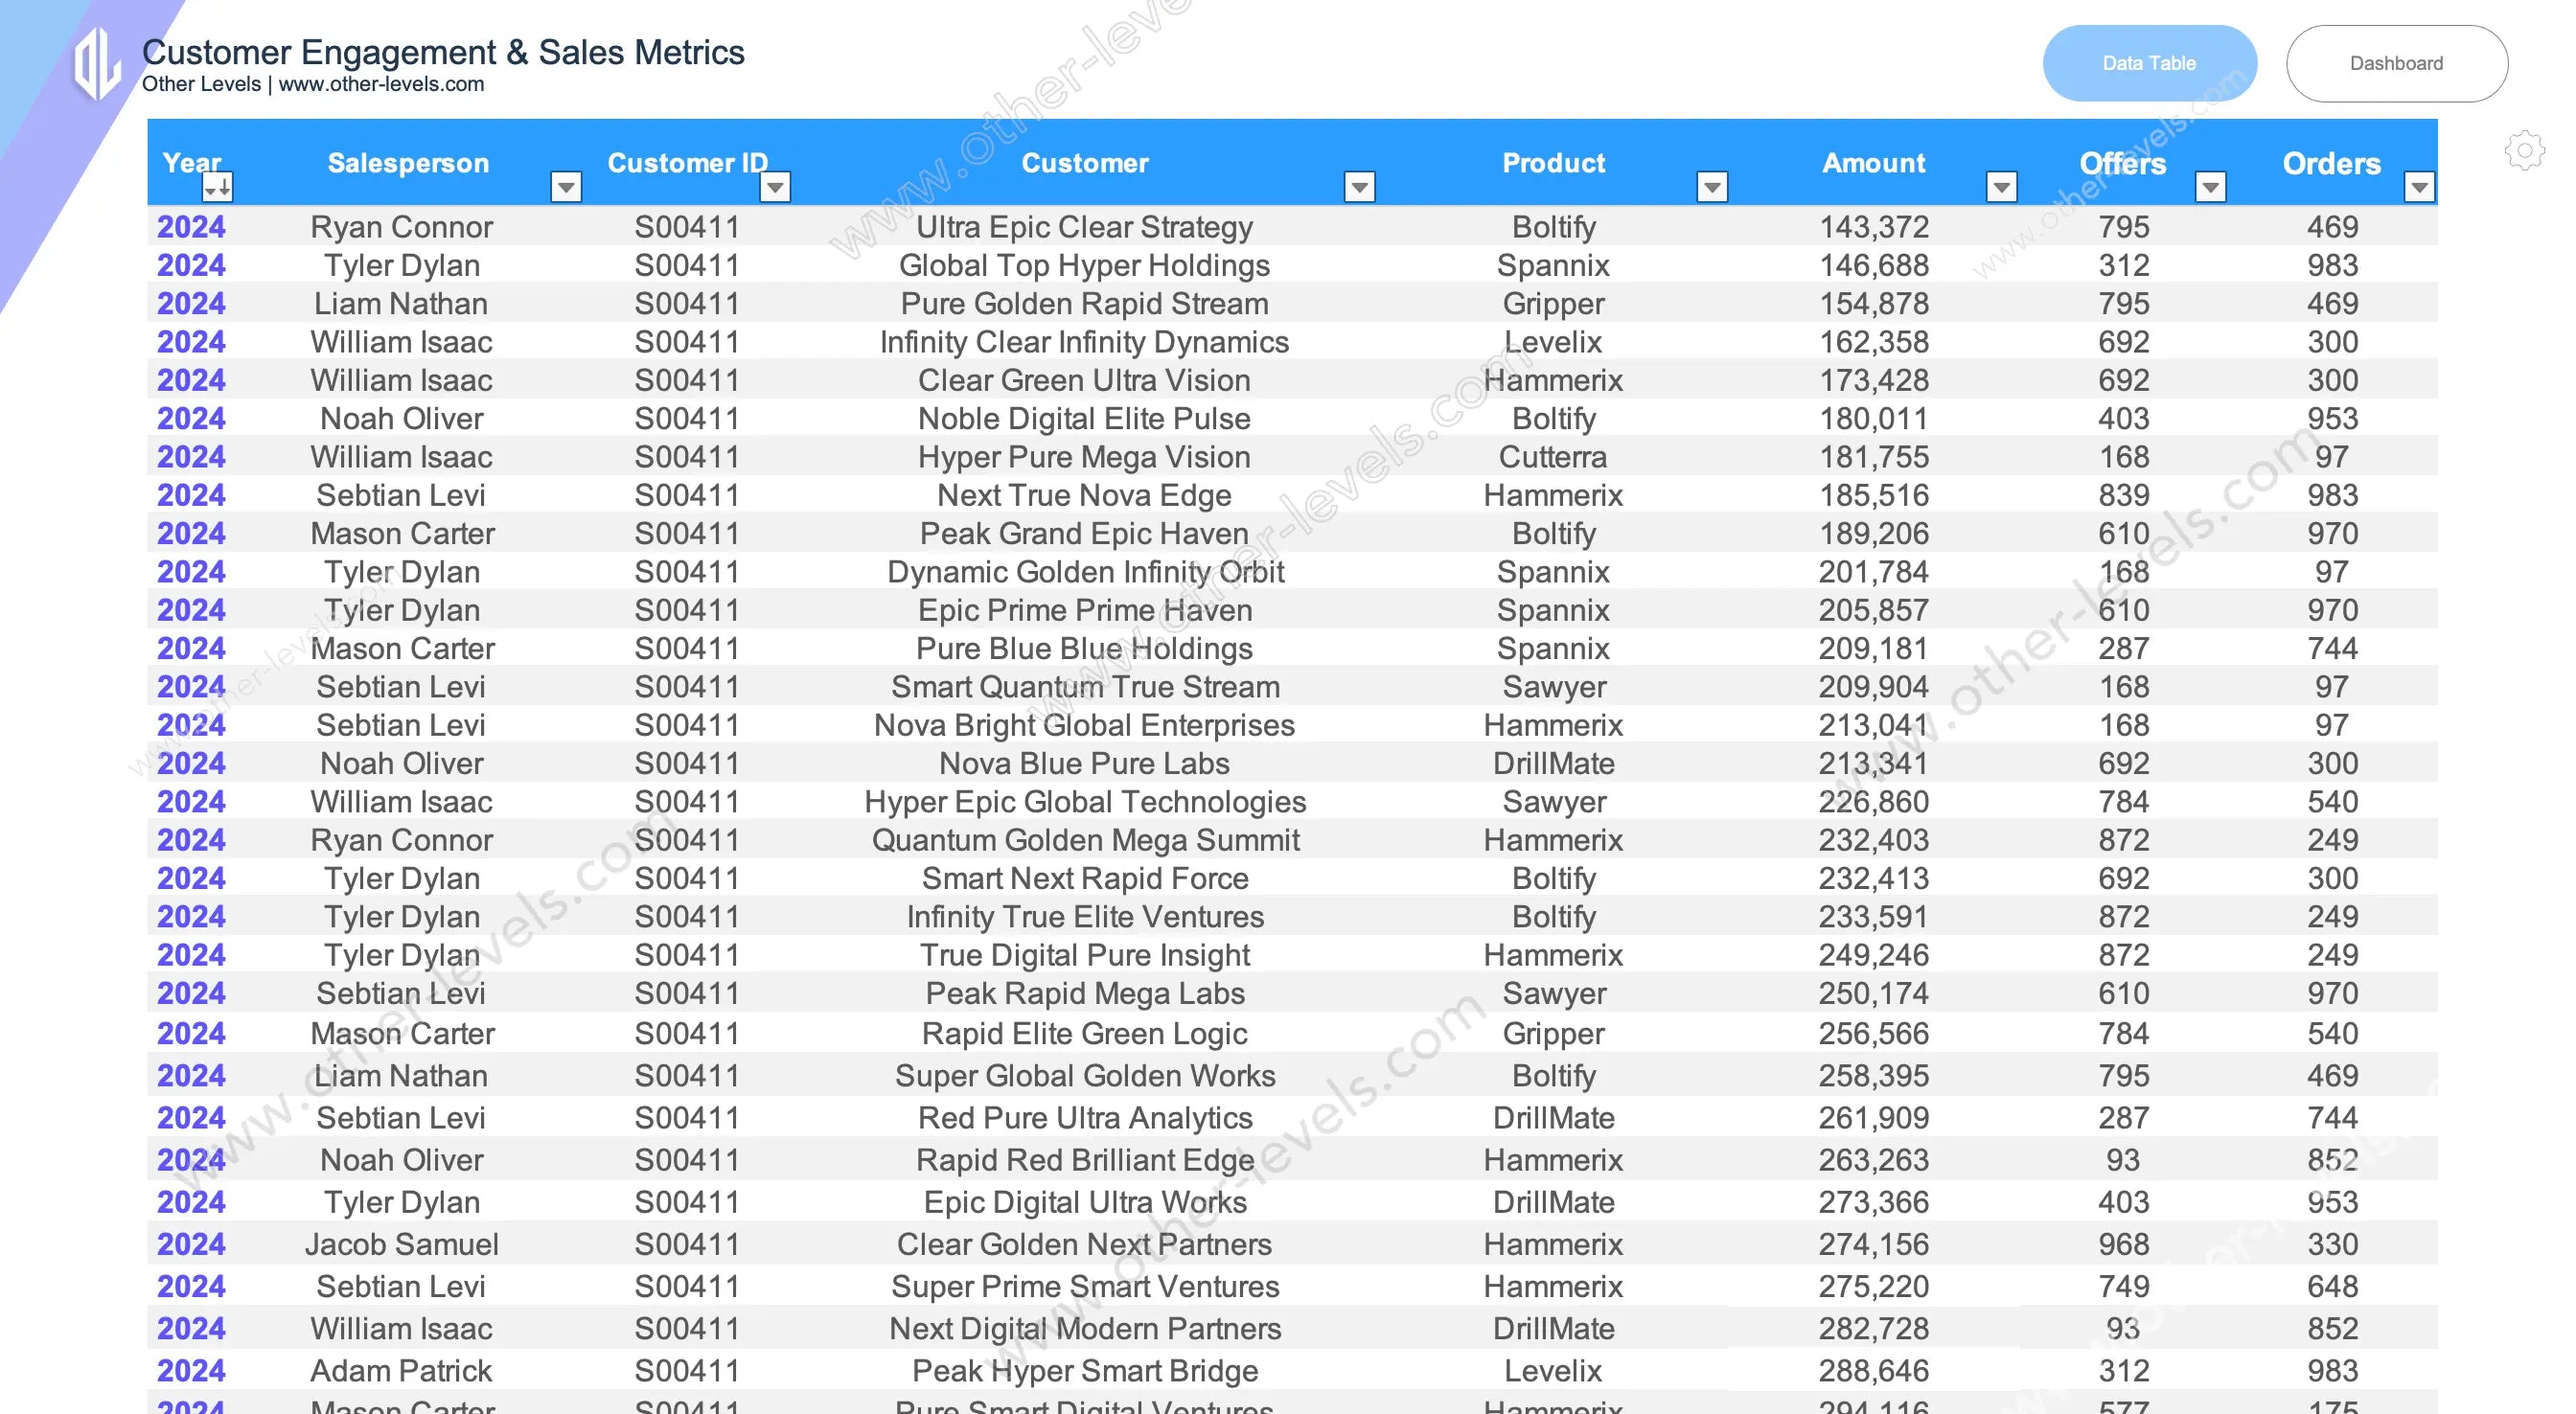
The Data Behind It
Transaction Table
Clean columns for Year, Salesperson, Customer ID, Customer, Product, Amount, Offers, and Orders. Filters are ready the moment you paste your data.
Built for Speed
Structured as an Excel Table for reliable grouping and quick ad-hoc views. In practice, that means fewer formulas to babysit.
Easy Refresh
Drop in new rows and watch everything update. No VBA. No drama.
How Metrics Work
Contribution Percentage
Each customer’s sales divided by the current total. Simple. Comparable. Actionable.
Conversion & Engagement
One definition across the board so teams argue less and act more. The math is consistent, the view is immediate.
Growth Signals
Year-over-year change highlights lift or decline. Great for pipeline health checks before committing targets.
Top-N Ranking
Auto-sort by sales with flexible cutoffs—Top 10, Top 20, or whatever your review cadence needs.
Customer Analytics & Strategy
Decision Support
Use it alongside your customer analytics software to get fast customer insights and analytics at the account level. It’s the practical bridge between raw exports and weekly decisions.
From Insight to Action
Spot issues, then plan follow-ups. In practice, that might mean a pricing review, a save play, or a cross-sell push—whatever the data suggests next.
Related Dashboards
If you want to go deeper—strategy, actions, and profitability—these pair nicely with this workbook:
- Sales Analysis & Action Plans Roadmap Excel Dashboard — map priorities, set next steps, and track progress without losing the story.
- Sales Growth & Net Profit Margin Excel Dashboard — watch growth and margin trends together, then decide where to push or protect.
Who It’s For
Revenue & Sales Teams
Leaders and analysts who own targets, forecasts, and core sales metrics.
Account & Client Services
Managers who live in renewals, expansions, and day-to-day client services work.
What’s Included
Files & Layout
An Excel workbook with a clean Dashboard and a detailed Data Table—ready to present.
Starter Data
A small sample so you can see structure, then replace it with your own source.
Design & Editing
Brand colors, fonts, and currency symbols are easy to change. Keep it on-brand without breaking formulas.
Customization Options
Branding & KPIs
Tweak the palette, typography, and primary KPIs to match how your team reports.
Scope & Ranking
Change the Top-N cut, add fields like region or channel, or introduce new measures as you grow.
Data Connections
Paste fresh exports or connect a source. The model updates and you’re ready for the next review.
Watch the Tutorial
Watch the full tutorial on our Other Levels YouTube Channel
Specifications
Get all essential details in one place. From features and package contents to software compatibility and skill level required, this section gives you a clear overview so you know exactly what to expect before download.
Template Features
Package Details
Software Compatibility
Skill Level Required
Beginner
FAQs
Please read our FAQs page to find out more.
Are the templates fully customizable?
Yes, all our templates are fully customizable. You can adjust the layout, data, and design elements to fit your specific needs. Our templates are designed to be flexible, allowing you to easily tailor them to your preferences.
Can I order a product in any language?
Yes, we provide products in any language. Simply select the "Dashboard language change" Service and once your order is placed, you will receive it within 48 hours.
What happens if I choose the wrong monitor screen size for my dashboard?
If you choose the wrong screen size, the dashboard may not display correctly on your monitor. Elements could appear too large, too small, or misaligned, affecting the readability and usability of the dashboard. We recommend selecting the appropriate screen size to ensure optimal viewing and performance.
Do I need specific skills to use the advanced Excel dashboard templates?
Our advanced Excel dashboards are easy to use, the only thing you need to know is how to work with PivotTables. With basic knowledge of PivotTables, you'll be able to customize and fully utilize these templates effortlessly. "Please check the skill level required"
All dashboards are 100% editable Excel files. Learn how to use them through our video tutorials, included datasets, and lifetime access program.