

Supercharge Excel Dashboards Using the INDIRECT Function with Named Ranges
Wouldn’t it be great to reference a range dynamically using a variable or text in Microsoft Excel? That’s exactly what the INDIRECT function does — and when combined with Named Ranges, it becomes a powerful tool for building flexible and interactive dashboards. This smart combination helps create sheets that automatically adjust based on user inputs, dropdowns, or changing parameters.
Why Use INDIRECT with Named Ranges in Excel
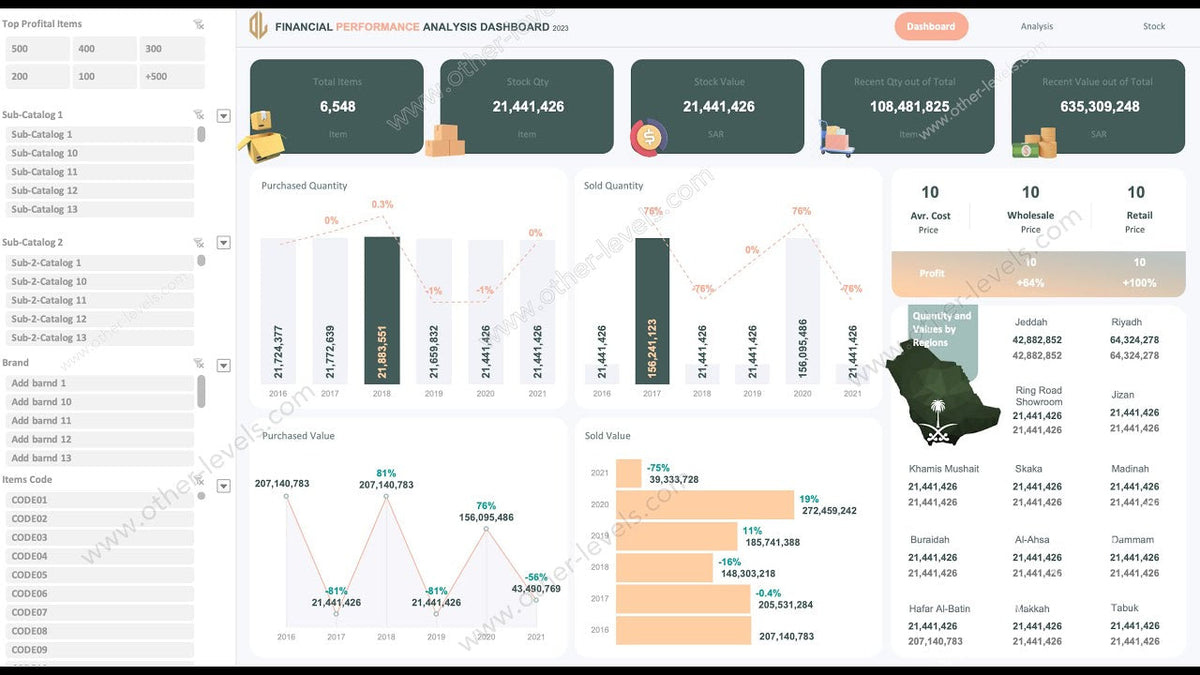
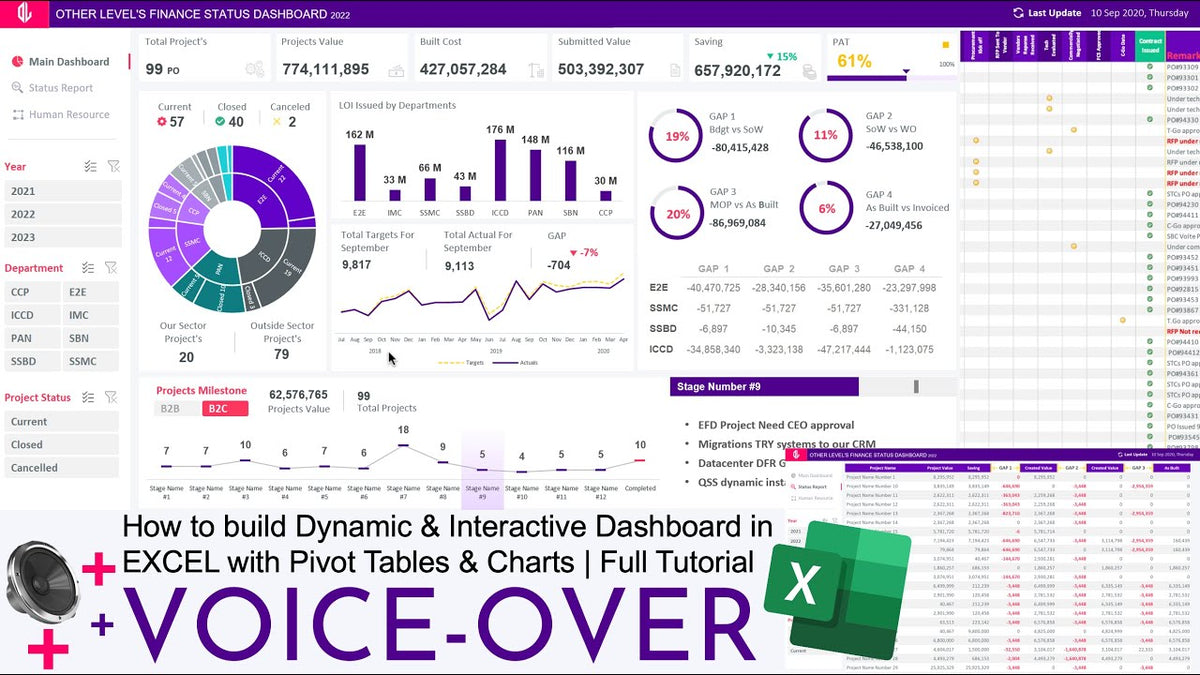
From Dashboard Templates to Supply Chain Dashboards, the INDIRECT function adds dynamic referencing that eliminates hard-coded formulas. It’s perfect for scalable models, custom reports, and self-updating dashboards that respond instantly to user selections.
Practical Uses of INDIRECT + Named Ranges
- Create flexible dropdown lists with dependent selections.
- Build reports that update automatically as users switch regions or products.
- Develop interactive Personal Finance Dashboards that adapt dynamically to user choices.
- Reduce manual editing by replacing static references with dynamic logic.
How to Create a Dynamic Named Range Lookup
- Create Named Ranges: Use Formulas → Name Manager to name ranges like EastSales or WestSales.
- Make a Dropdown: Add a data validation list of your region names.
-
Use INDIRECT in formulas: Example →
=SUM(INDIRECT(A1))automatically adds values from the selected range.
Pro Excel Tips
- Check spelling: INDIRECT won’t recognize typos in range names.
- Note performance: It’s volatile, so limit use in large files.
- Pair it with
ADDRESS()orR1C1for advanced references. - Ideal for dependent dropdowns, dynamic charts, and regional summaries.
Learn More with Other Levels
Discover how to build advanced dashboards with formulas, named ranges, and automation on Other Levels or watch tutorials on the Other Levels YouTube Channel.

Share:
Create Dynamic Headers and Titles using Microsoft Excel
Use Formulas to Filter Data in Microsoft Excel