

Excel Freeze Panes – Lock Headers on Large Spreadsheets
Excel Freeze Panes keeps your headers in view while you scroll long worksheets. It speeds up comparisons, reduces errors, and makes big tables easier to navigate—whether you’re reviewing sales lines, KPIs, or project logs.
What Freeze Panes does
- Keeps header rows or key columns visible while scrolling.
- Makes wide, tall tables readable at a glance.
- Improves accuracy when comparing distant fields.
Freeze options explained
| Option | Purpose |
|---|---|
| Freeze Panes | Locks rows above and columns left of your selection. |
| Freeze Top Row | Keeps the first row visible while you scroll down. |
| Freeze First Column | Keeps column A visible while you scroll right. |
How to freeze panes (step-by-step)
Freeze Top Row
- Go to View → Freeze Panes → Freeze Top Row.
Freeze First Column
- Go to View → Freeze Panes → Freeze First Column.
Freeze both a row and a column
- Click the cell below the row and to the right of the column to lock (e.g., B2).
- Choose View → Freeze Panes → Freeze Panes.
Unfreeze panes
- Select View → Freeze Panes → Unfreeze Panes to return to normal scrolling.
Pro tips
- Combine with filters on the header row for quick sorting.
- Use Split for independent vertical and horizontal scrolling.
- For printing, set repeating headers via Page Layout → Print Titles.
Real-world uses
- HR: Keep employee names visible while viewing attendance.
- Sales: Compare months or regions without losing context.
- Academics: Lock student names when entering grades.
Keep building better dashboards
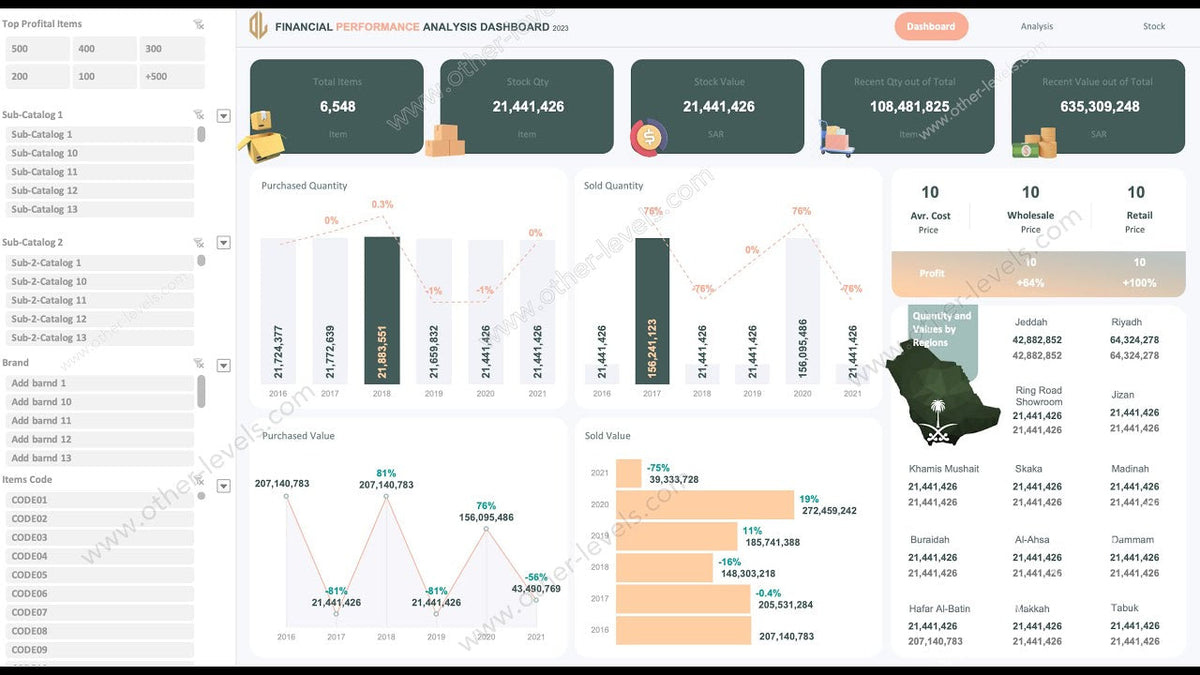
Explore templates and patterns that pair perfectly with frozen headers: Excel Dashboard, Dashboard Templates, and Sales Dashboard.


Share:
Generate Random Numbers in Excel Using RAND & RANDBETWEEN
Conditional Formatting in Excel to Highlight Data