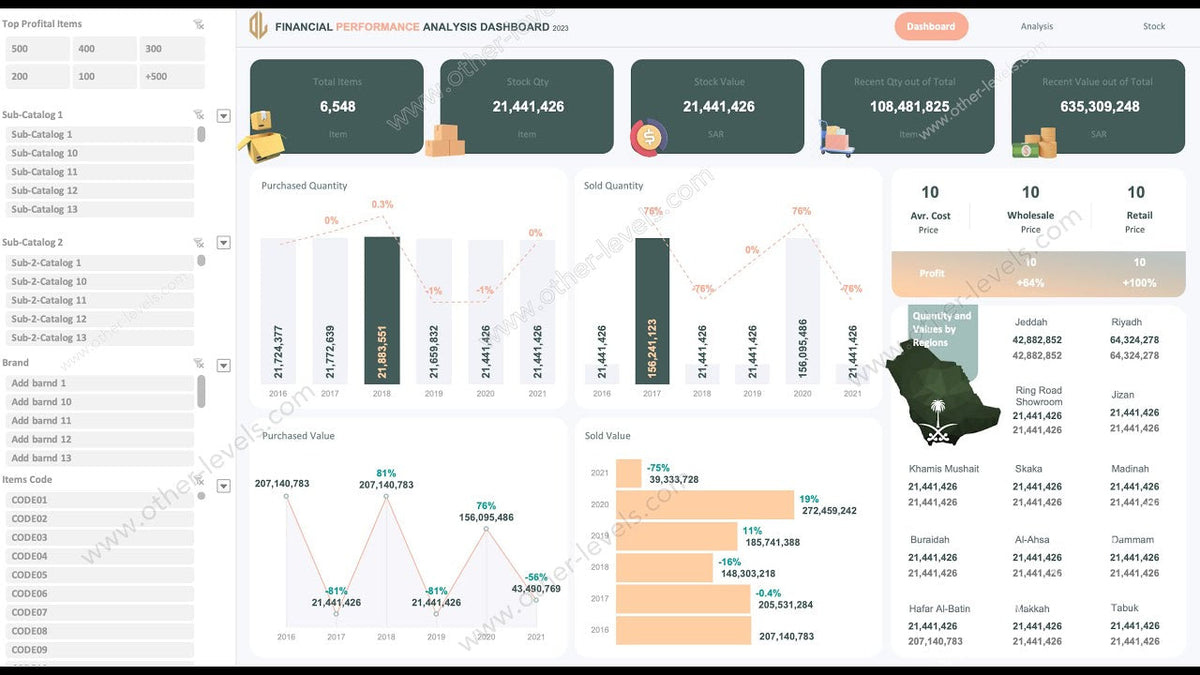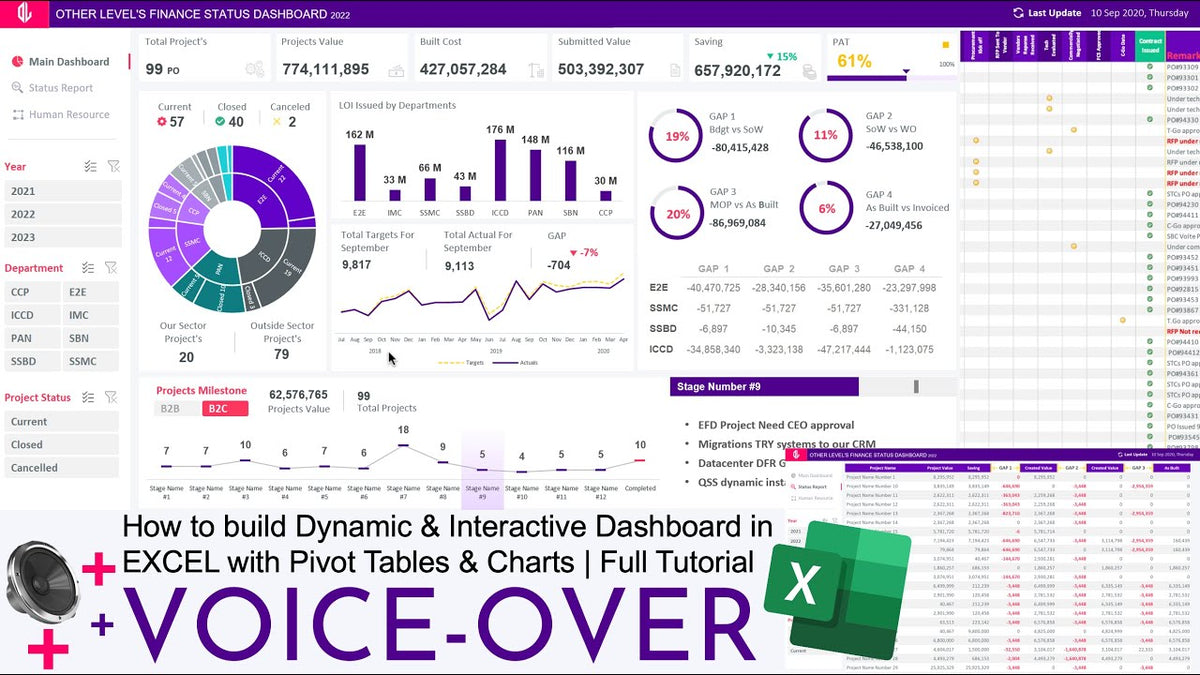
Watch the full Excel dashboard tutorial on YouTube


Key Features

  • Complete sales performance analysis across 50+ data categories
  • Fully editable Excel dashboard components and data tables
  • Optimized layout for Full HD and widescreen monitors
  • Preview images included for easy dashboard navigation
  • Free fonts and icons included
  • Clean structure for quick customization
  • No PivotTables or slicers required
  • Static optimized visuals for faster performance
  • Pre-built dashboard layouts ready for reporting

What’s Included

  • Excel file (.XLSX) — 7.59 MB
  • Three interactive dashboards
  • One structured database sheet
  • Instruction guide for setup and customization
  • Help & contents documentation

Download Free Sales Performance Dataset

3 comments

    • sangjin
    • November 6, 2024 at 12:32 pm

    저는 당신 회사의 프로그램을 경험하고 싶습니다.

    • Jacob Mnisi
    • November 6, 2024 at 12:32 pm

    Good Day
    I love and enjoy your video tutorials .It made me take excel to the new level

    • MANUEL ENRIQUE TOSCANO
    • November 6, 2024 at 12:32 pm

    EXELENTE APORTE, MUY BUENA LA EXPLICACION VISUAL, LOS FELICITO, CON ESTA AYUDA PDRE CRECER EN LO PERSONAL Y EN MI ÁMBITO LABORAL, MUCHISIMAS GRACIAS POR COMPARTIR TA HERMOSOS PROYECTOS.

Leave a comment

This site is protected by hCaptcha and the hCaptcha Privacy Policy and Terms of Service apply.

Free tool

Try it on your own data

Upload an Excel or CSV file and our free Dashboard Maker builds KPIs, trend charts and insights instantly. No sign-up needed.

  • Upload Excel (.xlsx) or CSV
  • KPIs, trends and top 10 in seconds
  • Private: your data stays in your browser
Try the Free Dashboard Maker →

Latest Stories

View all

Warehouse and Sales Dashboard in Excel: Map Charts and Ranking

Warehouse and Sales Dashboard in Excel: Map Charts and Ranking

Build a warehouse and product sales dashboard in Excel with a city map chart, yearly purchase trends, smart slicers and a retail price ranking page.

Read more about Warehouse and Sales Dashboard in Excel: Map Charts and Ranking

Supply Chain KPI Dashboard: 15 Metrics to Track + Excel Templates

The 15 supply chain KPIs worth tracking (OTIF, fill rate, inventory turns, freight cost and more), how to lay them out, and how to build the dashboard in Excel step by step.

Read more about Supply Chain KPI Dashboard: 15 Metrics to Track + Excel Templates

Build an Interactive Project Finance Dashboard in Excel Without VBA

Build an Interactive Project Finance Dashboard in Excel Without VBA

Step-by-step: build a finance and project milestone dashboard in Excel with slicers, sunburst charts, GAP analysis and a scroll-bar tracker, no VBA.

Read more about Build an Interactive Project Finance Dashboard in Excel Without VBA