✅ Instant Digital Delivery | 🔒 Secure Checkout | ⭐ Trusted by 1,000+ Professionals | 💬 24hr Support
Warehouse Performance Analytics - Inventory Excel Template
Pairs well with
Warehouse Performance Analytics – Inventory Excel Template Overview
This Excel Dashboard turns raw stock and sales into clear, decision-ready insight for busy teams. It’s a practical inventory excel template you can open, filter, and share in minutes. Managers move from a high-level snapshot to SKU detail quickly, improving warehouse management analytics without extra admin work.
Why this Excel Dashboard helps your warehouse
Open, filter, understand. Use slicers for brands, sub-catalogs, SKUs, and “top profitable” bands. The layout supports weekly reviews and daily standups, so your warehouse analytics stay focused on action—not formatting.
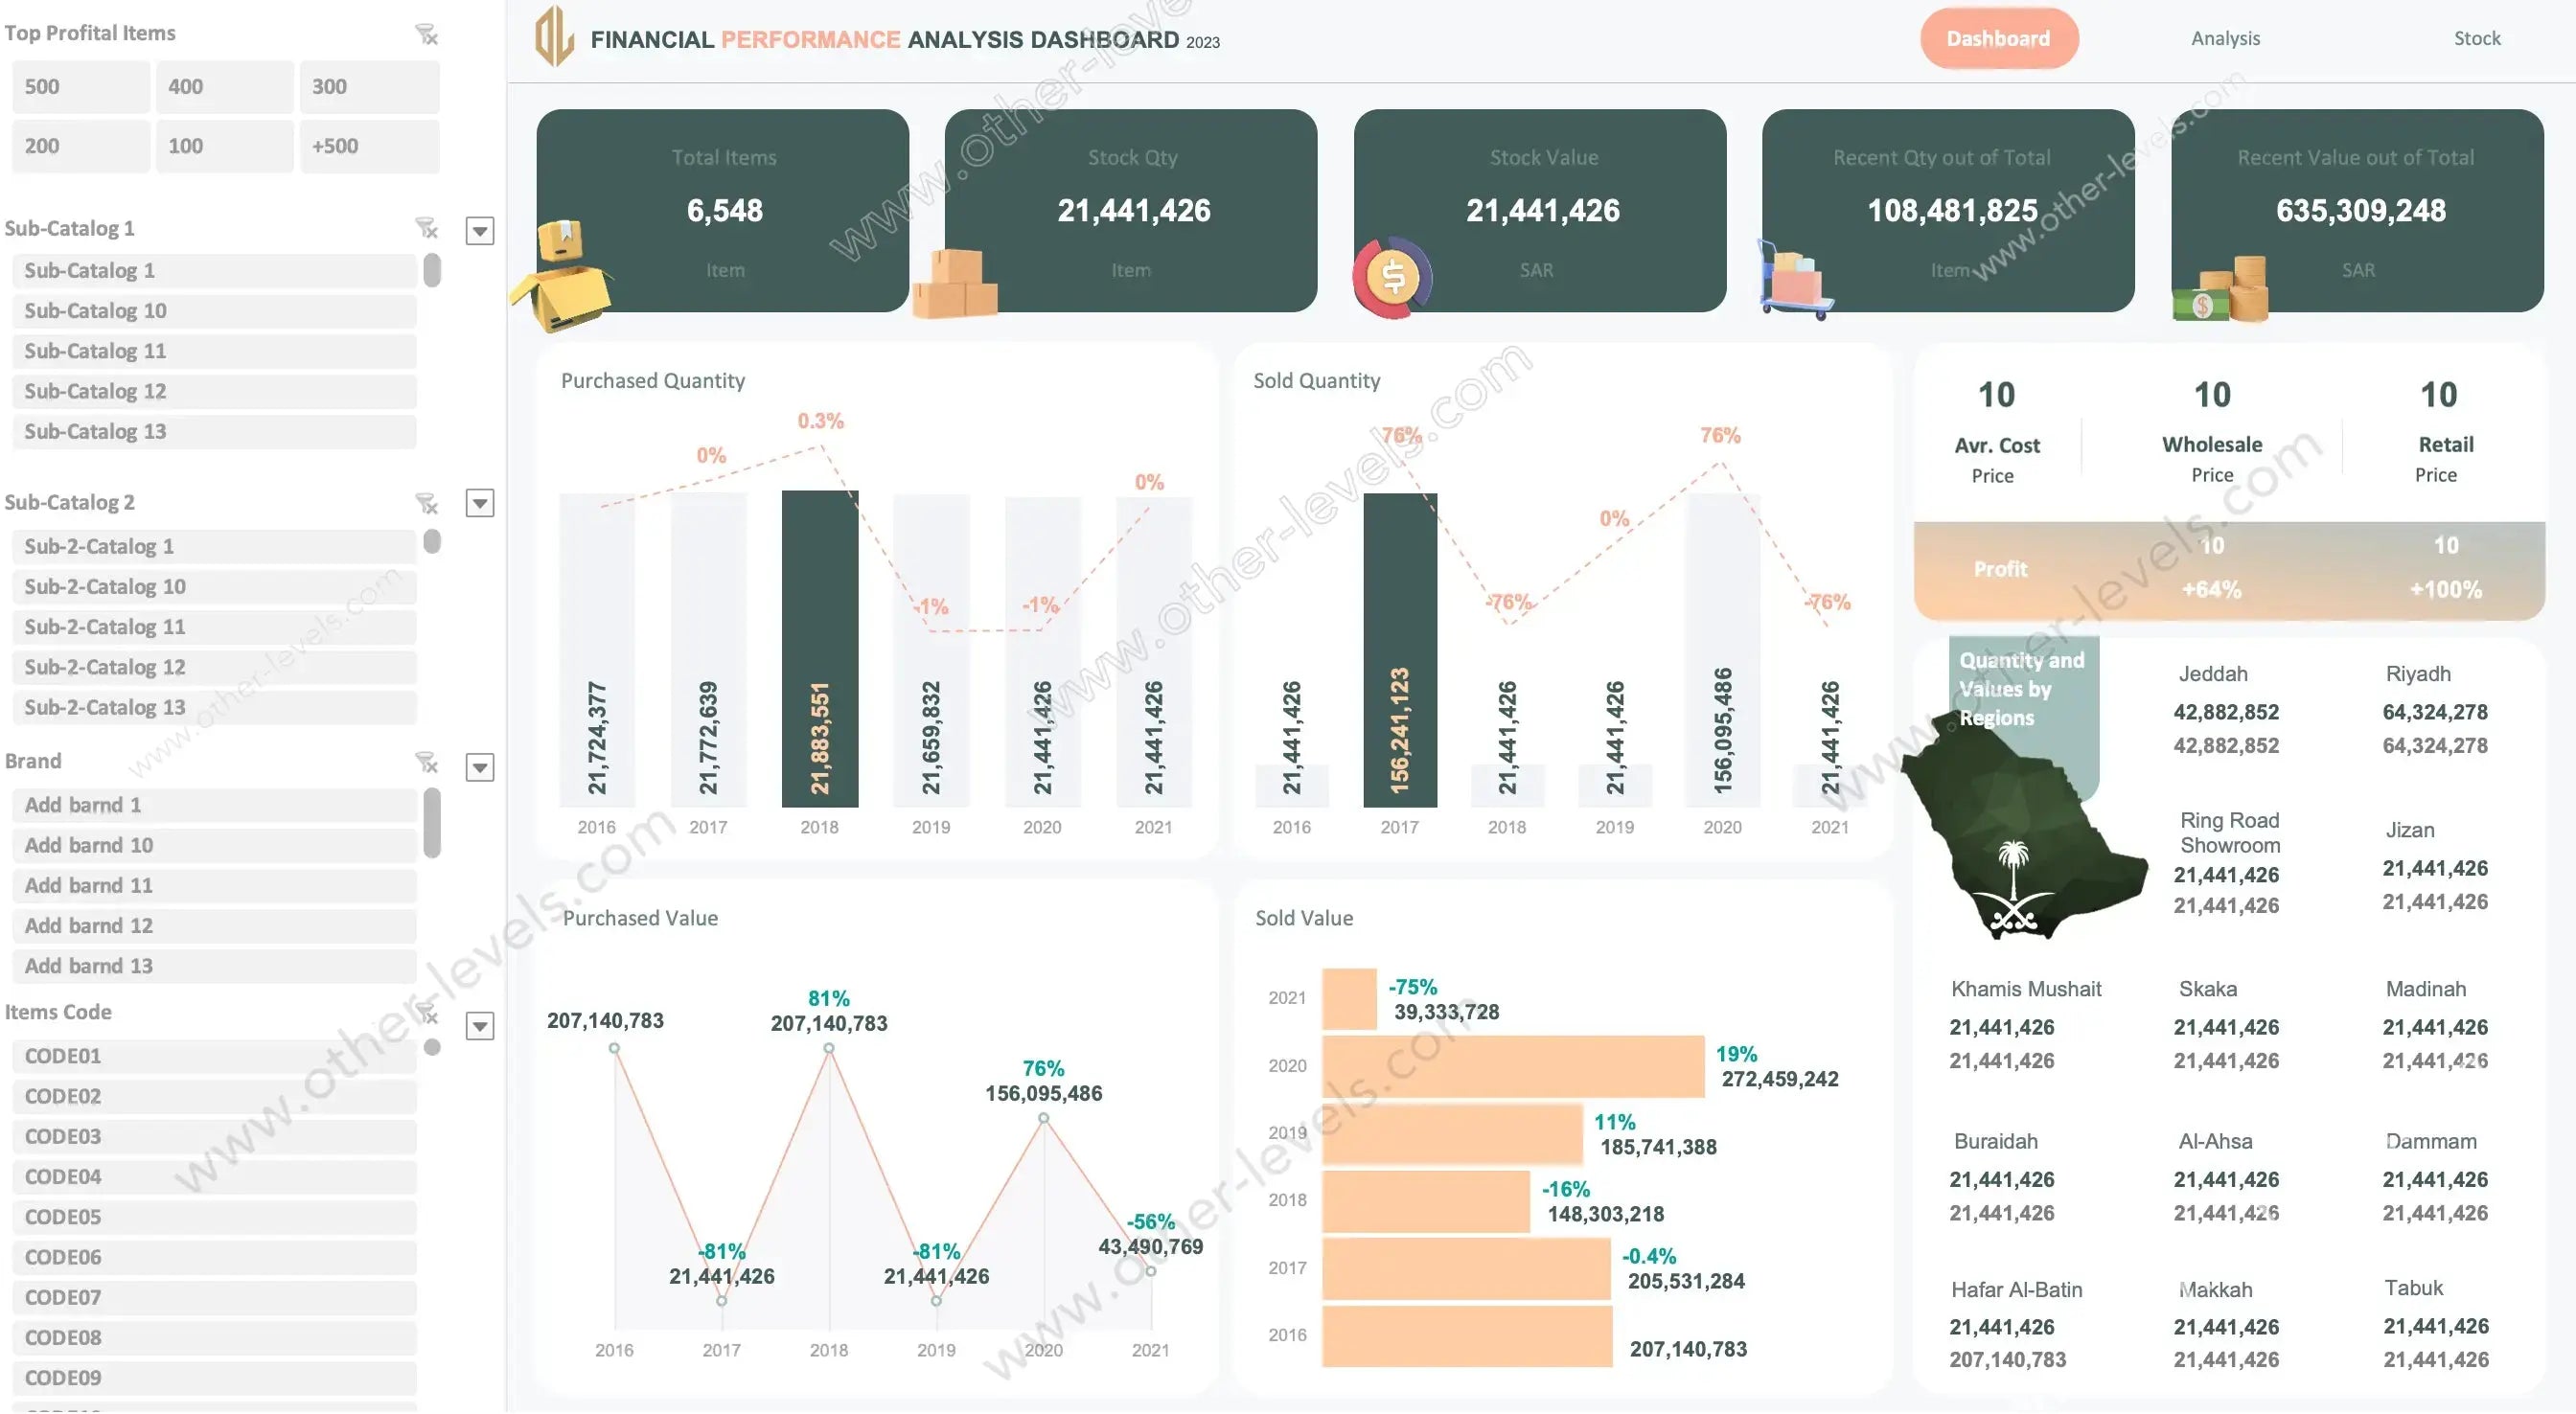
What you’ll see at a glance
- Executive KPIs: total items, stock quantity/value, recent movement vs total, quick profit signal
- Time series: Purchased Quantity (clustered columns + trend), Sold Quantity (columns + change), Purchased Value (line with markers), Sold Value (horizontal bars with deltas)
- Region view: filled map and ranked list for allocation planning
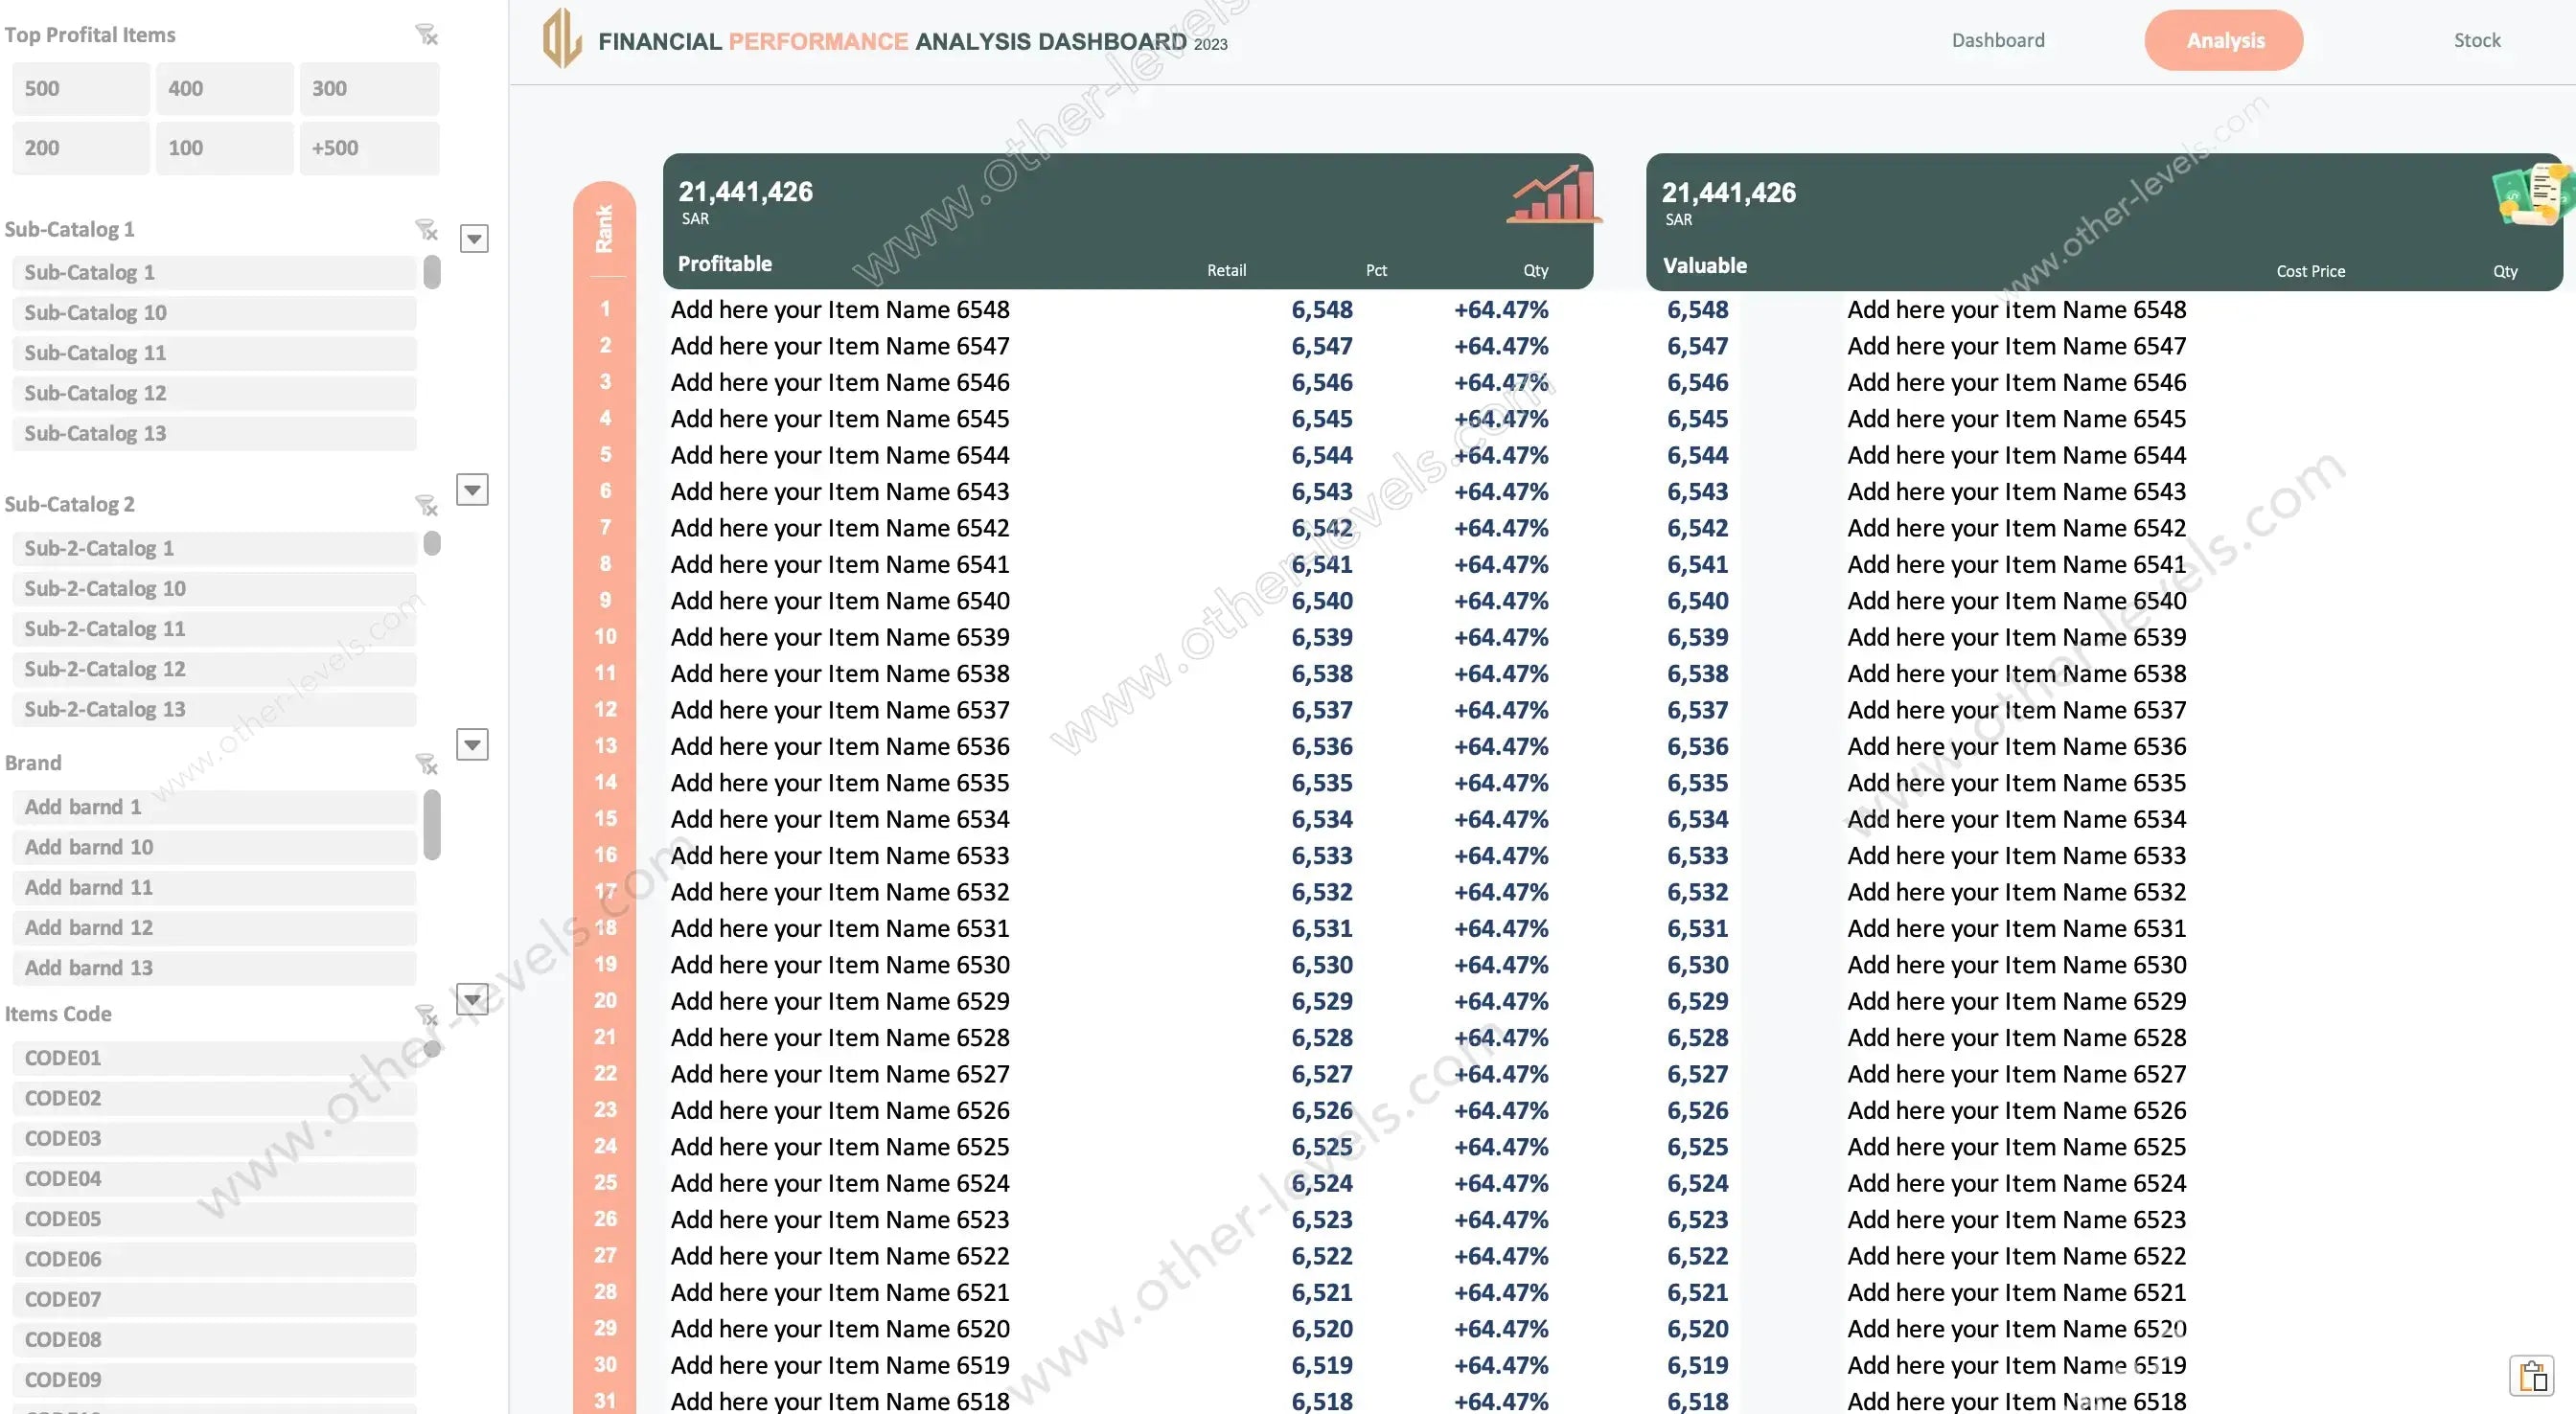
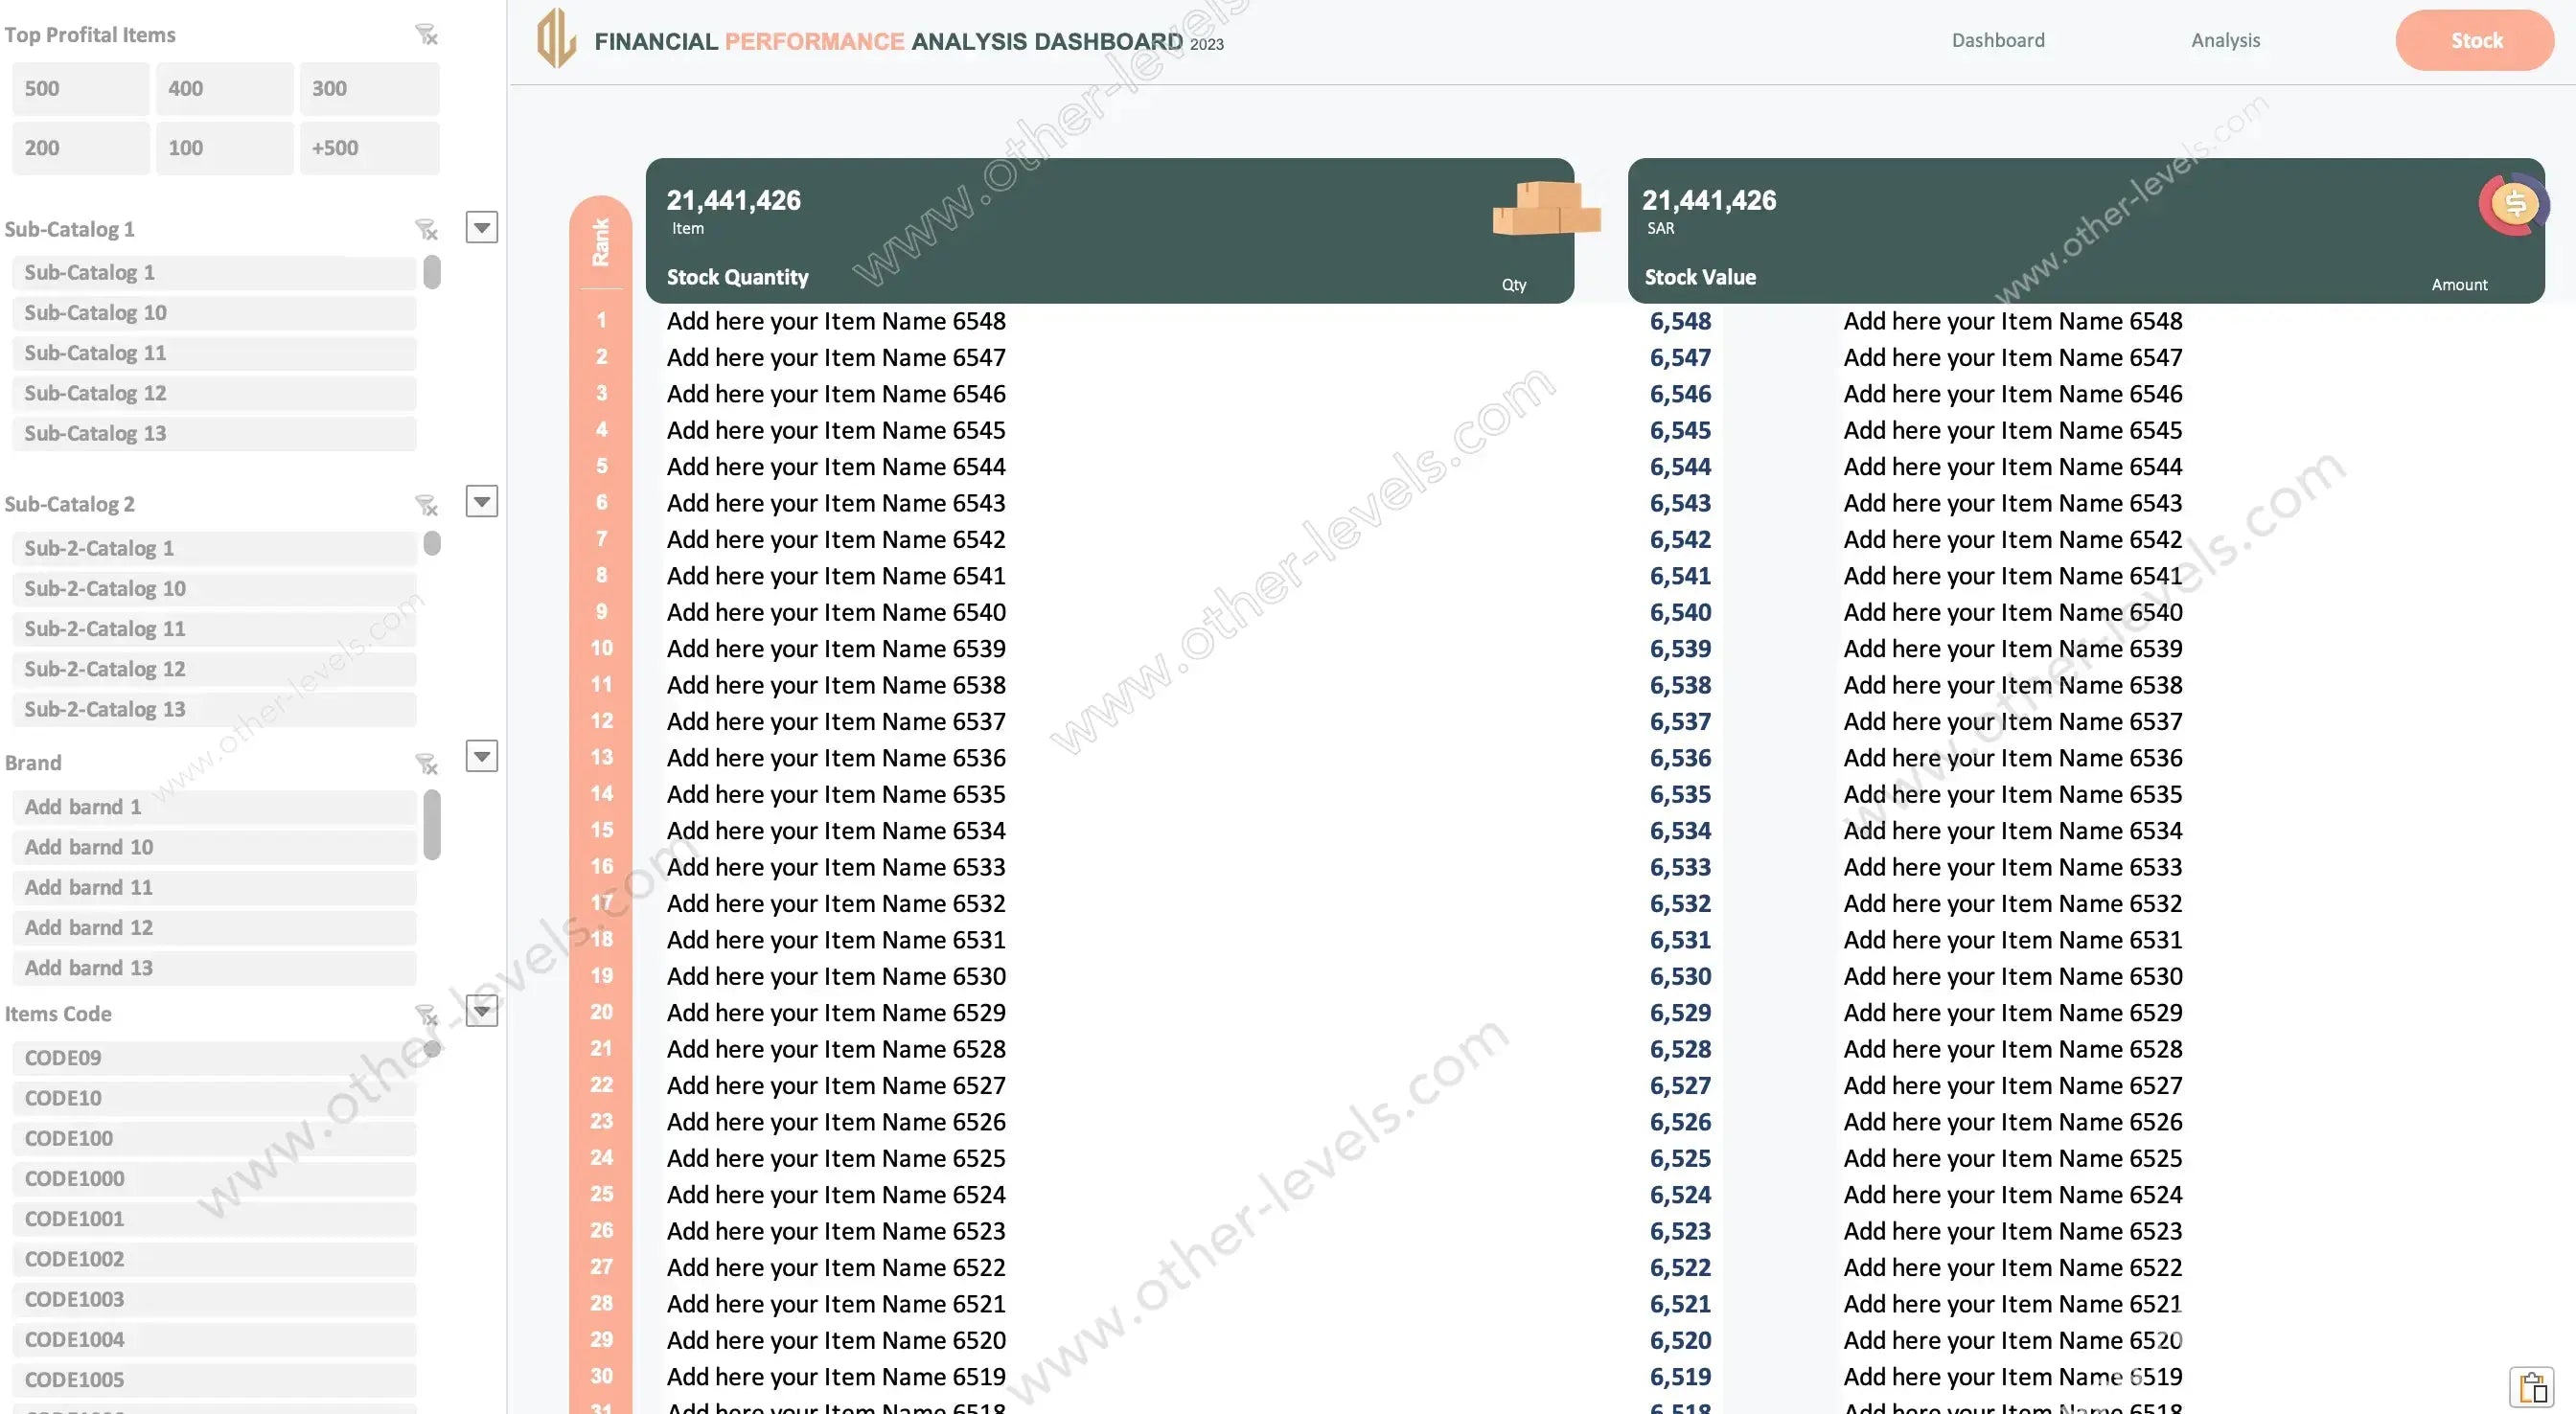
Deeper analysis & stock exposure
- Profitable ranked table (retail, margin %, quantity)
- Valuable ranked table (cost exposure and quantity)
- Stock Quantity & Stock Value rankings for fast outlier spotting
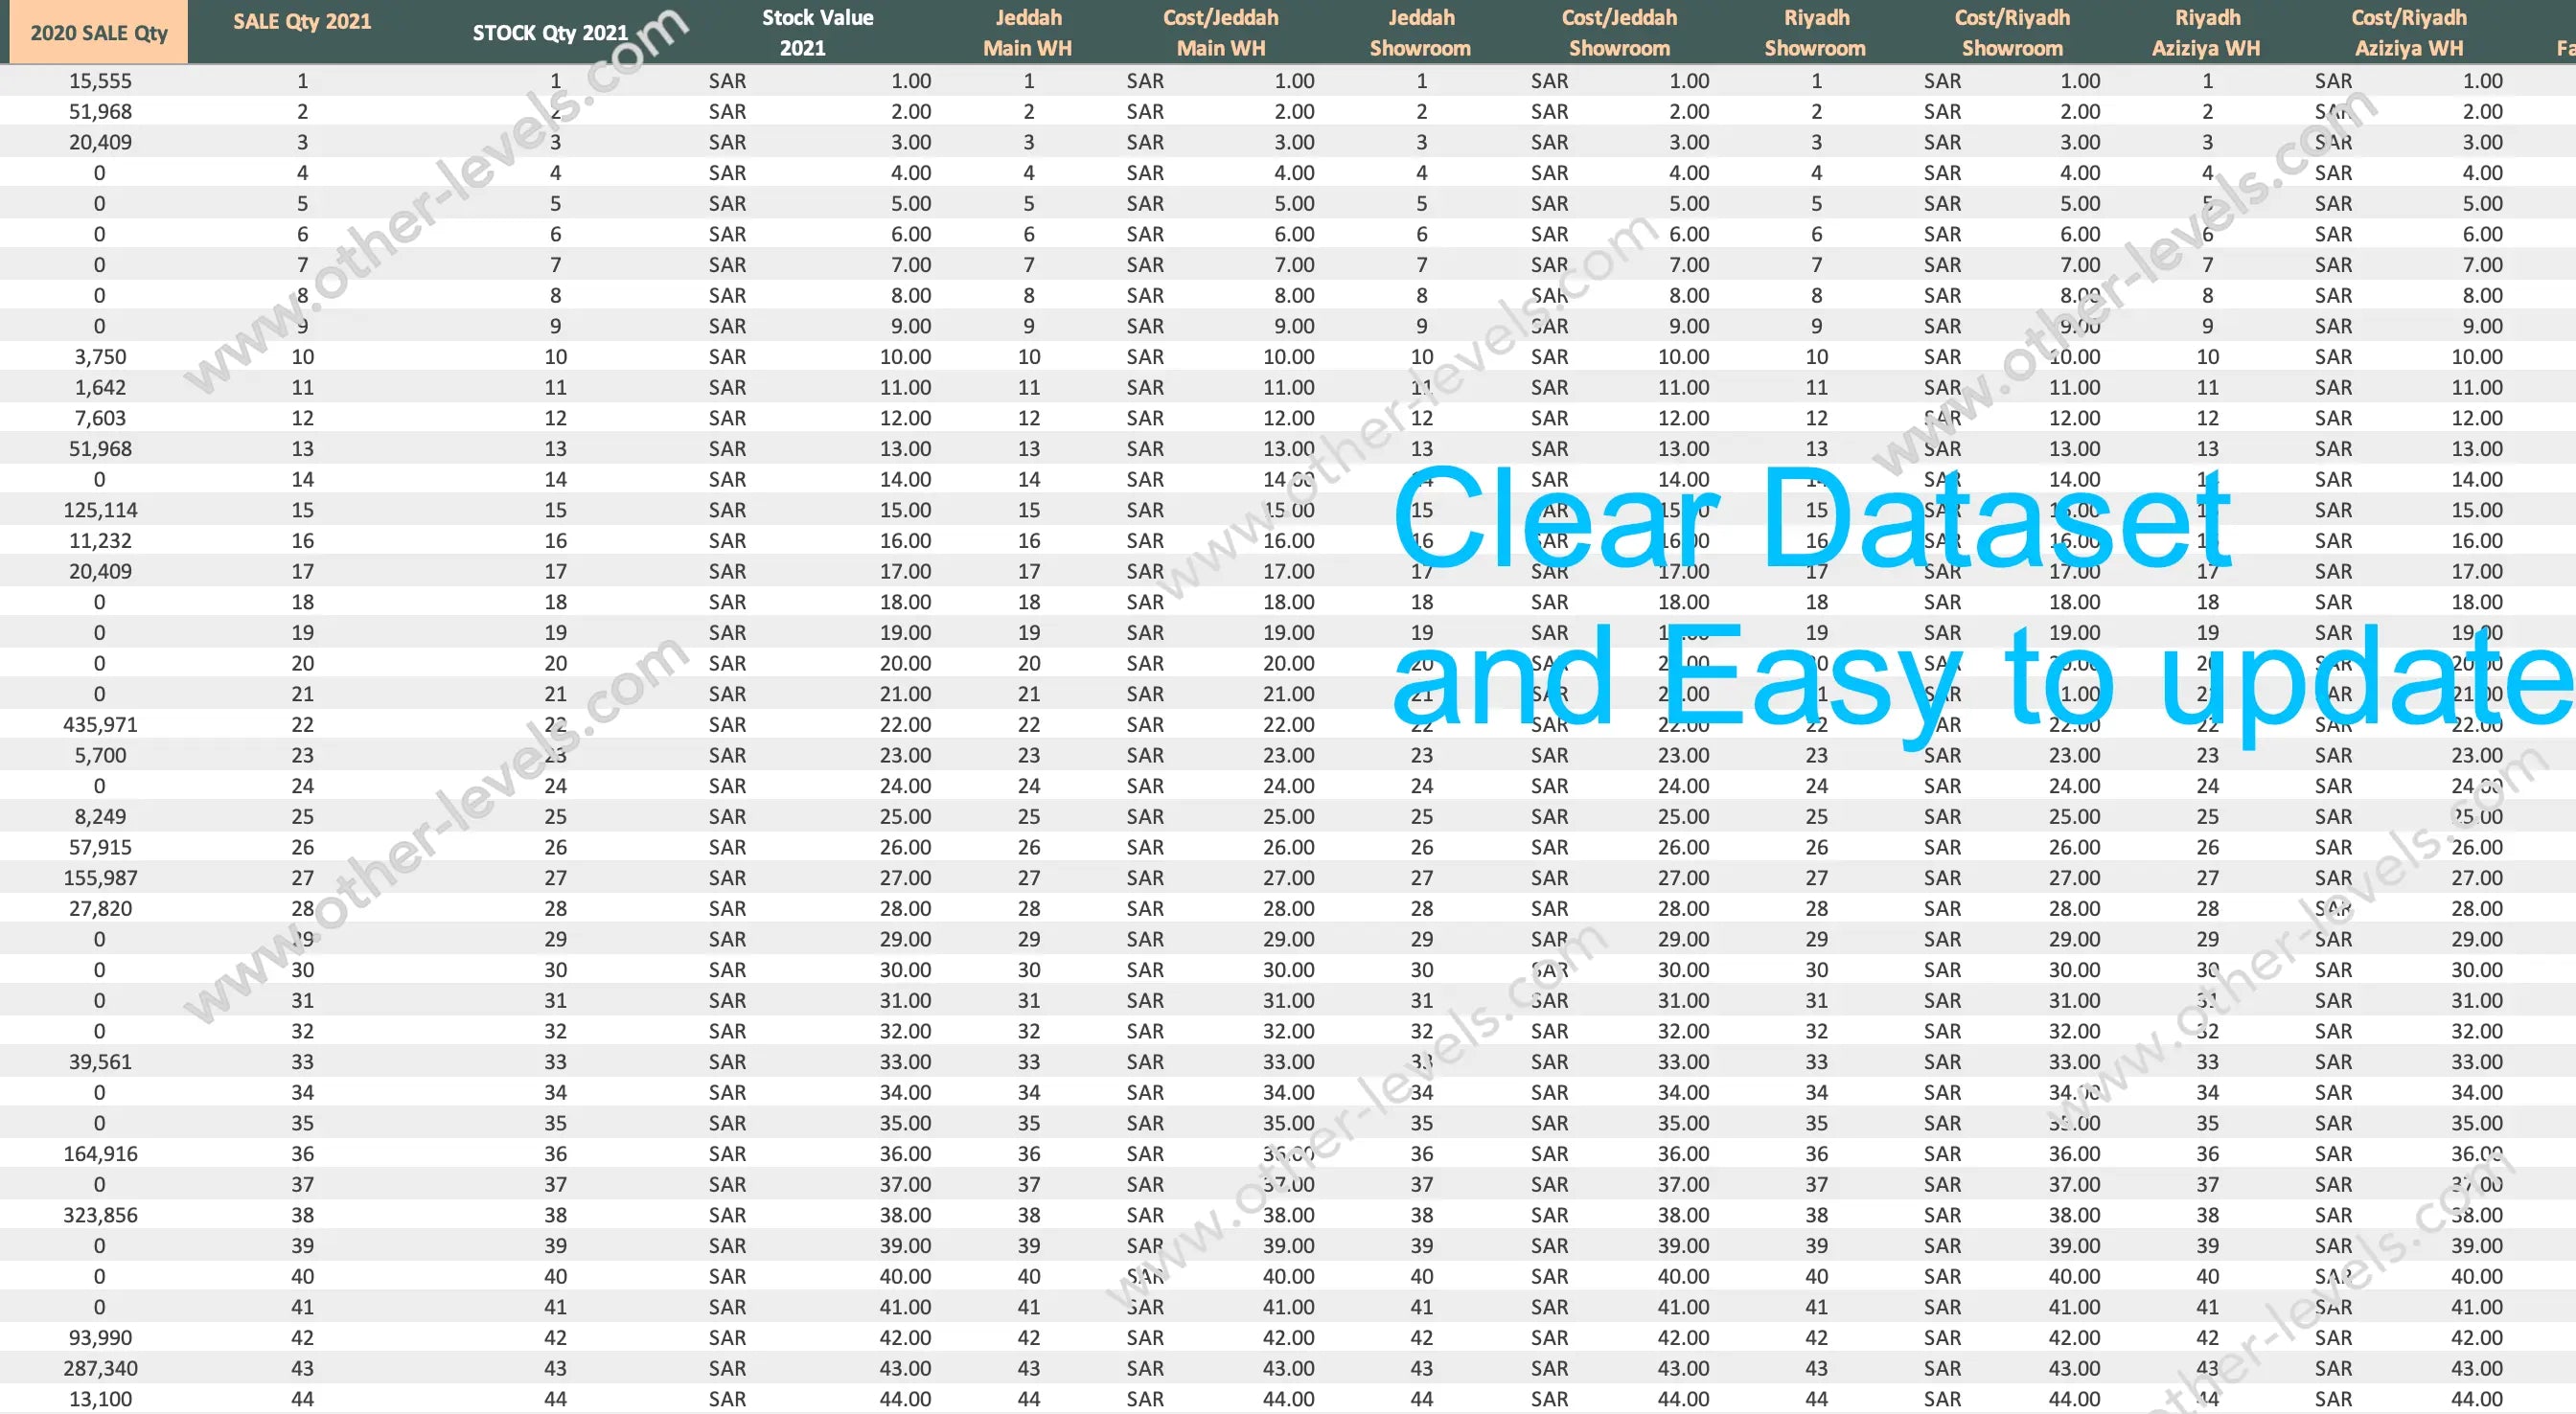
Data model & workflow
- Core fields: SKU, item name, brand, sub-catalogs, dates, region
- Pricing: cost, wholesale, retail; movements and values for purchases/sales
- Derived metrics for trend, rank, margin—ready for data warehouse analytics feeds
- No macros; standard Excel. Paste data or connect and refresh. Supports “performance warehouse” reviews and modern warehouse operations analytics.
Related templates
- PowerPoint Sales Performance Dashboard – animated report using Morph
- Comprehensive Sales, Customer & Product Metrics Excel Dashboard
Video tutorial
Watch the full tutorial on our Other Levels YouTube Channel
Specifications
Get all essential details in one place. From features and package contents to software compatibility and skill level required, this section gives you a clear overview so you know exactly what to expect before download.
Template Features
Package Details
Software Compatibility
Skill Level Required
Beginner
FAQs
Please read our FAQs page to find out more.
Are the templates fully customizable?
Yes, all our templates are fully customizable. You can adjust the layout, data, and design elements to fit your specific needs. Our templates are designed to be flexible, allowing you to easily tailor them to your preferences.
Can I order a product in any language?
Yes, we provide products in any language. Simply select the "Dashboard language change" Service and once your order is placed, you will receive it within 48 hours.
What happens if I choose the wrong monitor screen size for my dashboard?
If you choose the wrong screen size, the dashboard may not display correctly on your monitor. Elements could appear too large, too small, or misaligned, affecting the readability and usability of the dashboard. We recommend selecting the appropriate screen size to ensure optimal viewing and performance.
Do I need specific skills to use the advanced Excel dashboard templates?
Our advanced Excel dashboards are easy to use, the only thing you need to know is how to work with PivotTables. With basic knowledge of PivotTables, you'll be able to customize and fully utilize these templates effortlessly. "Please check the skill level required"
All dashboards are 100% editable Excel files. Learn how to use them through our video tutorials, included datasets, and lifetime access program.