

Sales and Marketing Dashboard | Ecommerce Order Management
Pairs well with
Sales and Marketing Dashboard | Ecommerce Order Management
Here’s the thing: this is a downloadable excel marketing dashboard template that runs as a clean Excel Dashboard on a simple Spreadsheet. It keeps everyone aligned on sales and marketing, traffic, and orders. You’ll notice it supports exports in excel format for expense reports, so finance can review financial performance without extra steps. In practice, you get a focused marketing dashboard and marketing analytics dashboard built for quick decisions in real-world ecommerce order management.
Executive Summary — Marketing, Traffic, and Profit
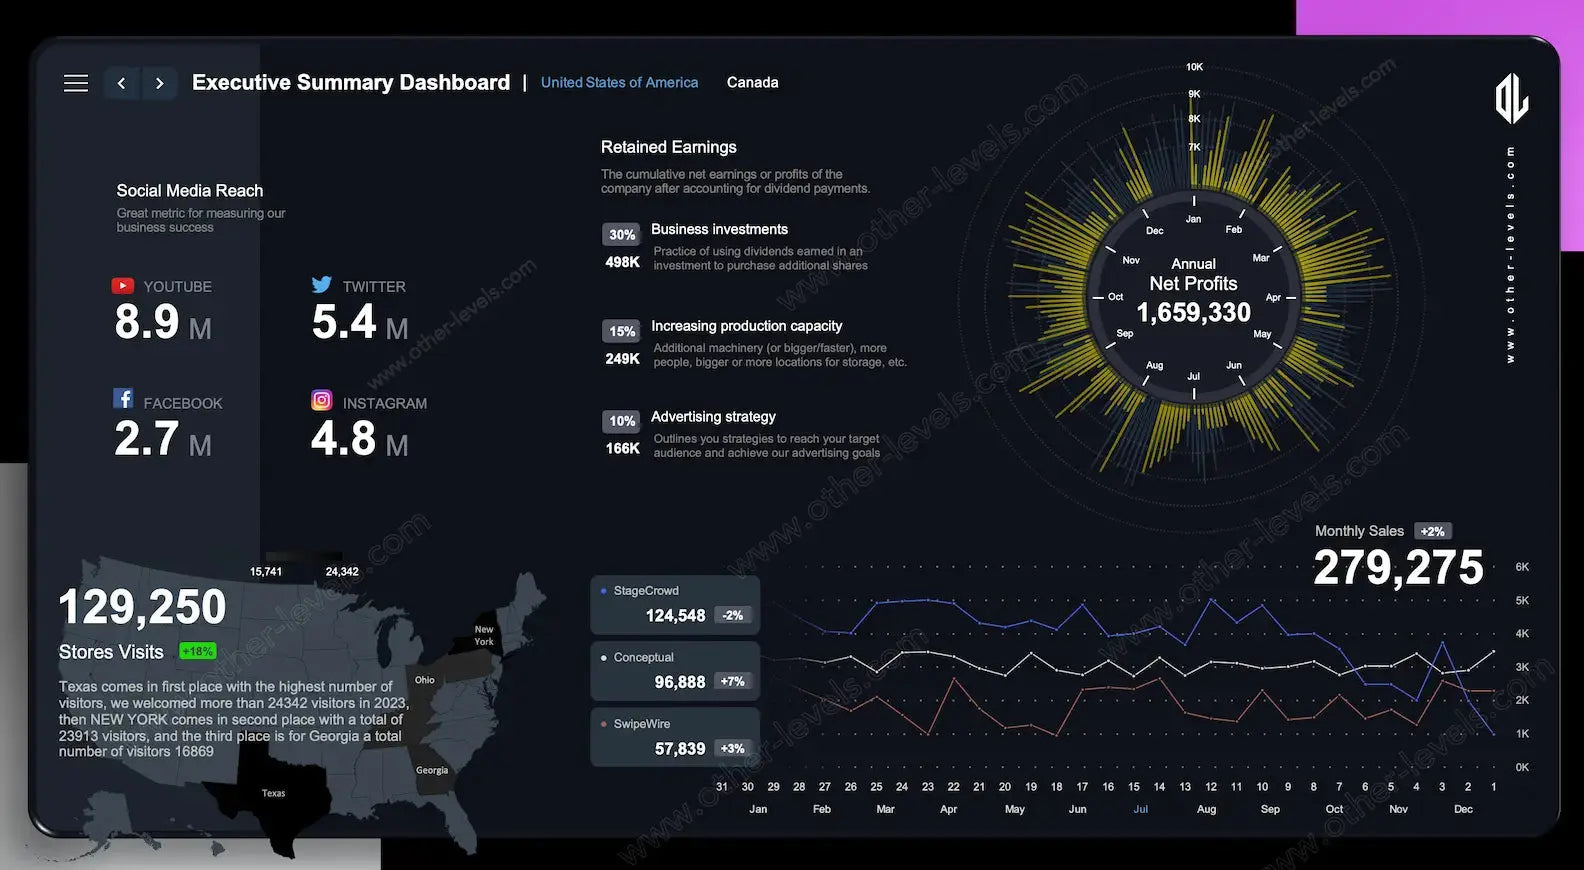
Social Media Reach — KPI Tiles
Fast channel cards act like a compact social media analytics dashboard and feed a tidy social media analytics report in seconds.
Store Visit Map — Choropleth Map
See where demand is coming from. The choropleth map highlights each region’s store visit volume for geo-targeted actions.
Retained Earnings — Retained Earnings Statement
Simple allocation cards mirror a concise retained earnings statement so strategy talks stay grounded.
Annual Profit Pattern — Radial View
Seasonality at a glance with context for your net profit ratio.
Monthly Sales by Brand — Line Chart
Clear line chart charts compare brand trends month by month for quick wins and early warnings.
Orders, Products, and Campaigns
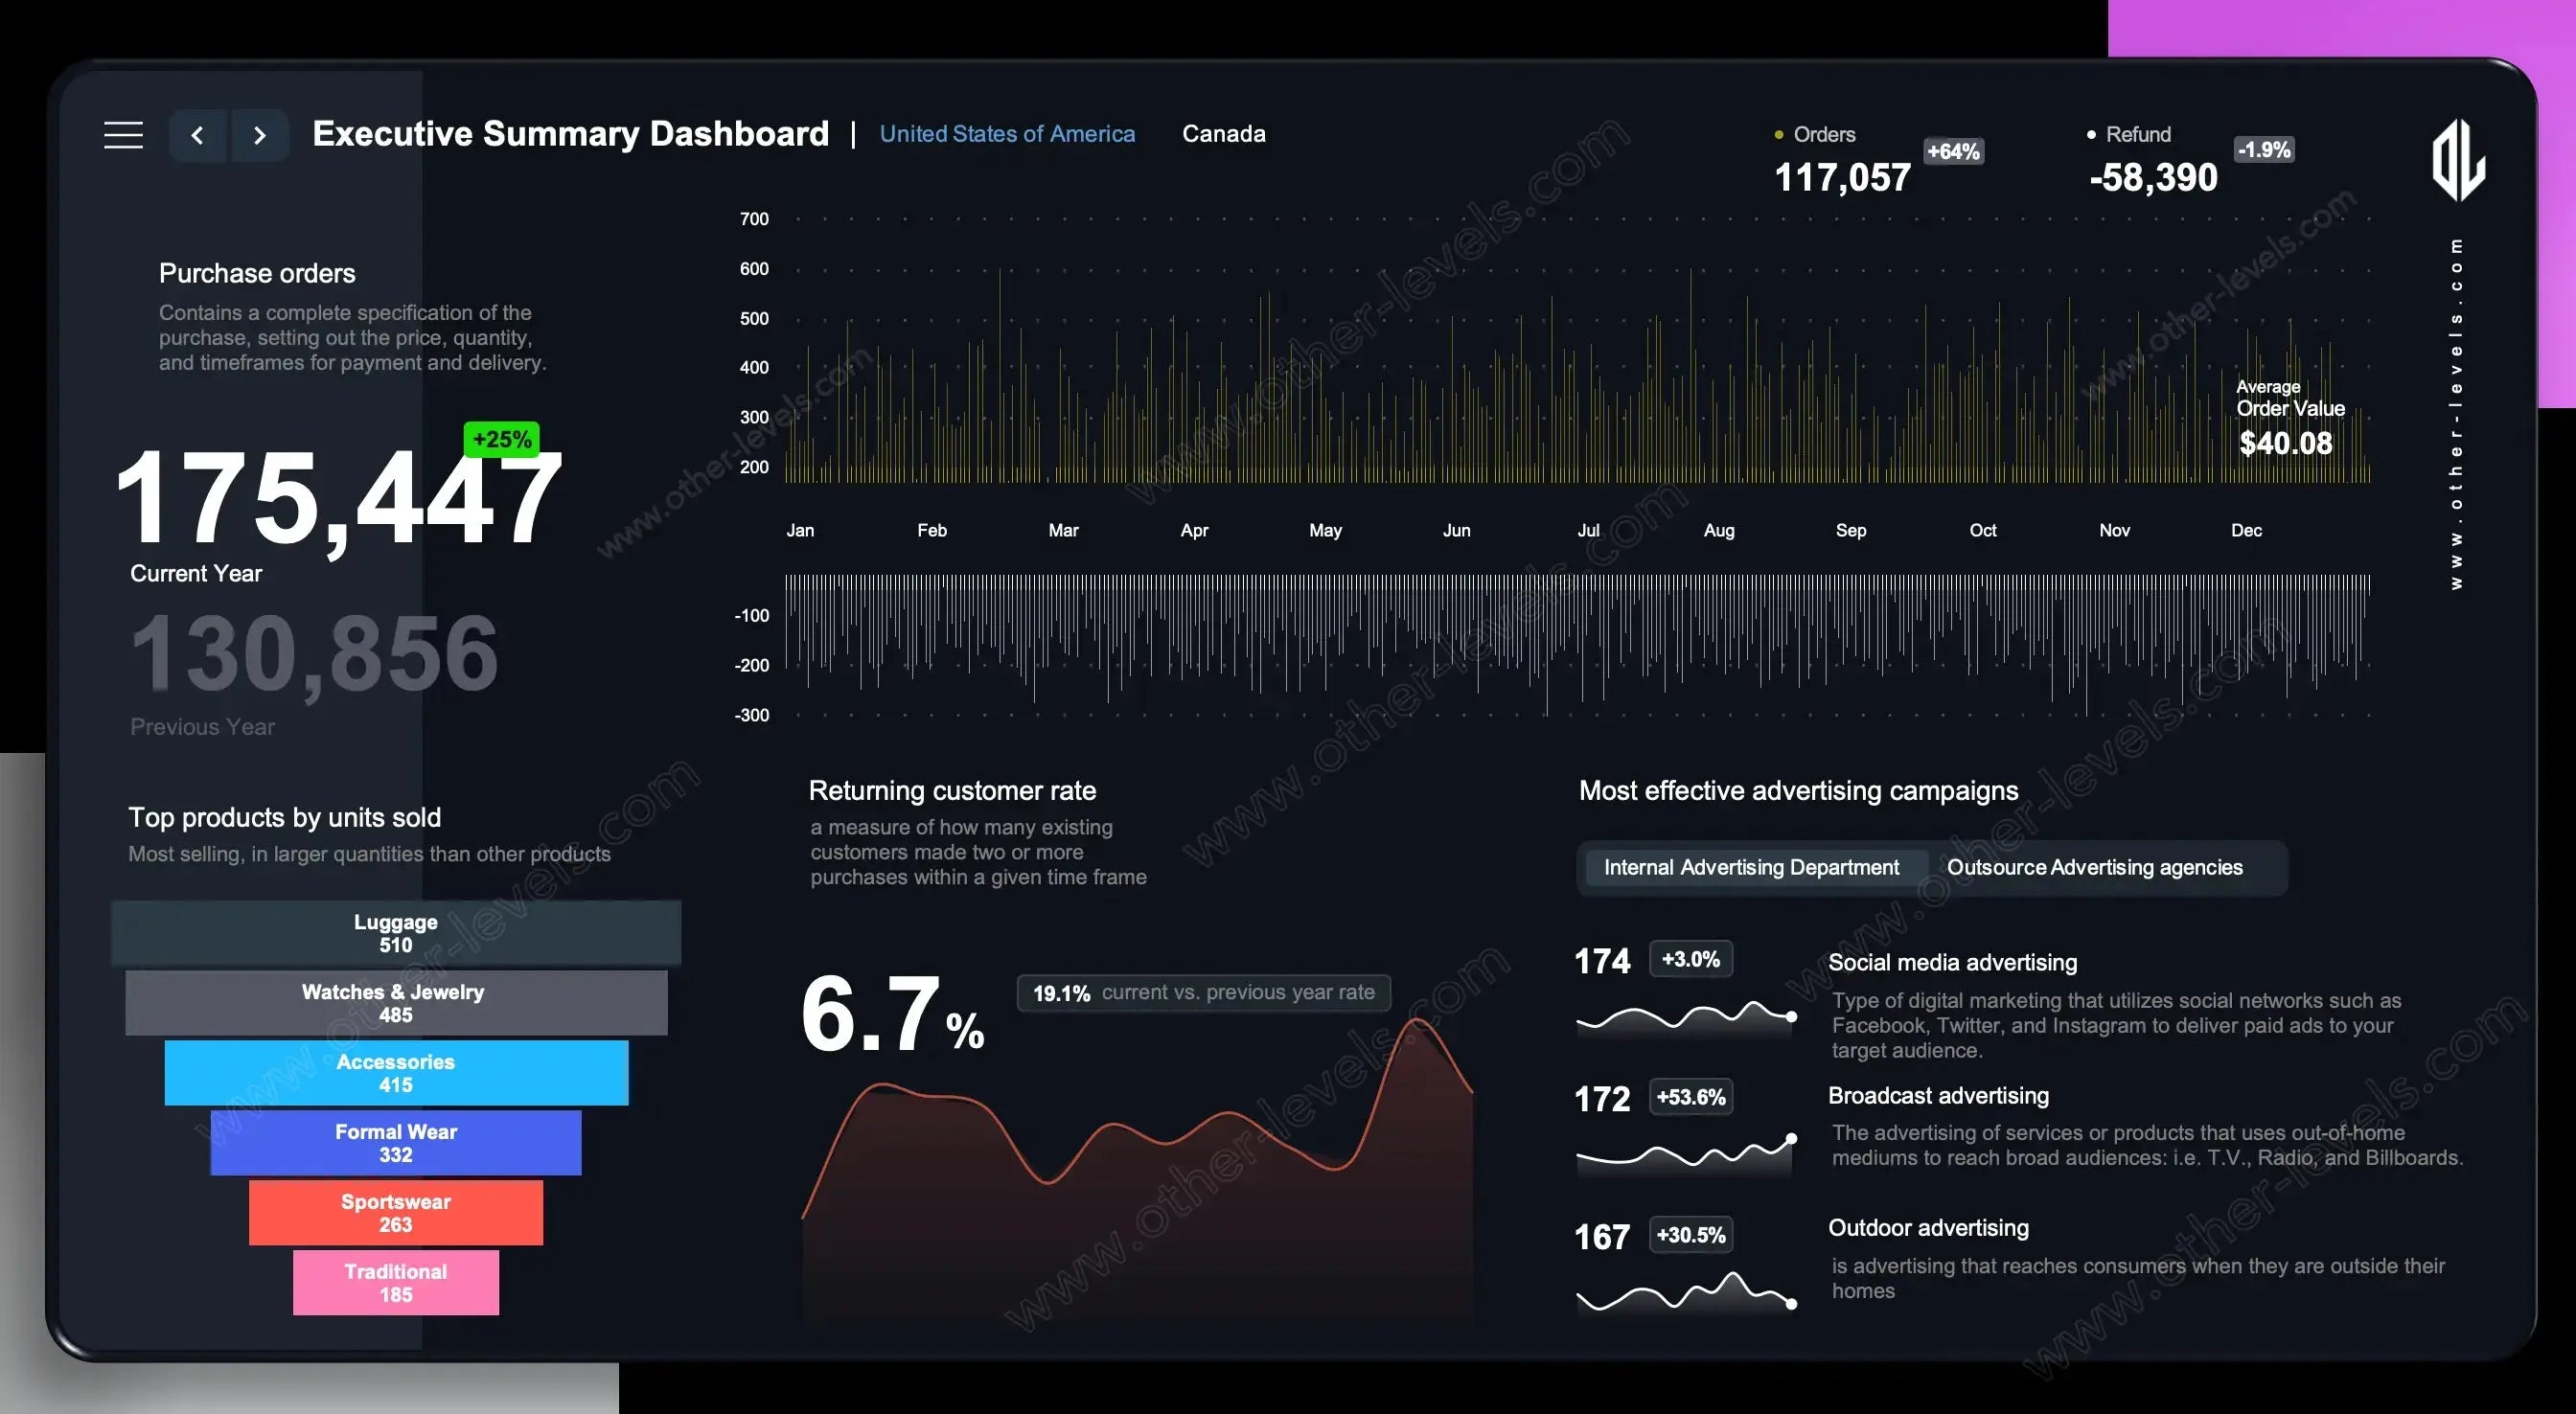
Purchase Orders — KPI (This Year vs Last)
A headline view your team checks first thing.
Daily Orders & Refunds — Clustered Column Chart
Two synchronized timelines in a clustered column chart make spikes and anomalies obvious.
Average Order Value — KPI
Basket size health for pricing and bundle tests inside ecommerce order management flows.
Top Products — Ranked Bars
Category leaders at a glance for fast merchandising moves.
Returning Customer Rate — Area Trend
Retention direction, front and center, for lifecycle planning.
Most Effective Campaigns — Tabbed Sparklines
Flip between internal and outsourced efforts to see which channels are heating up.
Controls & Data
- Country switch filters everything, globally.
- Monthly slicer narrows the window without leaving the page.
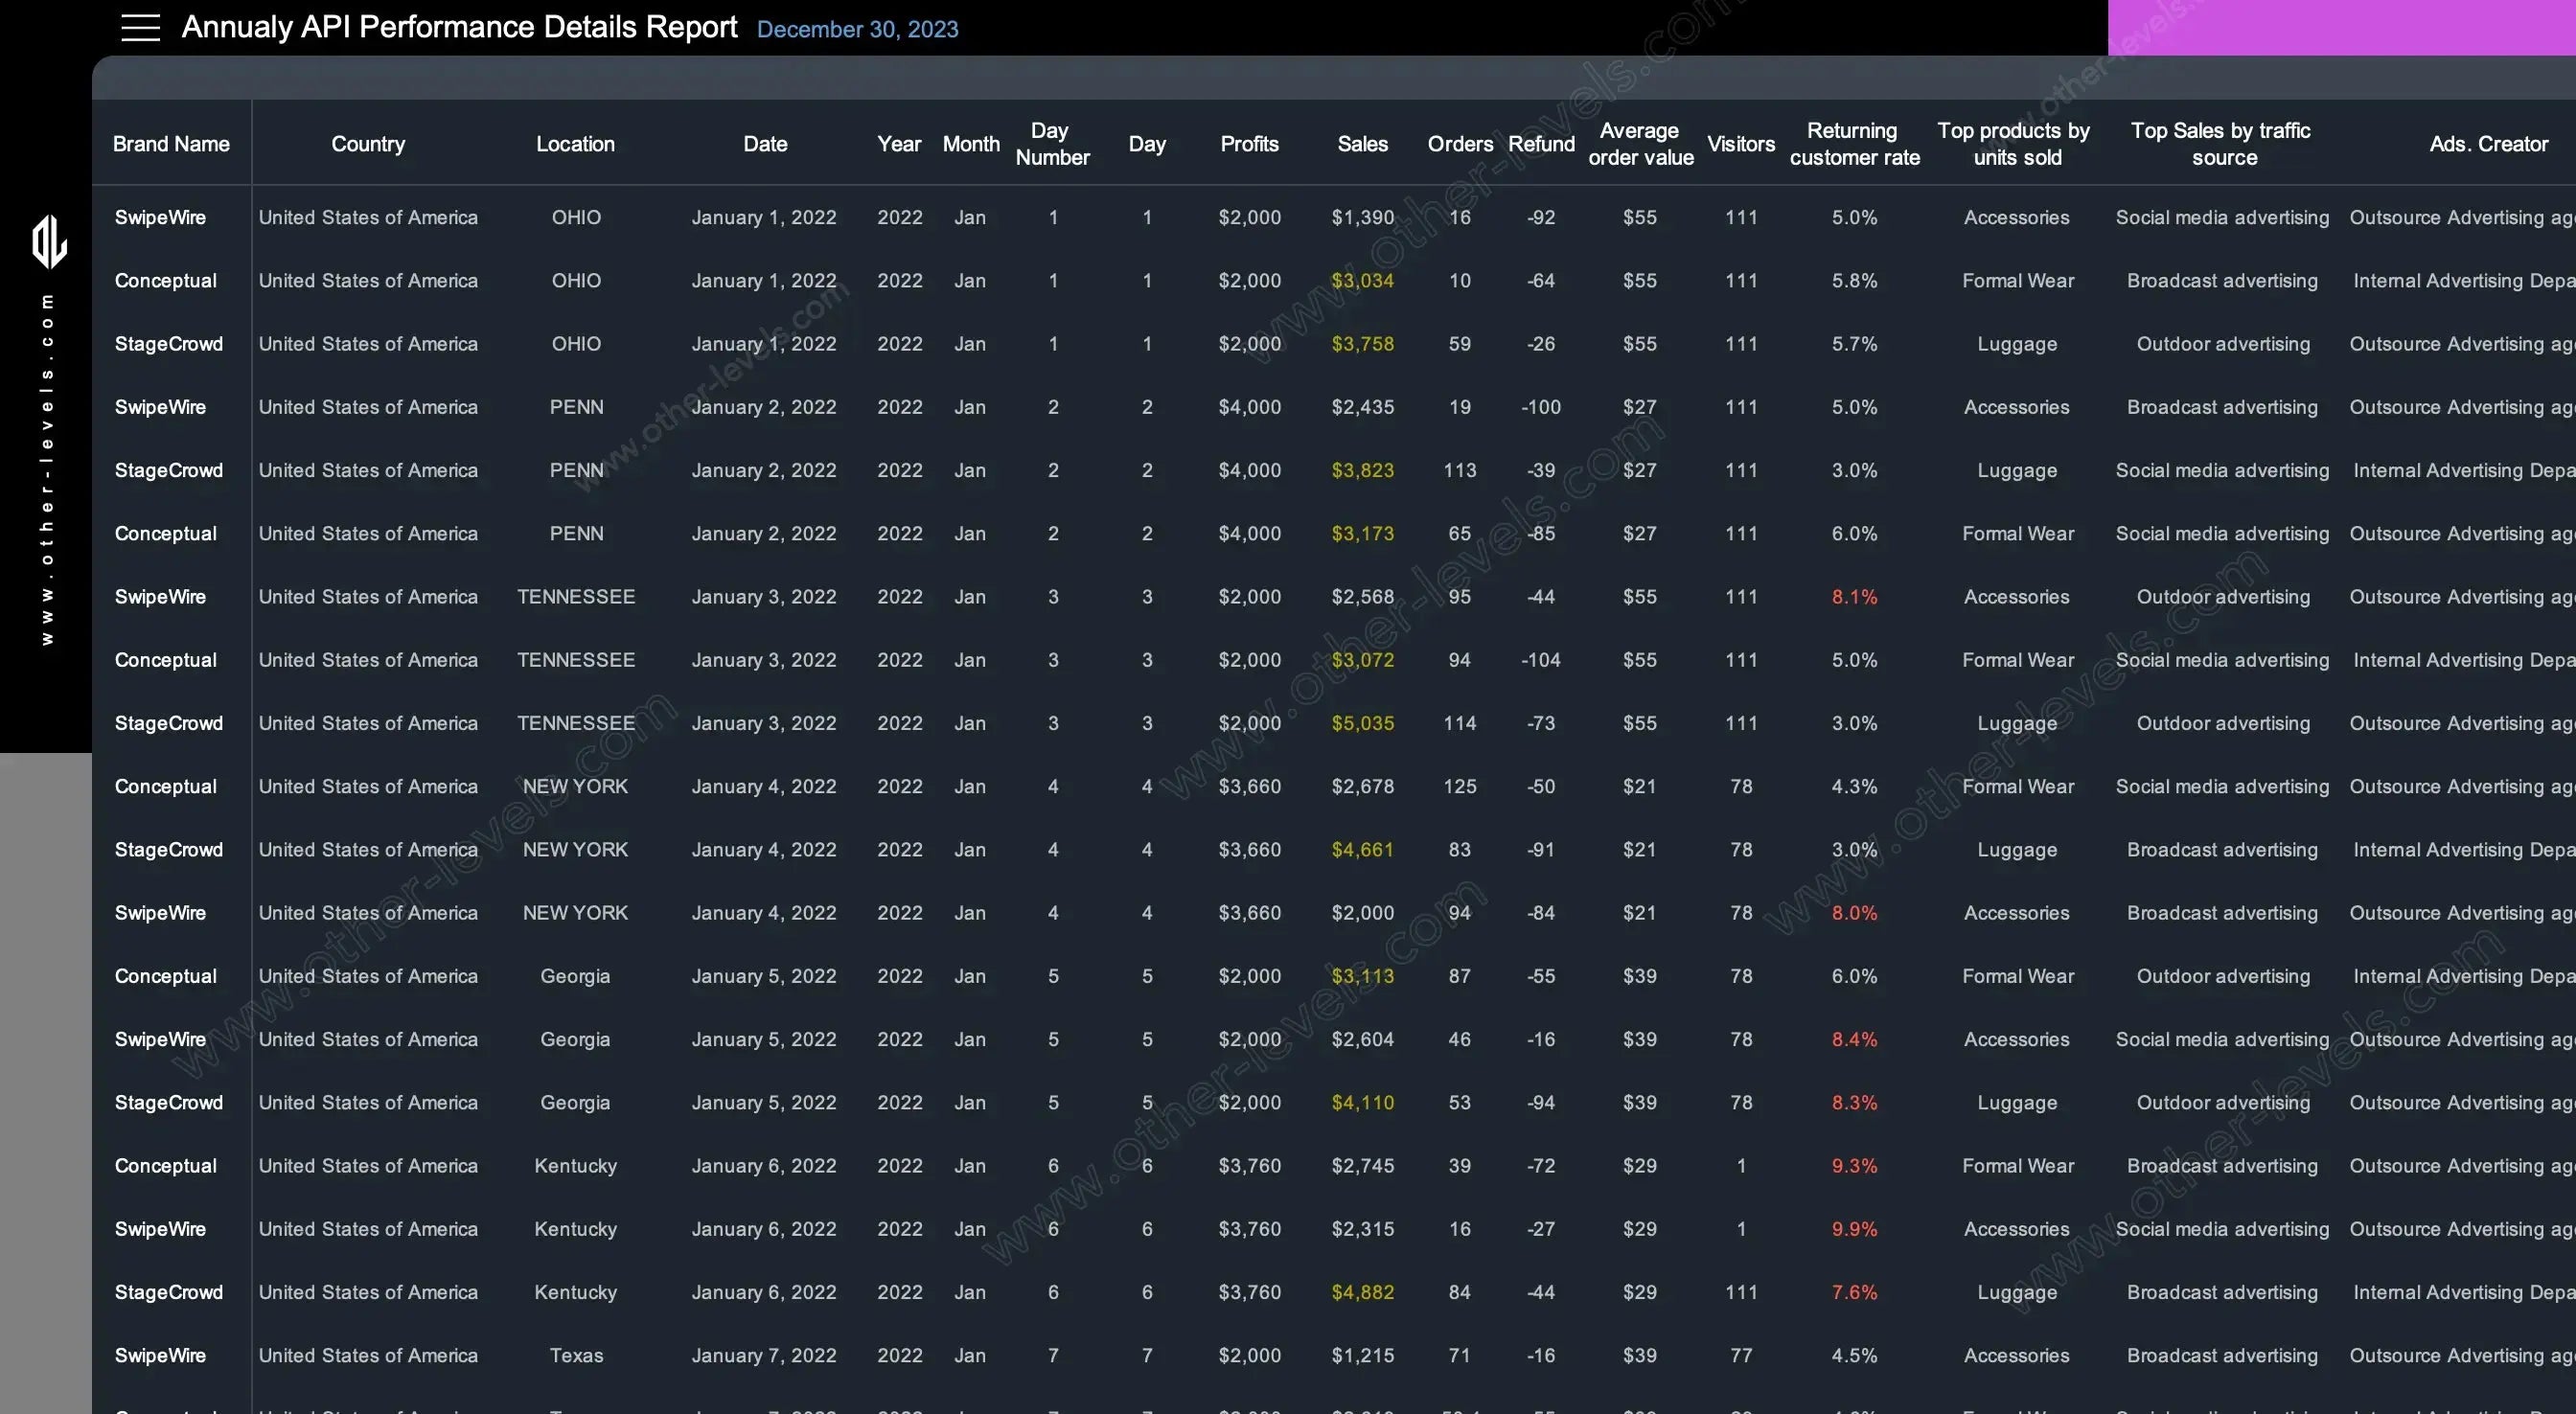
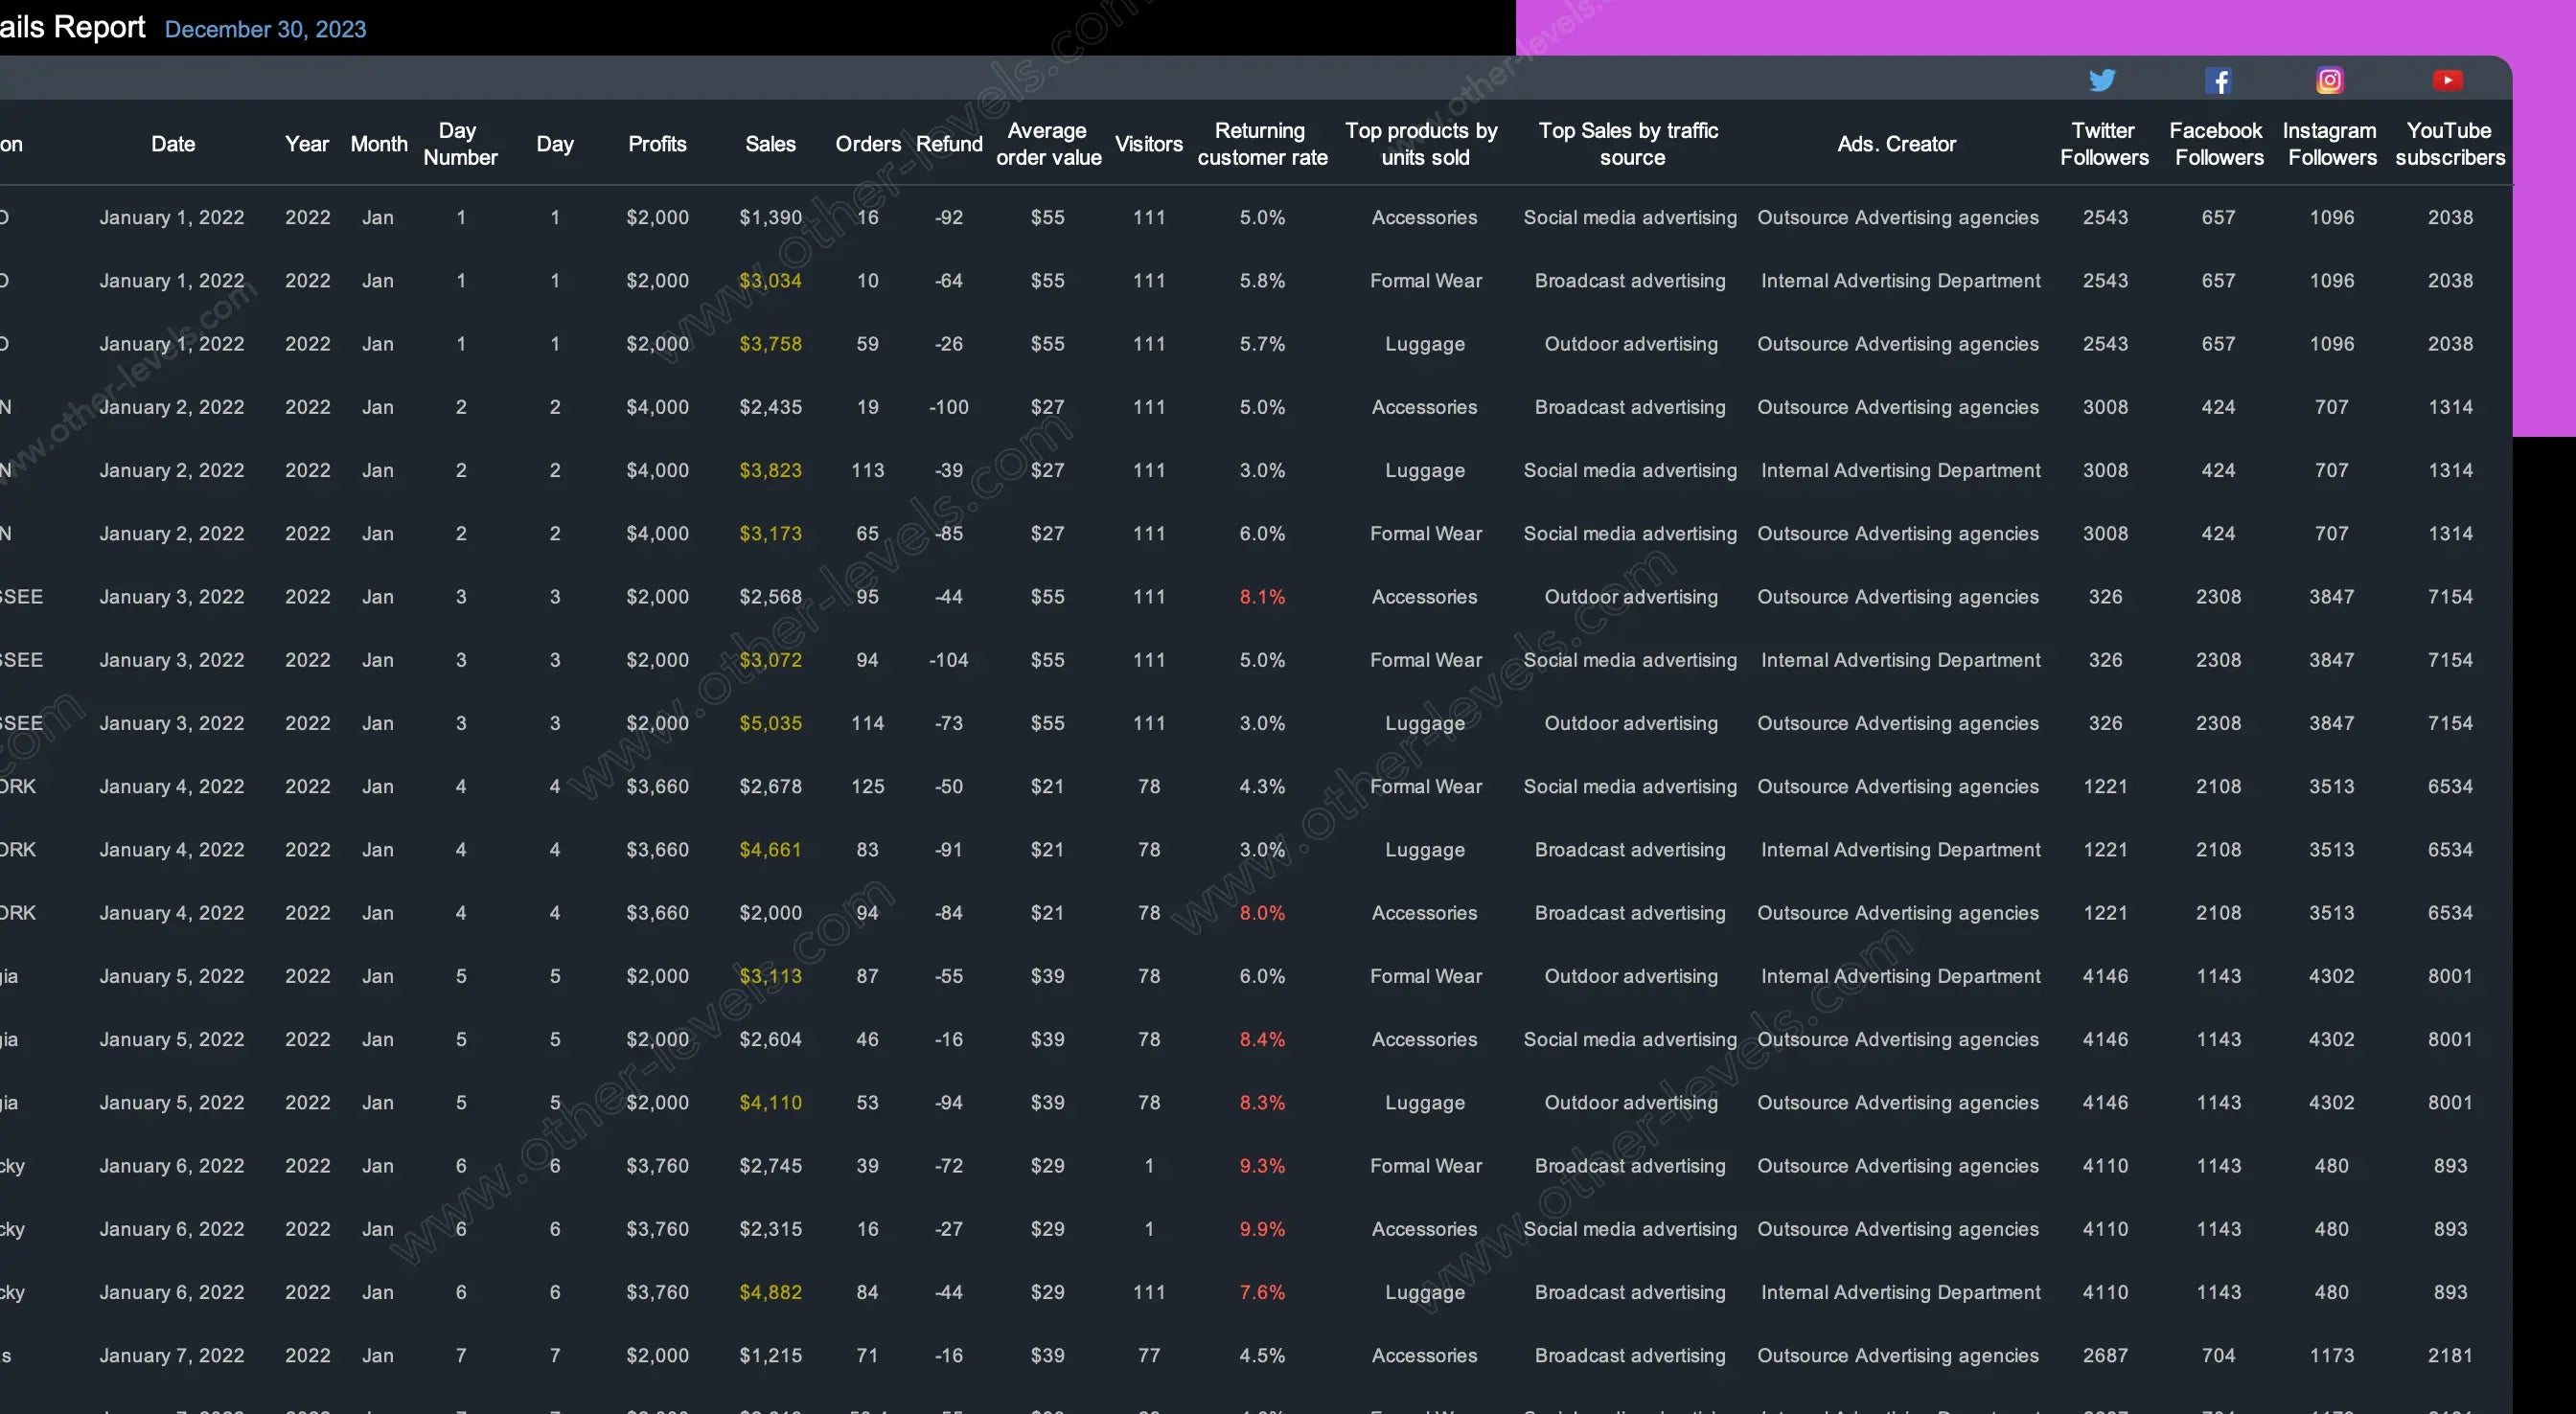
- Database jump opens the source Spreadsheet for quick audits.
Related Excel Dashboard Templates
- Farm Performance Management Dashboard - Advanced Excel Analytics Tool
- Financial Statistics Dashboards System - Dynamic Excel Dashboard
Video Tutorial — Executive Summary Excel Dashboard
Watch the full tutorial on our Other Levels YouTube Channel — a step-by-step Engagement & Sales Performance Dashboard in Excel tutorial covering setup, filters, and reading every visual.
Specifications
Get all essential details in one place. From features and package contents to software compatibility and skill level required, this section gives you a clear overview so you know exactly what to expect before download.
Template Features
Package Details
Software Compatibility
Skill Level Required
Advanced
FAQs
Please read our FAQs page to find out more.
Are the templates fully customizable?
Yes, all our templates are fully customizable. You can adjust the layout, data, and design elements to fit your specific needs. Our templates are designed to be flexible, allowing you to easily tailor them to your preferences.
Can I order a product in any language?
Yes, we provide products in any language. Simply select the "Dashboard language change" Service and once your order is placed, you will receive it within 48 hours.
What happens if I choose the wrong monitor screen size for my dashboard?
If you choose the wrong screen size, the dashboard may not display correctly on your monitor. Elements could appear too large, too small, or misaligned, affecting the readability and usability of the dashboard. We recommend selecting the appropriate screen size to ensure optimal viewing and performance.
Do I need specific skills to use the advanced Excel dashboard templates?
Our advanced Excel dashboards are easy to use, the only thing you need to know is how to work with PivotTables. With basic knowledge of PivotTables, you'll be able to customize and fully utilize these templates effortlessly. "Please check the skill level required"
All dashboards are 100% editable Excel files. Learn how to use them through our video tutorials, included datasets, and lifetime access program.

