
✅ Instant Digital Delivery | 🔒 Secure Checkout | ⭐ Trusted by 1,000+ Professionals | 💬 24hr Support
Business Performance, Cost & Profitability Report
Pairs well with
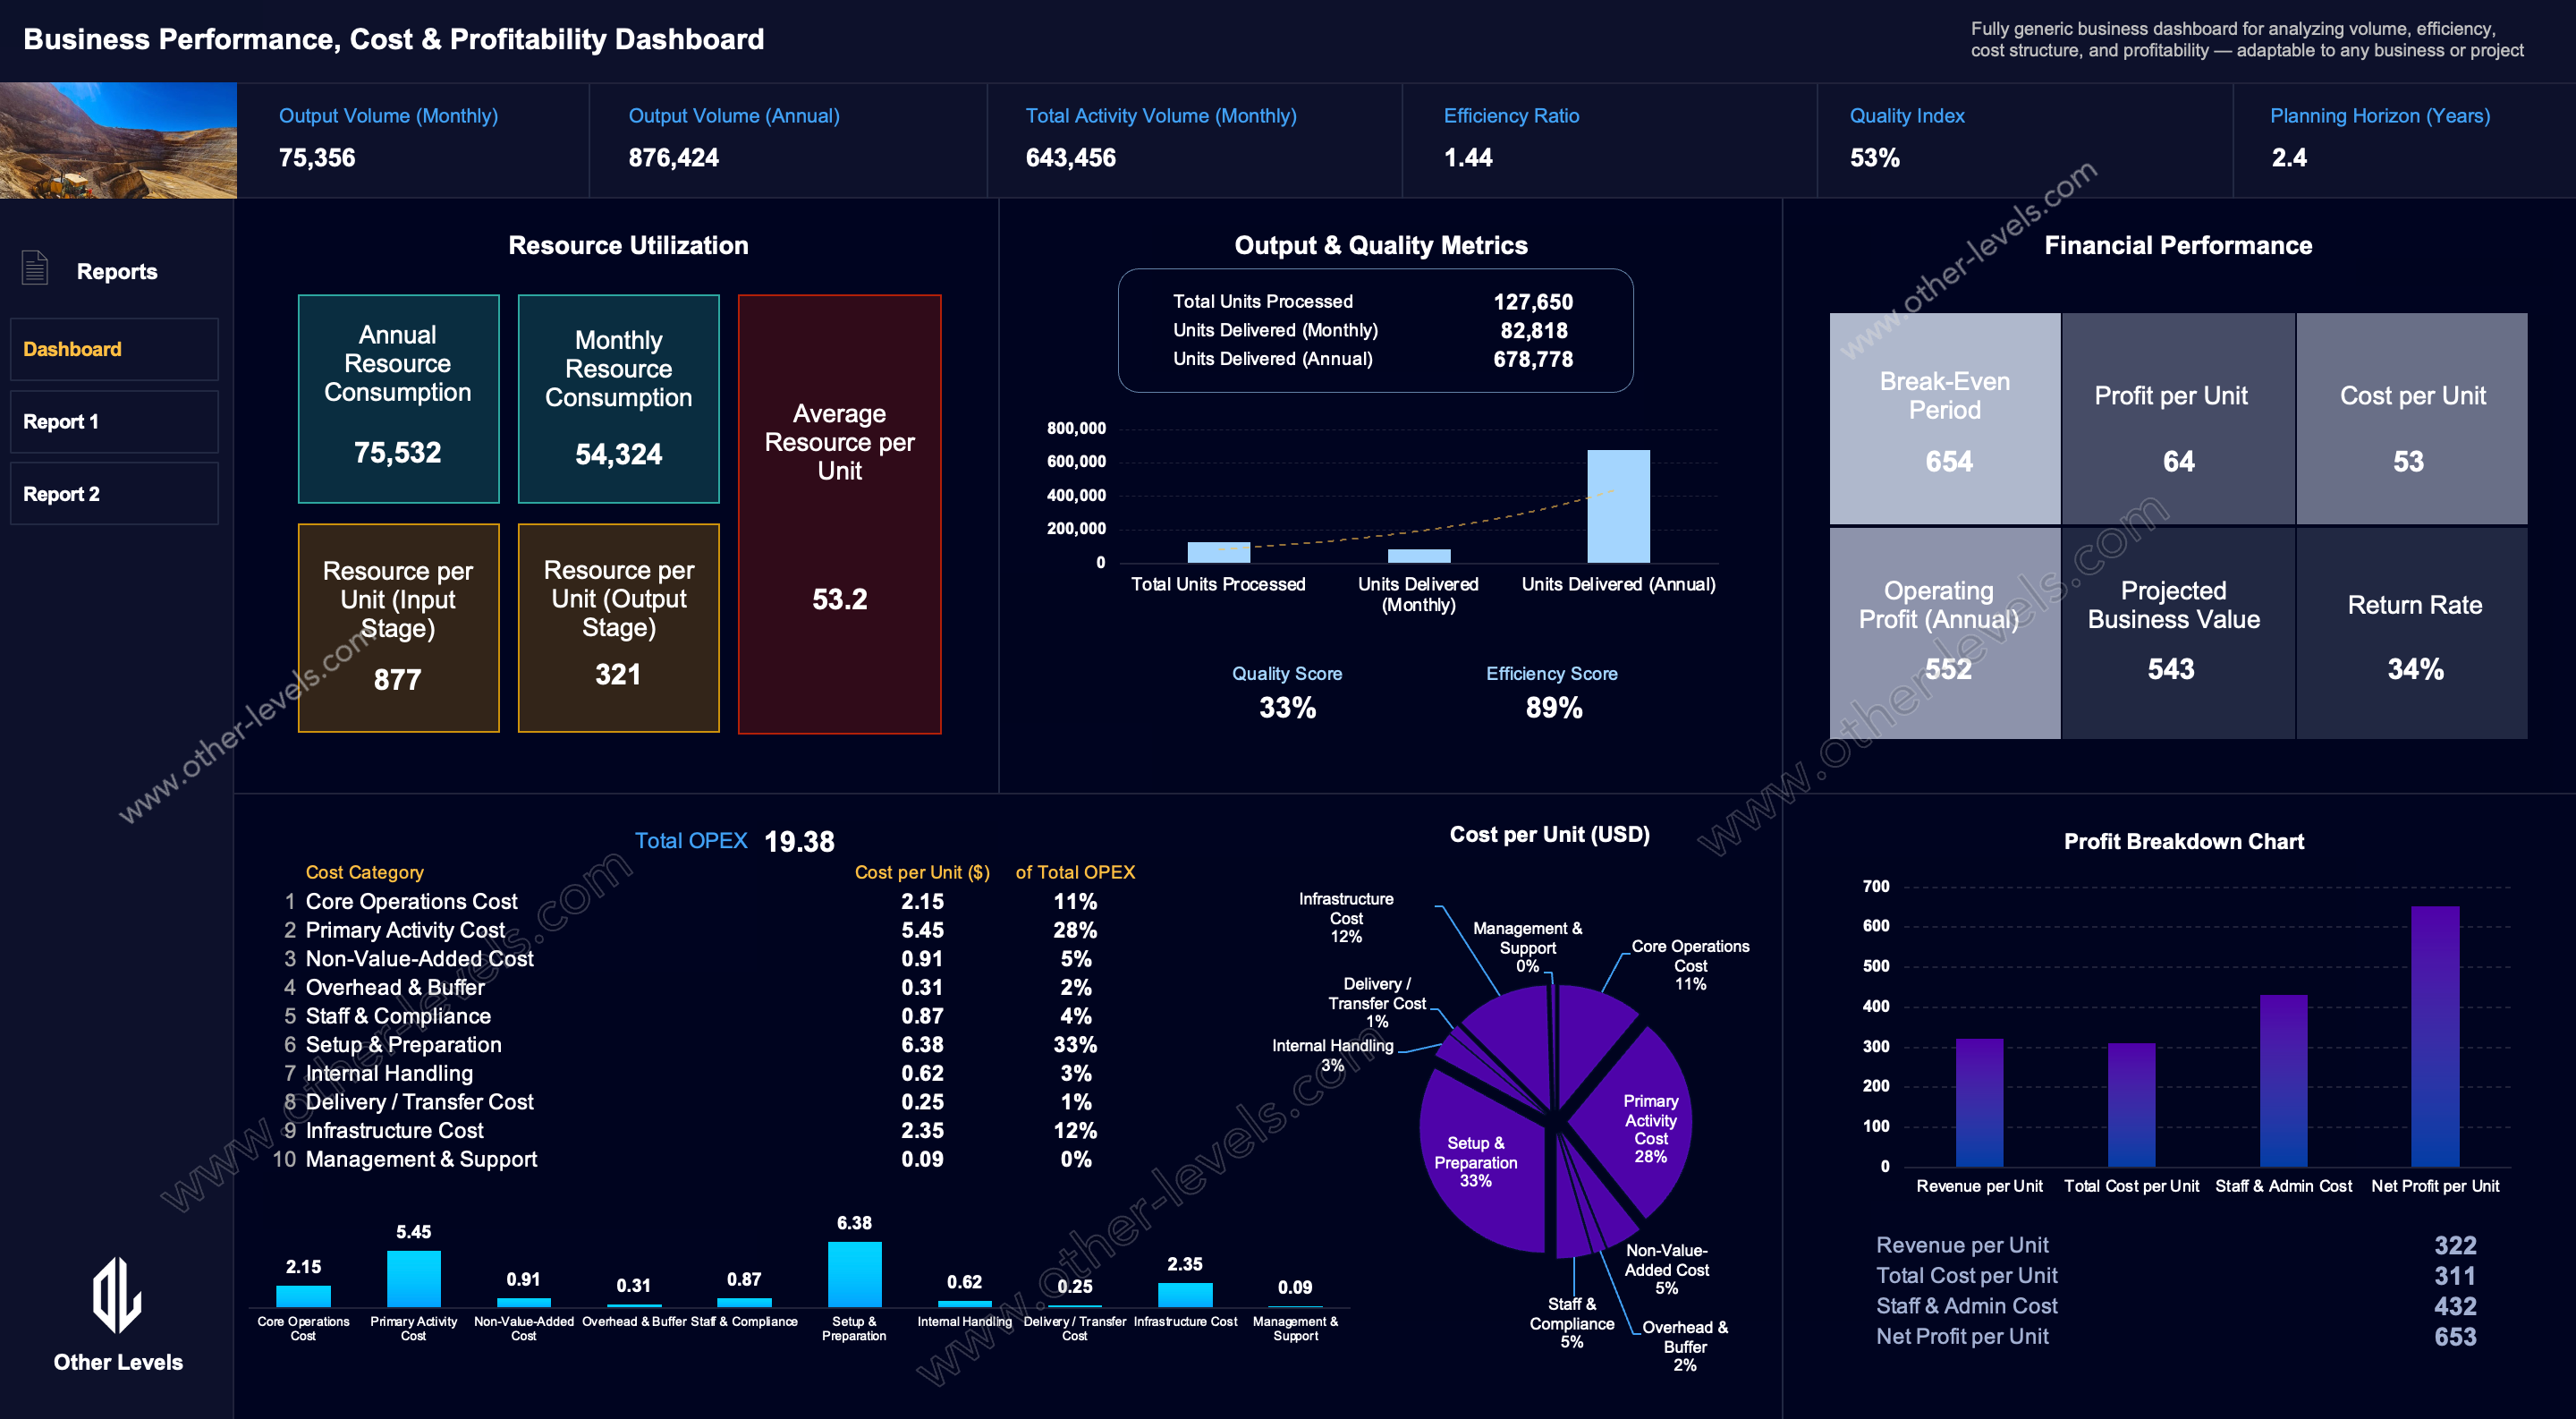
Business Performance, Cost & Profitability Report
This Business Performance, Cost & Profitability Report is a clean, executive-style Excel reporting template built to present a clear snapshot of volume, efficiency, cost structure, and profitability—without relying on datasets, PivotTables, or slicers.
The report is fully generic and industry-agnostic, making it suitable for any business, project, department, or organization. You can enter values manually or link them from external sources, allowing you to adapt the report quickly without rebuilding complex data models.
Who this report is for
- Executives & managers who need a decision-ready performance snapshot
- Consultants & analysts summarizing results for clients and stakeholders
- Business owners who want clarity without complexity
- Teams preparing board and leadership presentations
What you get
- Executive KPI header for volume, efficiency, quality, and planning horizon
- Resource utilization panel with per-unit indicators
- Output & quality metrics with clear visual summaries
- Financial performance view (break-even, cost per unit, profit per unit, return indicators)
- Cost structure table and visual breakdown (bar + pie)
- Profit breakdown chart to explain where profit is gained or lost
Important notes
- No dataset, PivotTables, or slicers included—this is a static executive report view.
- Best for monthly, quarterly, or annual reporting snapshots.
- Works across industries—simply replace labels and values to match your use case.
Download now and start presenting professional, executive-ready performance insights in minutes.
Who benefits
- Sales leaders aligning salesperson strategies with live KPIs.
- Analysts standardizing sales data analysis across teams.
- Operators monitoring fulfillment and customer experience in real time.
Related dashboards
- Sales Team Performance & Metrics Excel Dashboard — optimize team KPIs and streamline your sales tracking system.
- Warehouse & Product Sales Management Dashboard – Dynamic Excel Solution — connect inventory, product performance, and sales analysis in one view.
Specifications
Get all essential details in one place. From features and package contents to software compatibility and skill level required, this section gives you a clear overview so you know exactly what to expect before download.
Template Features
Package Details
Software Compatibility
Skill Level Required
Beginner
FAQs
Please read our FAQs page to find out more.
Are the templates fully customizable?
Yes, all our templates are fully customizable. You can adjust the layout, data, and design elements to fit your specific needs. Our templates are designed to be flexible, allowing you to easily tailor them to your preferences.
Can I order a product in any language?
Yes, we provide products in any language. Simply select the "Dashboard language change" Service and once your order is placed, you will receive it within 48 hours.
What happens if I choose the wrong monitor screen size for my dashboard?
If you choose the wrong screen size, the dashboard may not display correctly on your monitor. Elements could appear too large, too small, or misaligned, affecting the readability and usability of the dashboard. We recommend selecting the appropriate screen size to ensure optimal viewing and performance.
Do I need specific skills to use the advanced Excel dashboard templates?
Our advanced Excel dashboards are easy to use, the only thing you need to know is how to work with PivotTables. With basic knowledge of PivotTables, you'll be able to customize and fully utilize these templates effortlessly. "Please check the skill level required"
All dashboards are 100% editable Excel files. Learn how to use them through our video tutorials, included datasets, and lifetime access program.