Pickup currently unavailable
Dashboard Contents & Analysis
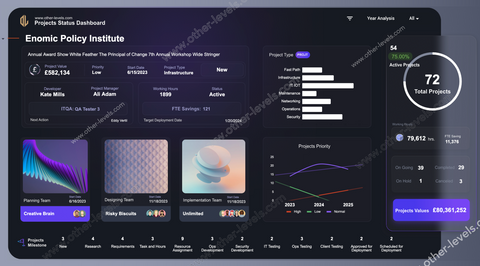
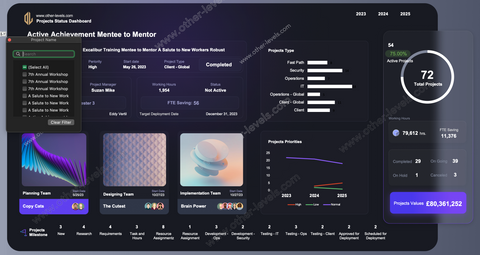
Overall Statistics
Total Projects
Completed projects
Ongoing projects
On Hold projects
Cancelled projects
Total Saving
Working Hours
Project Priorities
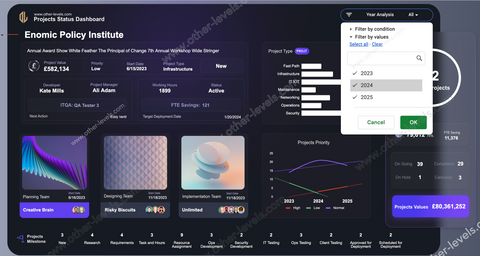
High, Normal, and Low by years
Bar Chart showing total projects by Project type
Doughnut chart showing projects status (Not Active and Active projects)
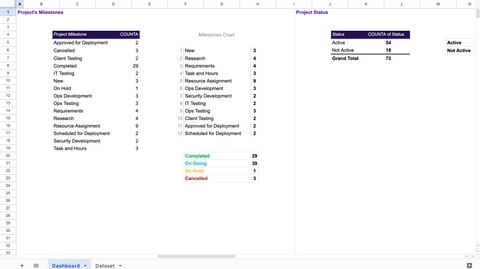
Total Projects on each Milestone stage
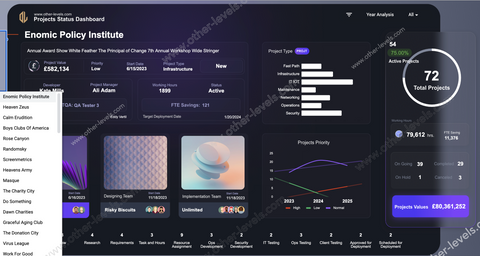
Projects Names filter connected to show all Projects Details:
Start date
Developer
Internal Testing Date
Project type
Target Client Testing Date
Project ID Number
Project Priority
Actual ACC Deployment Date
ITQA
Business Analyst
Next Action
Target Deployment Date
Project Description
Current Milestone
Unique Features
- Video tutorial (YouTube channel membership required)
- Analysis for +35 types of data
- Wide Screen – Full HD
- Preview images are included
- Free Font & Icons
- Easy Customize
- All objects and database are fully editable
Package Includes (Google sheets version)
- Google Sheets (20 MB)
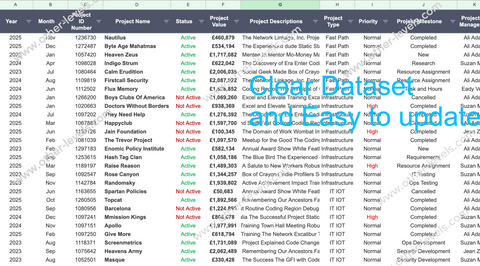
- Two sheet tabs (Datasets and Dashboard)
- Dark Theme
Package Includes (Excel Version)
- Google Sheets (4 MB)
- Three sheet tabs (Datasets, Pivot tables and Dashboard)
- Dark Theme
