✅ Instant Digital Delivery | 🔒 Secure Checkout | ⭐ Trusted by 1,000+ Professionals | 💬 24hr Support
Workforce Training Performance – Course Spreadsheet Template
Pairs well with
Overview of the Workforce Training Performance – Course Spreadsheet Template
This Spreadsheet helps HR and trainers monitor course performance, progress, and certification status across teams—built for clarity, speed, and decision-making.
What this dashboard shows and how it works
All metrics refresh from a single, clear dataset so leaders can track outcomes across multiple courses without manual work.
Top KPIs (auto-calculated)
- Trainings (Courses): distinct courses selected
- Hours: total planned training hours
- Scores – Avg: average assessment results
- Certificates – Issued: completions with certification
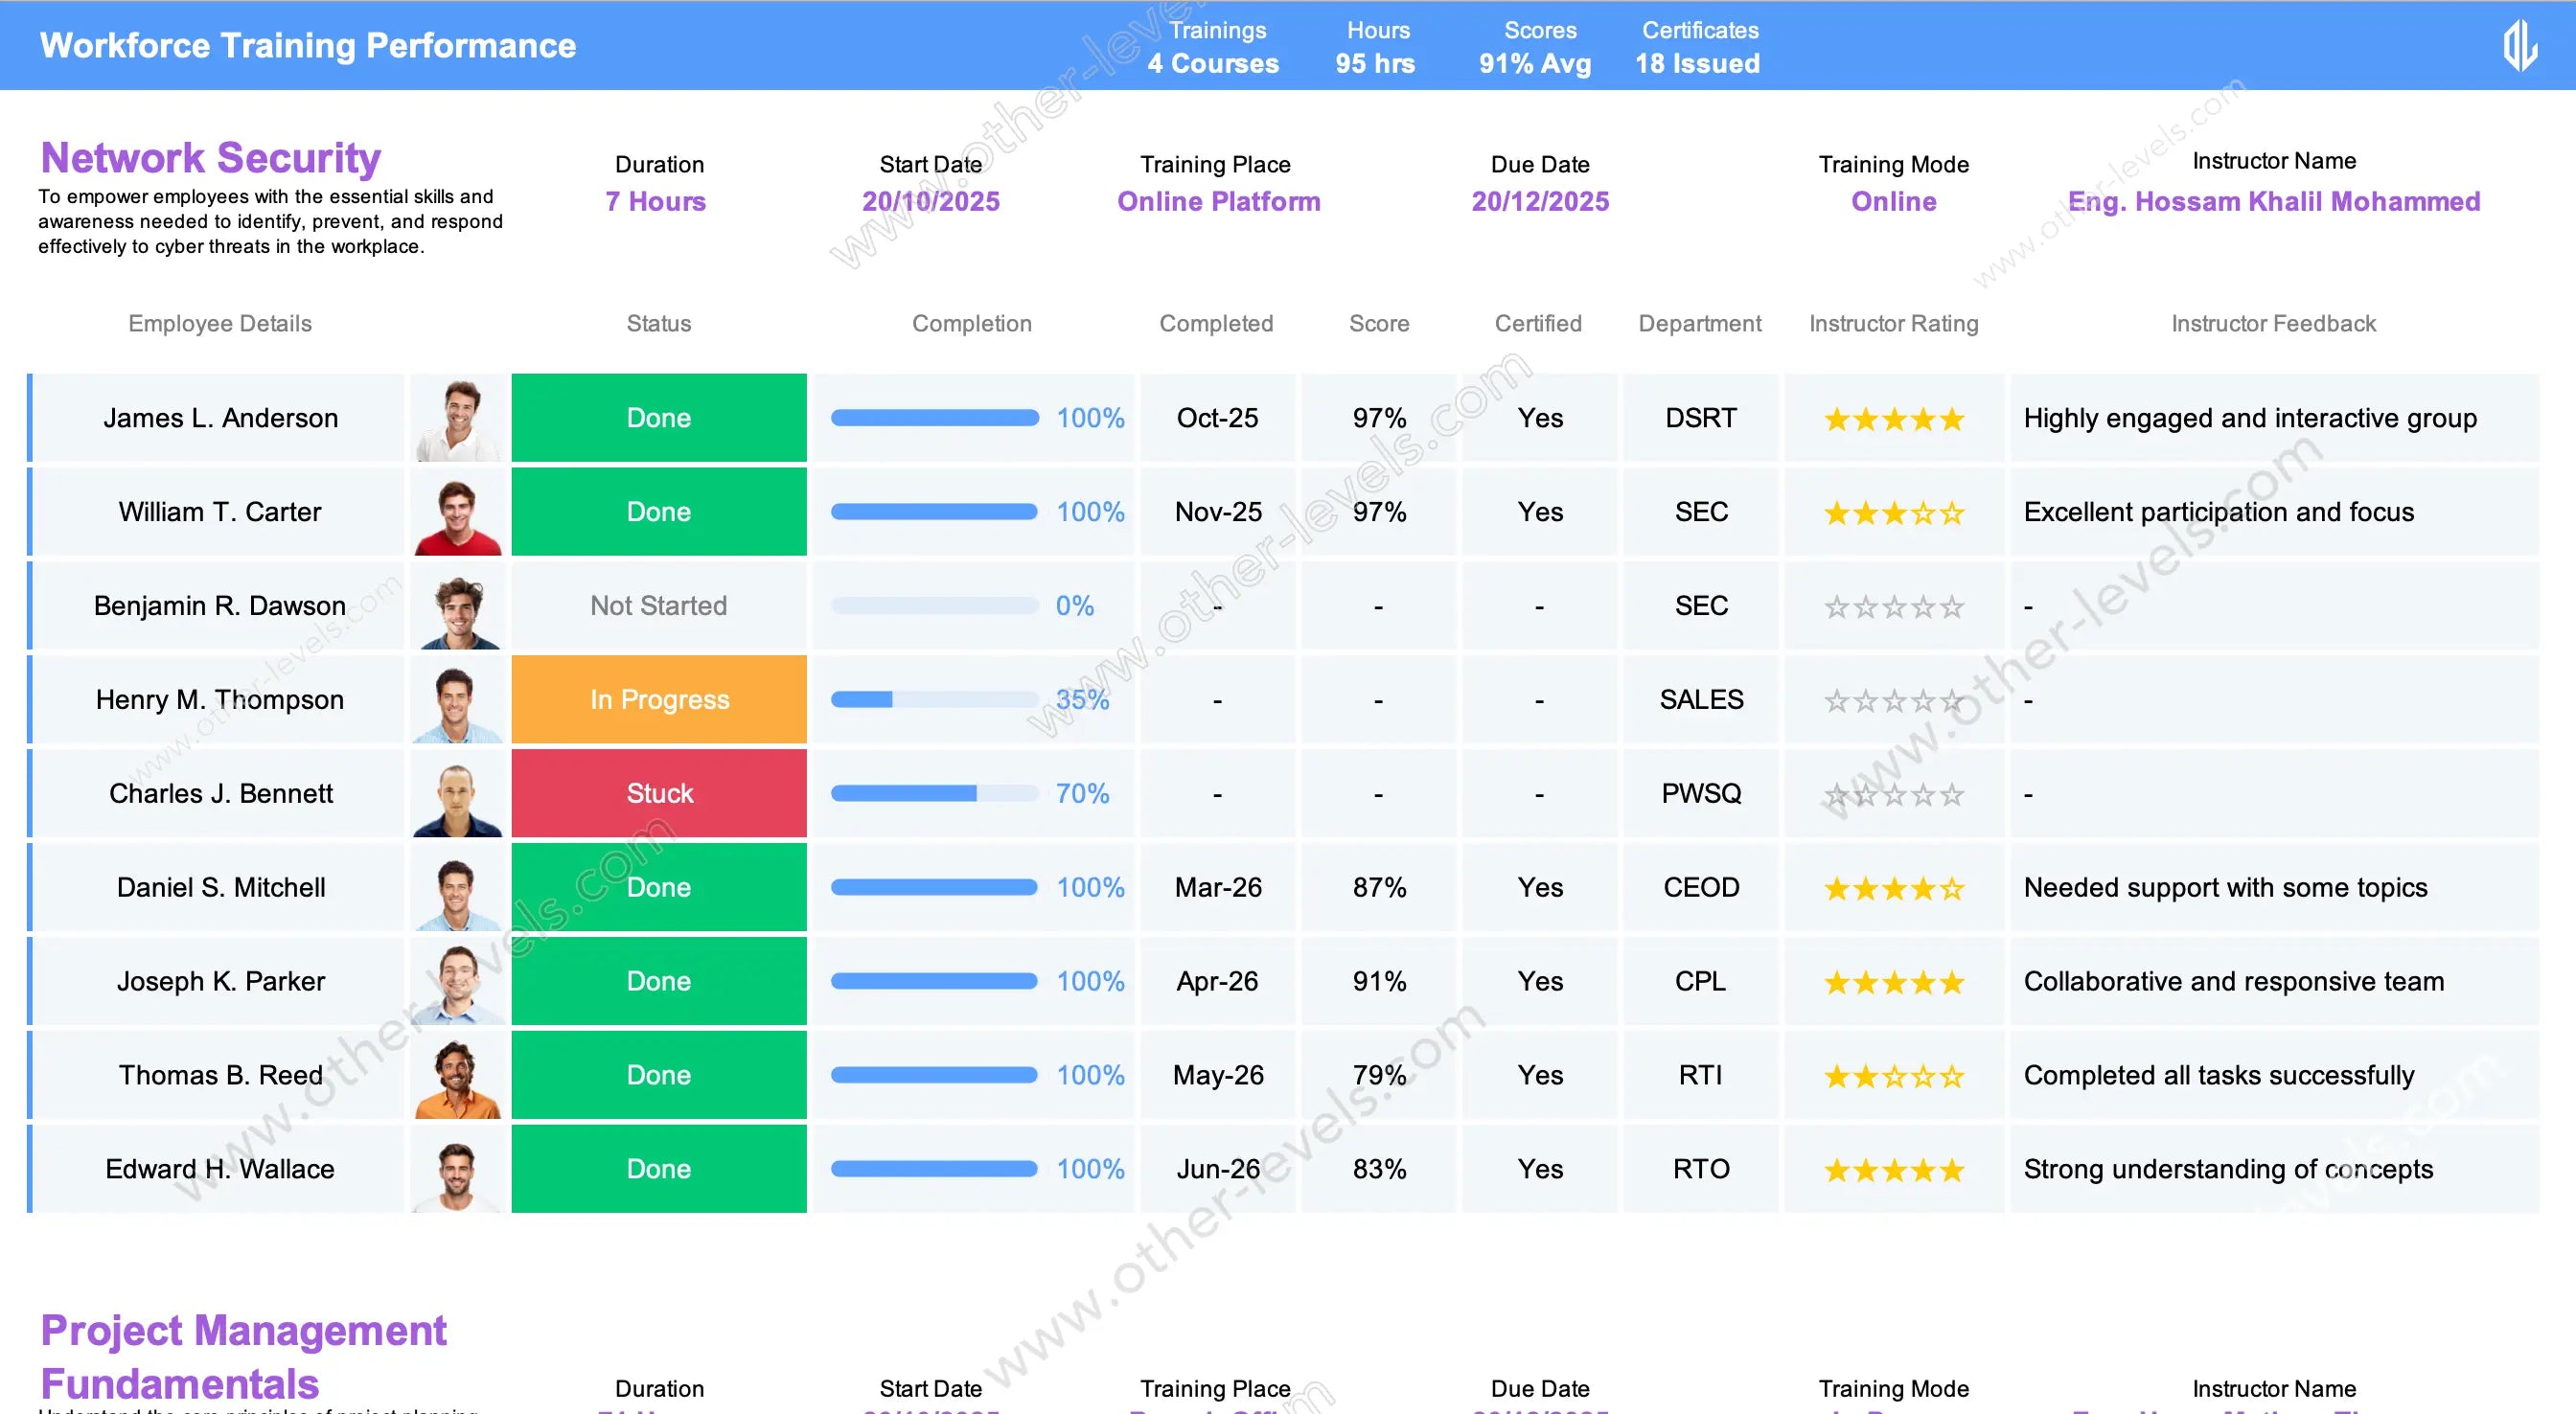
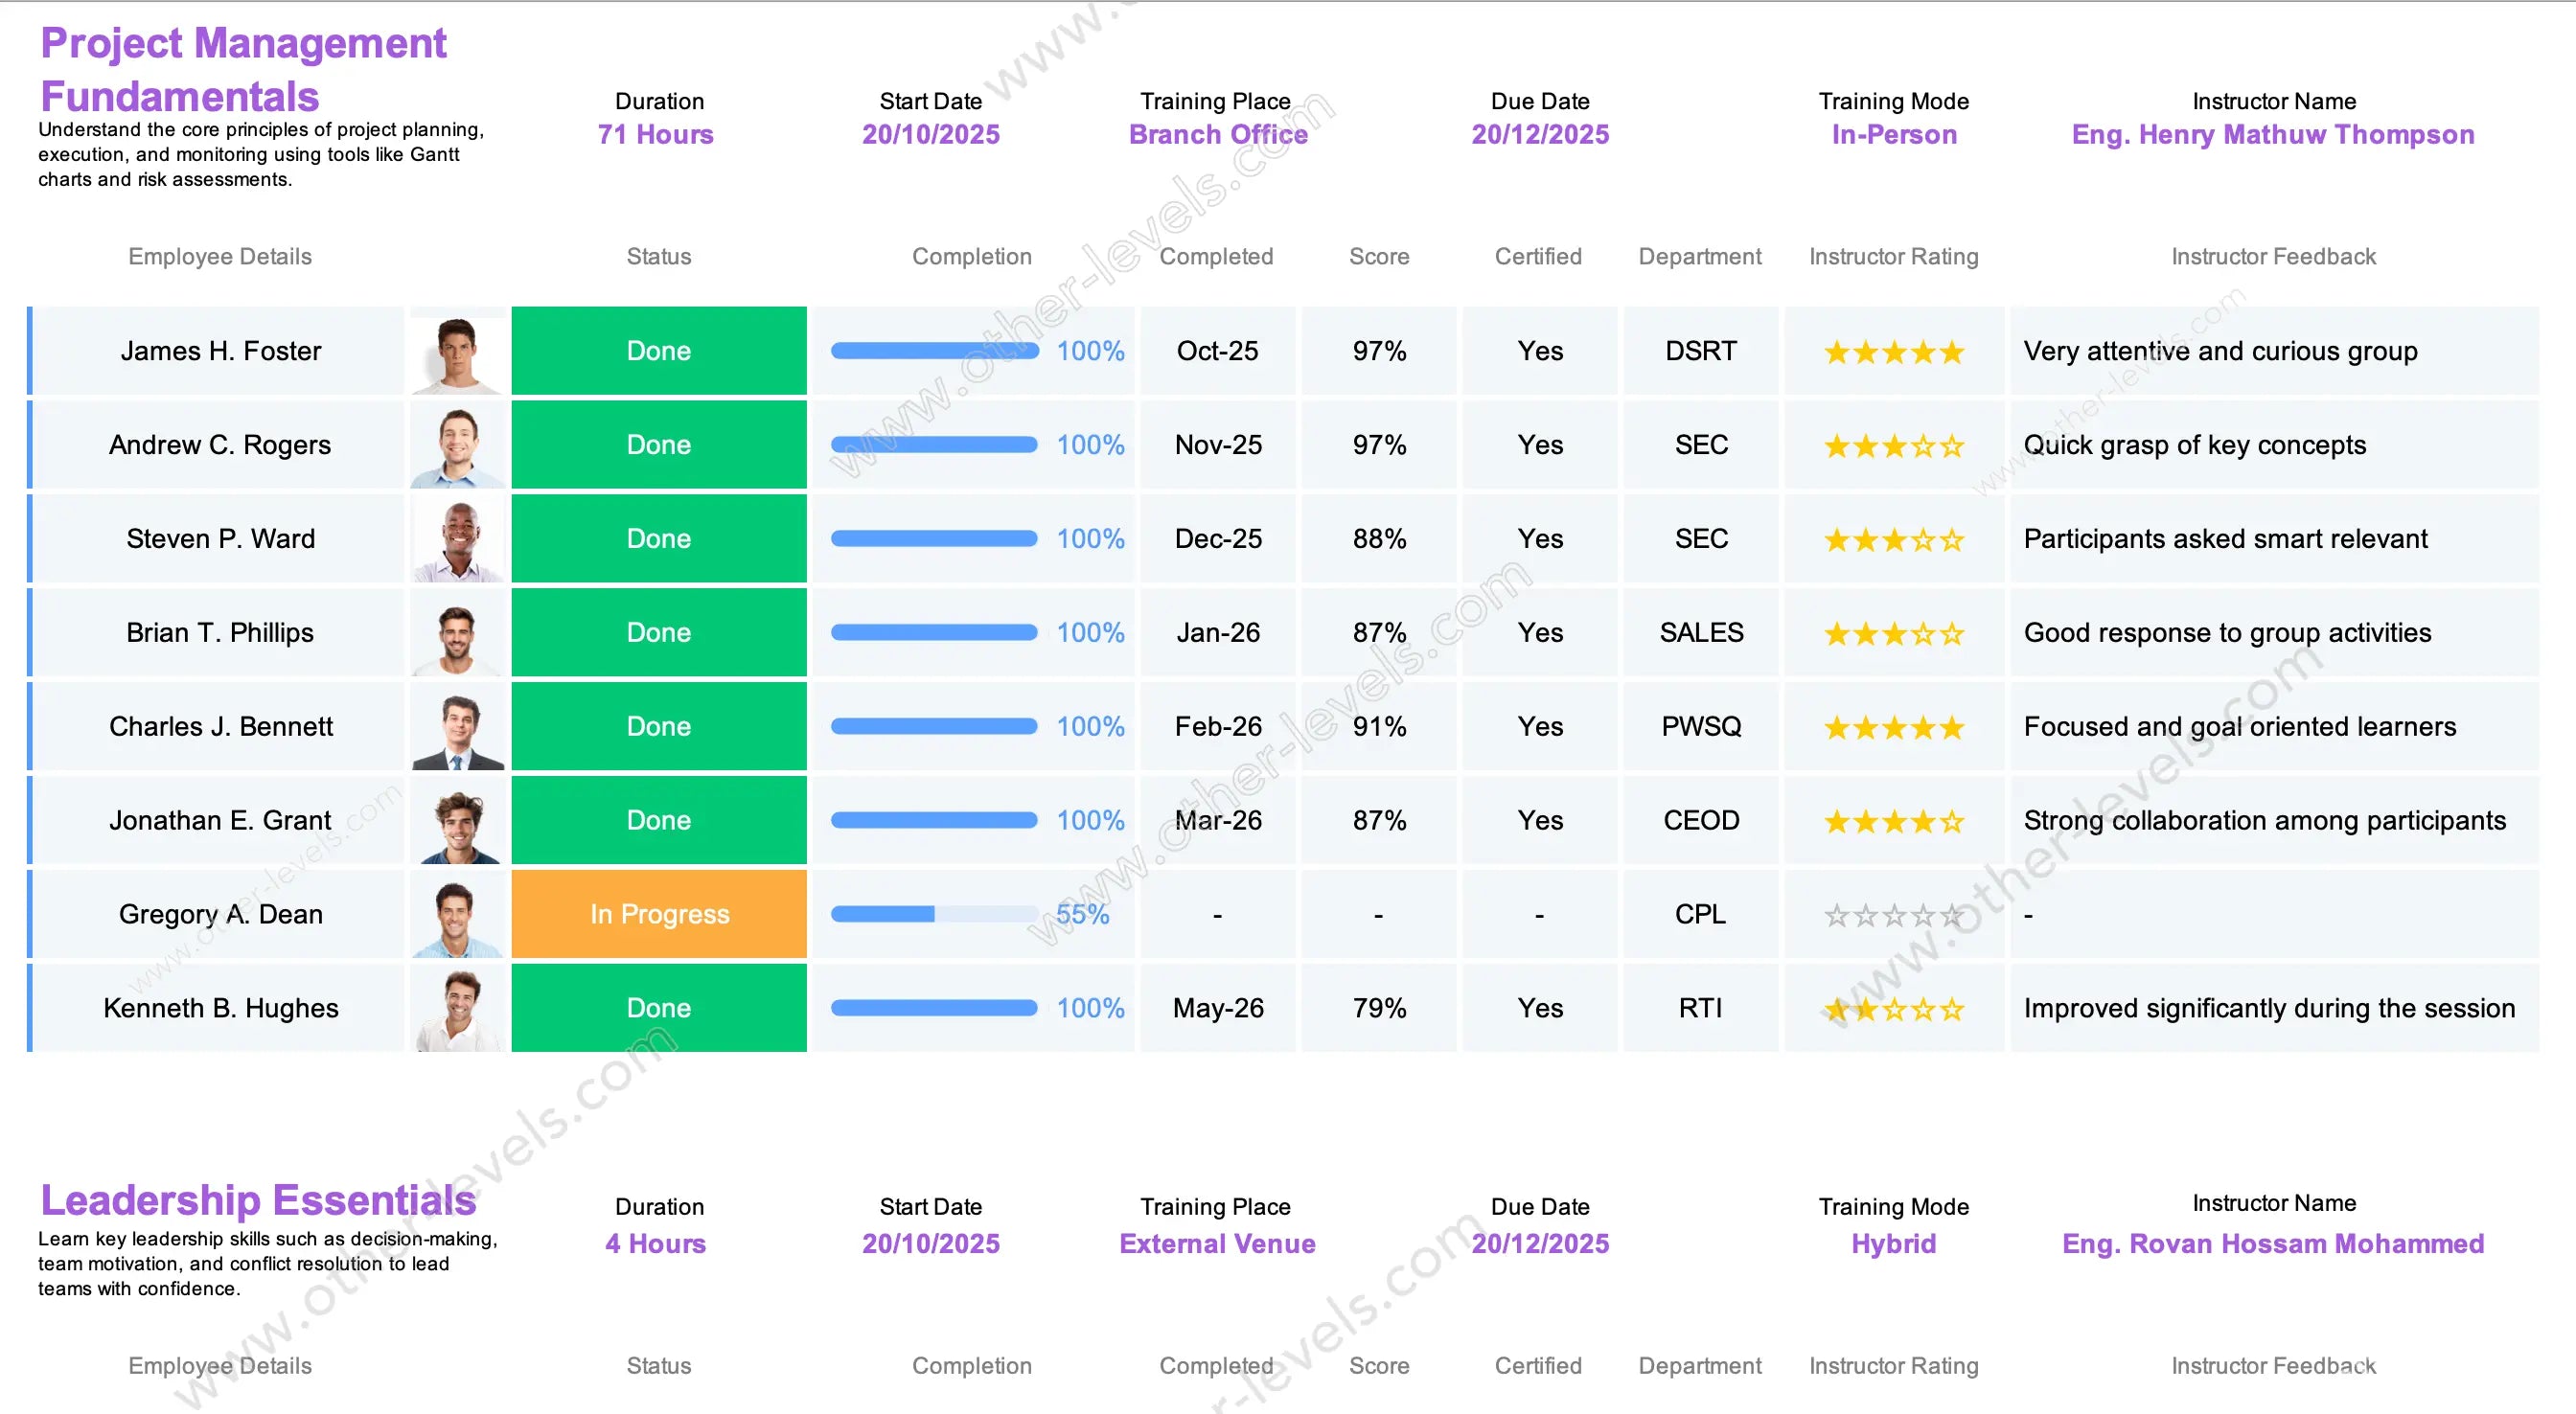
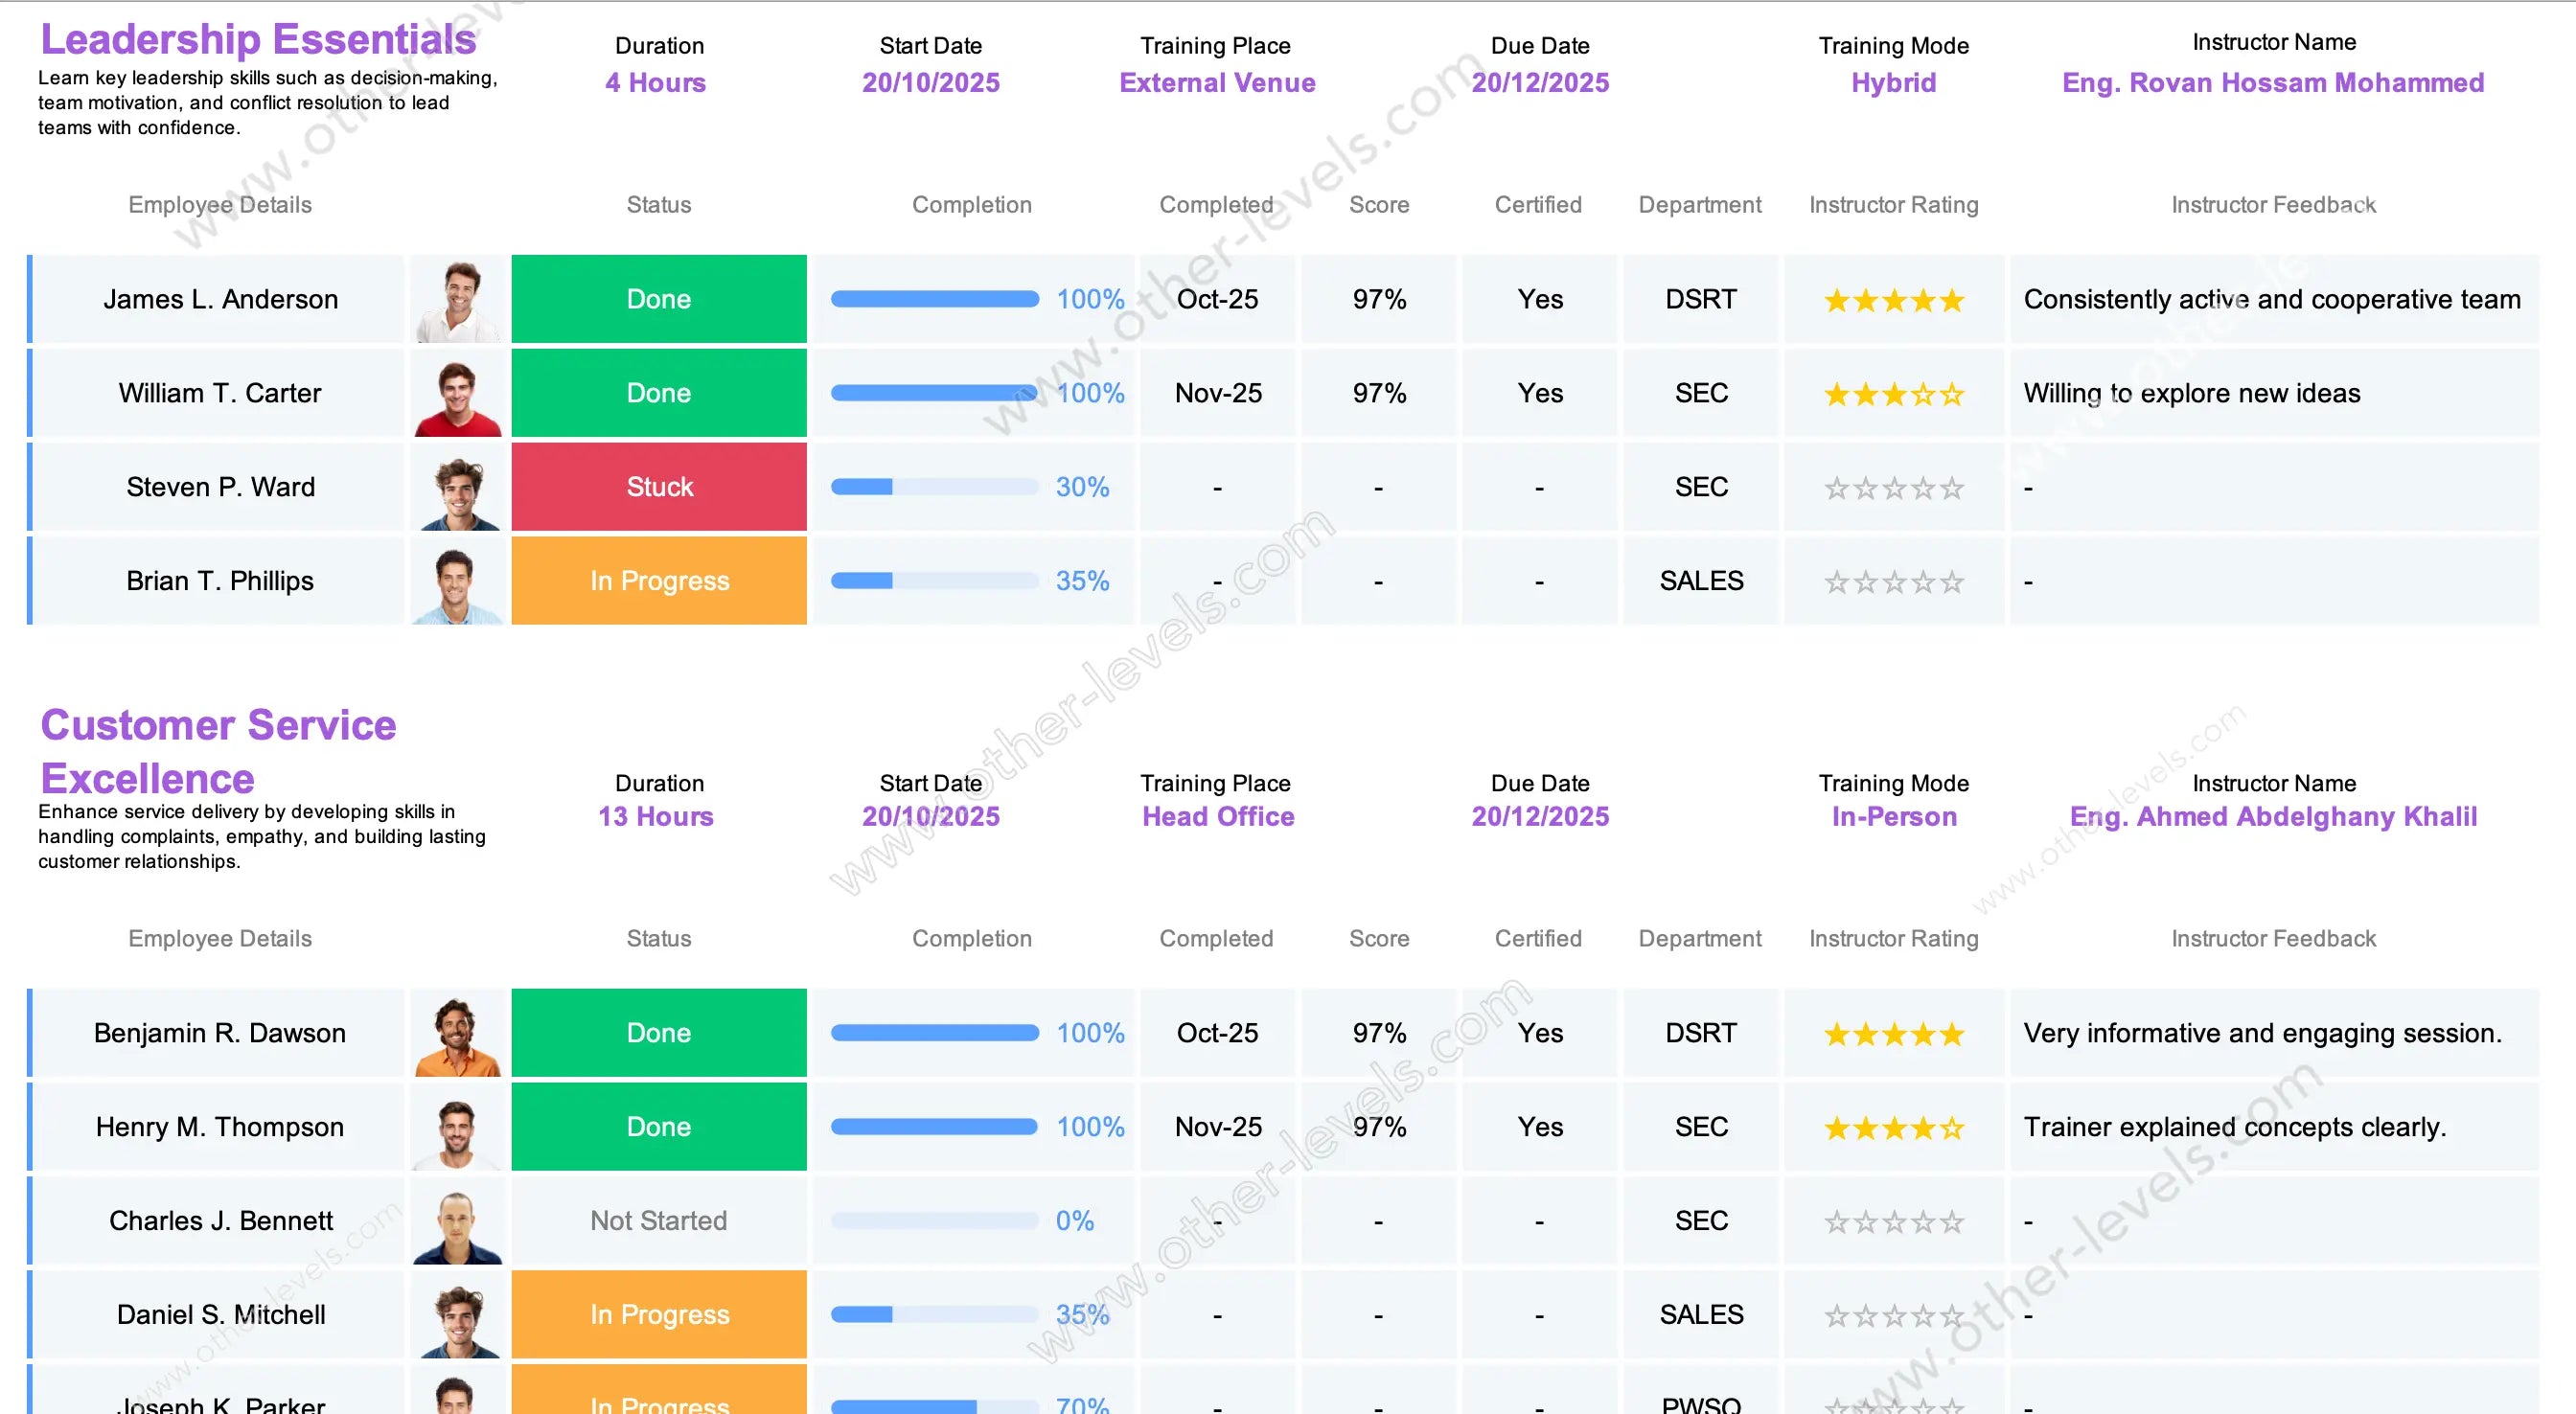
Course header (context panel)
Course details and schedule
Shows course name, duration, start/finish dates, and due date.
Training place and delivery mode
Configure the training place (online, on-site, or hybrid) for accurate tracking.
Instructor name and role
Display instructor details for context and accountability. This section updates when you change the selected course.
Learner progress table
Status, progress bar, and percent complete
- employee details with optional avatar
- Status badges (Done, In Progress, Not Started, Stuck)
- progress bar showing percent complete
- completion date when a learner reaches 100%
Scores, certification, and instructor inputs
- Score and certification flag
- Department for rollups and filtering
- instructor rating (stars) and instructor feedback notes
Conditional formatting highlights “Stuck” and overdue learners when due dates pass.
Additional courses and slicers
Smart filters and slicers
Switch to other programs with slicers for Course, Department, Status, Mode, Instructor, and Date Range—KPIs and averages update instantly.
Rollup metrics
Department summary and status distribution
- Completion Rate, On-Time Completion, Certification Rate
- Status Distribution and Department Summary
- Optional engagement index blending completion, score, and ratings
Data model
Clear Tables
Powered by fields for learner, course, dates, mode at the training place, status, score, certification, ratings, and feedback.
Visual and UX features
Bar progression, print view, and overdue cues
- Color status badges and intuitive bar progression
- Print-friendly layout for leadership reports
- Overdue cues and quick scanning for coaching actions
Typical workflows
- HR: filter by Department to find who’s stuck and send nudges
- Instructor: review feedback for instructor and scores to plan support
- Compliance: track certification and on-time metrics for audits
Customization ideas
- Per-lesson checklist to auto-compute percent complete
- Track attempts (first/best) and re-certification windows
- Variance: planned vs actual hours; department leaderboard
Video tutorial: Workforce Training Dashboard in Excel
Watch the full tutorial on our Other Levels YouTube Channel
Related Excel dashboards
For full workforce visibility, pair this Course Spreadsheet Template with the Attendance Tracking HR Dashboard and the Employee Performance Analysis Dashboard Report. Together, these dashboards streamline attendance monitoring, employee performance analytics, and training progress.
Related: Attendance Tracking HR Dashboard | Employee Performance Analysis Dashboard Report
Specifications
Get all essential details in one place. From features and package contents to software compatibility and skill level required, this section gives you a clear overview so you know exactly what to expect before download.
Template Features
Package Details
Software Compatibility
Skill Level Required
Beginner
FAQs
Please read our FAQs page to find out more.
Are the templates fully customizable?
Yes, all our templates are fully customizable. You can adjust the layout, data, and design elements to fit your specific needs. Our templates are designed to be flexible, allowing you to easily tailor them to your preferences.
Can I order a product in any language?
Yes, we provide products in any language. Simply select the "Dashboard language change" Service and once your order is placed, you will receive it within 48 hours.
What happens if I choose the wrong monitor screen size for my dashboard?
If you choose the wrong screen size, the dashboard may not display correctly on your monitor. Elements could appear too large, too small, or misaligned, affecting the readability and usability of the dashboard. We recommend selecting the appropriate screen size to ensure optimal viewing and performance.
Do I need specific skills to use the advanced Excel dashboard templates?
Our advanced Excel dashboards are easy to use, the only thing you need to know is how to work with PivotTables. With basic knowledge of PivotTables, you'll be able to customize and fully utilize these templates effortlessly. "Please check the skill level required"
All dashboards are 100% editable Excel files. Learn how to use them through our video tutorials, included datasets, and lifetime access program.