Restaurants Sales Analytics Excel Dashboard – Professional KPI Template
Pairs well with
Restaurants Sales Analytics Excel Dashboard – Professional KPI Template
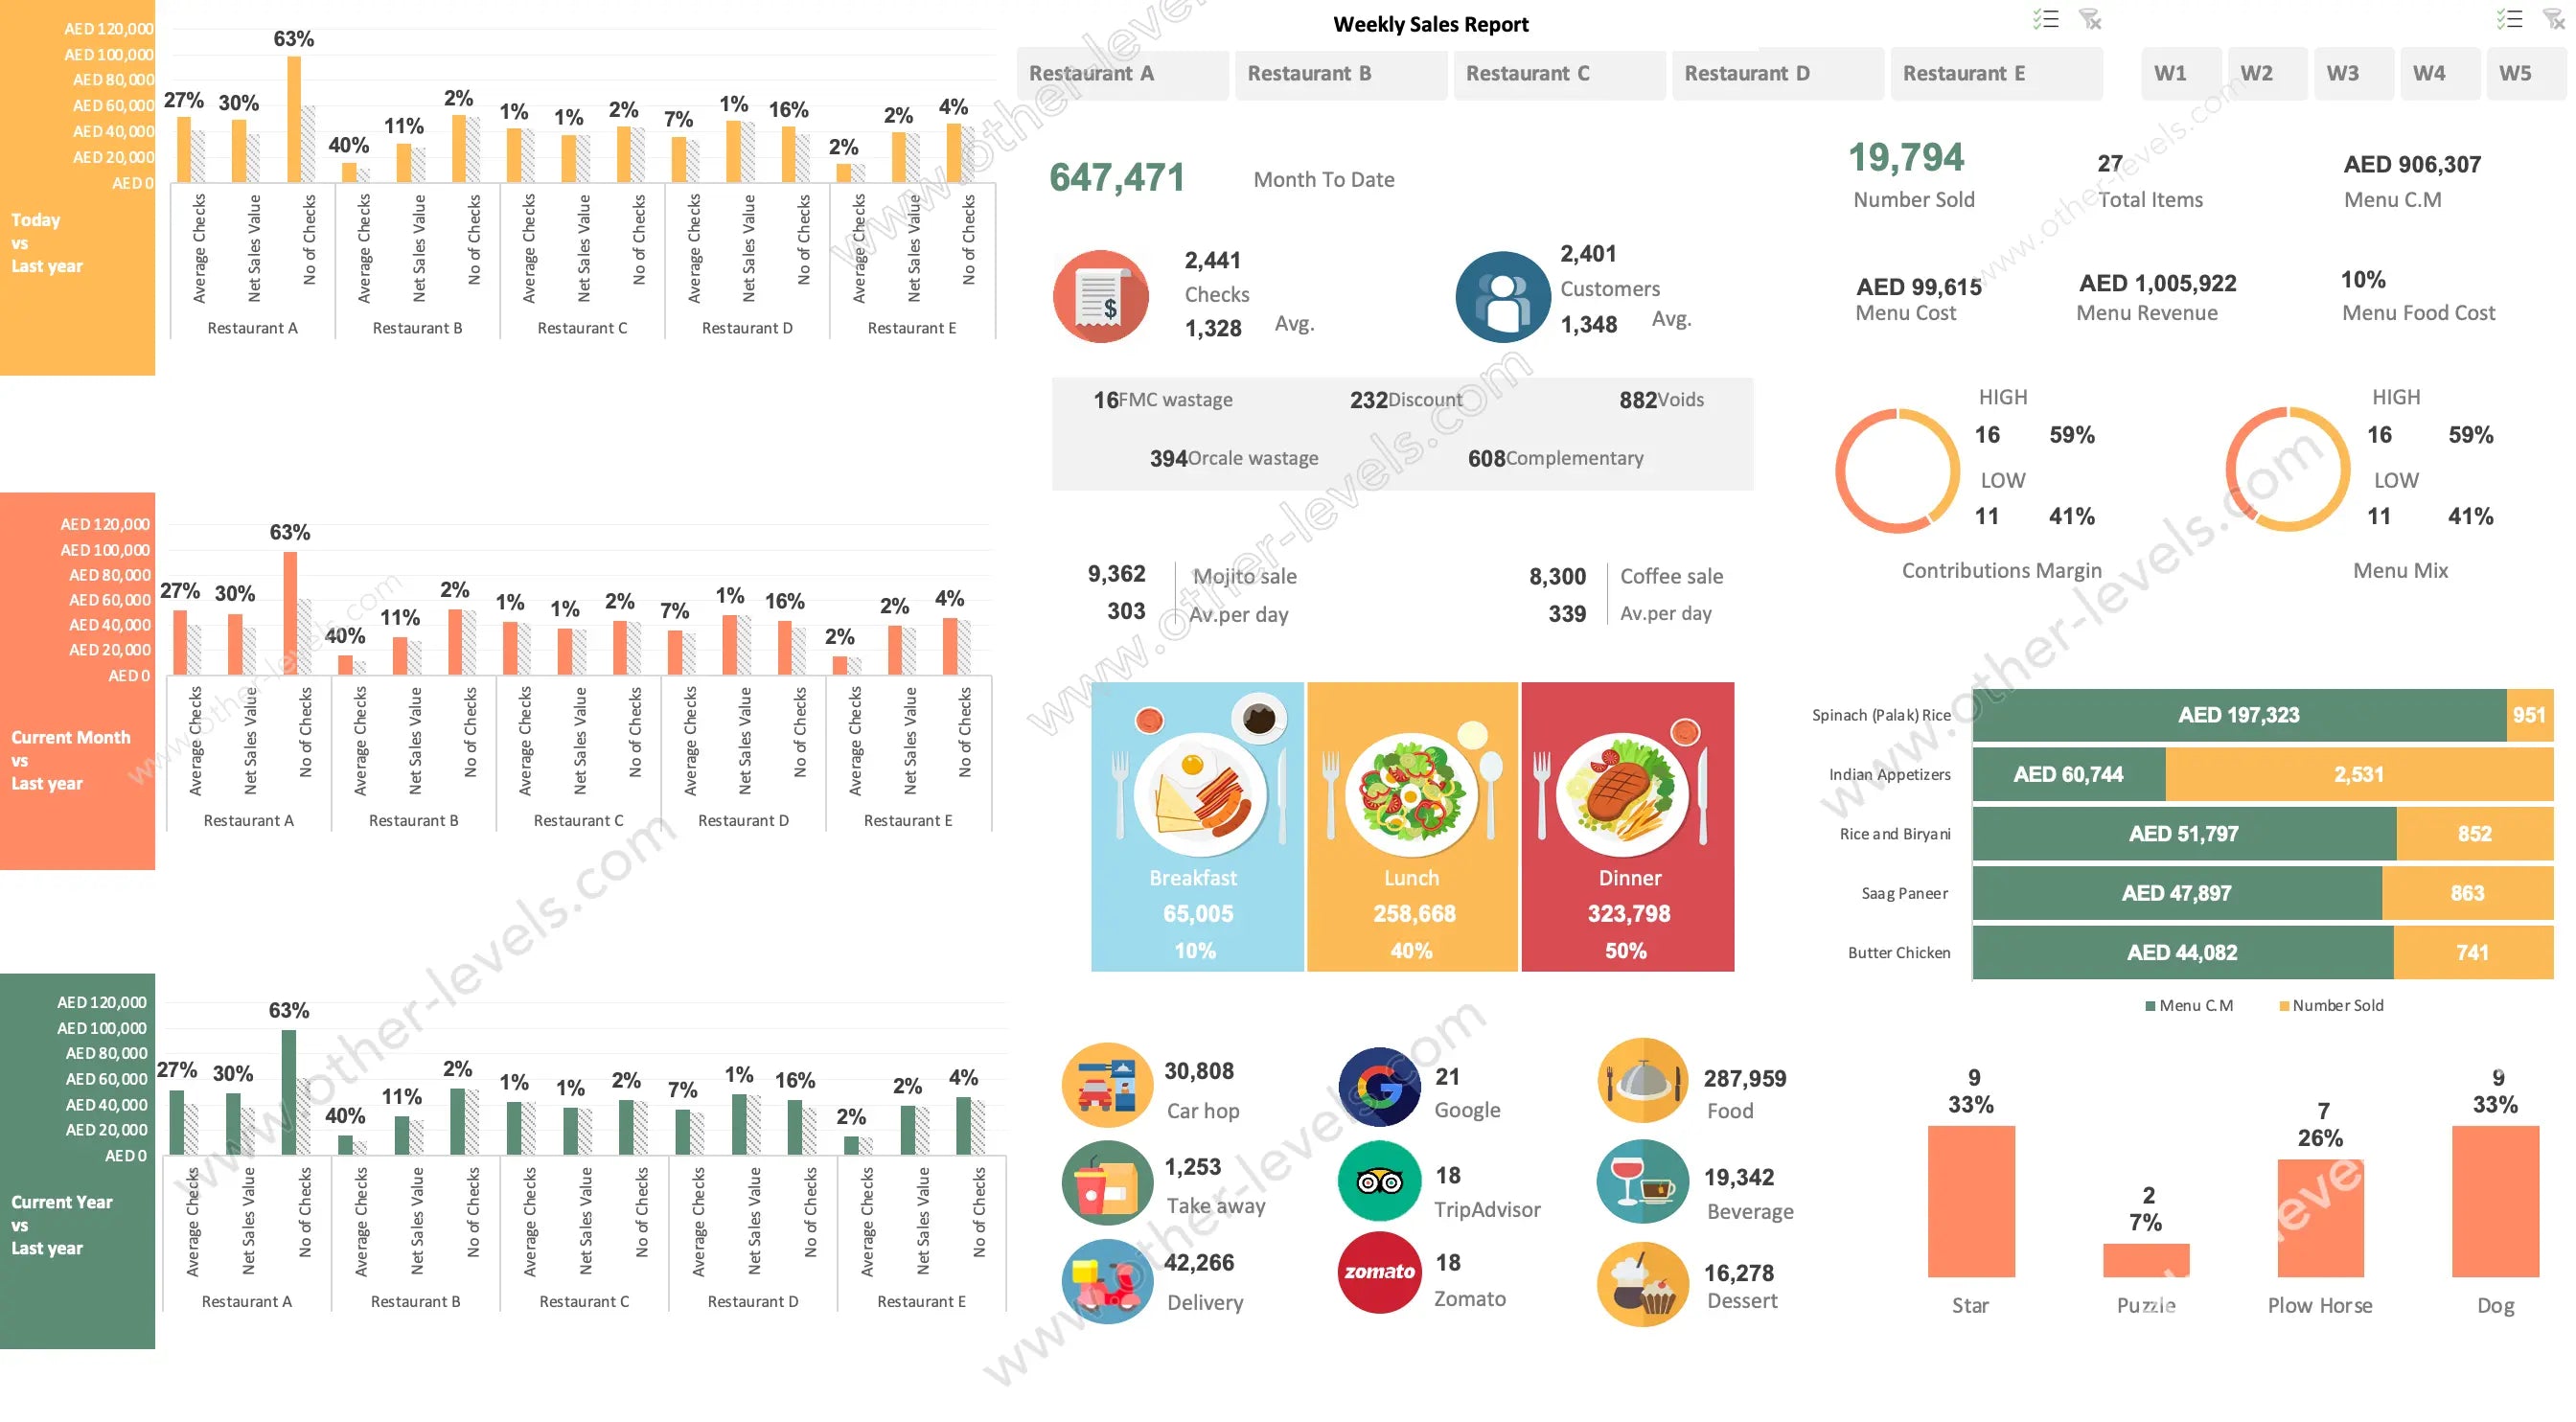
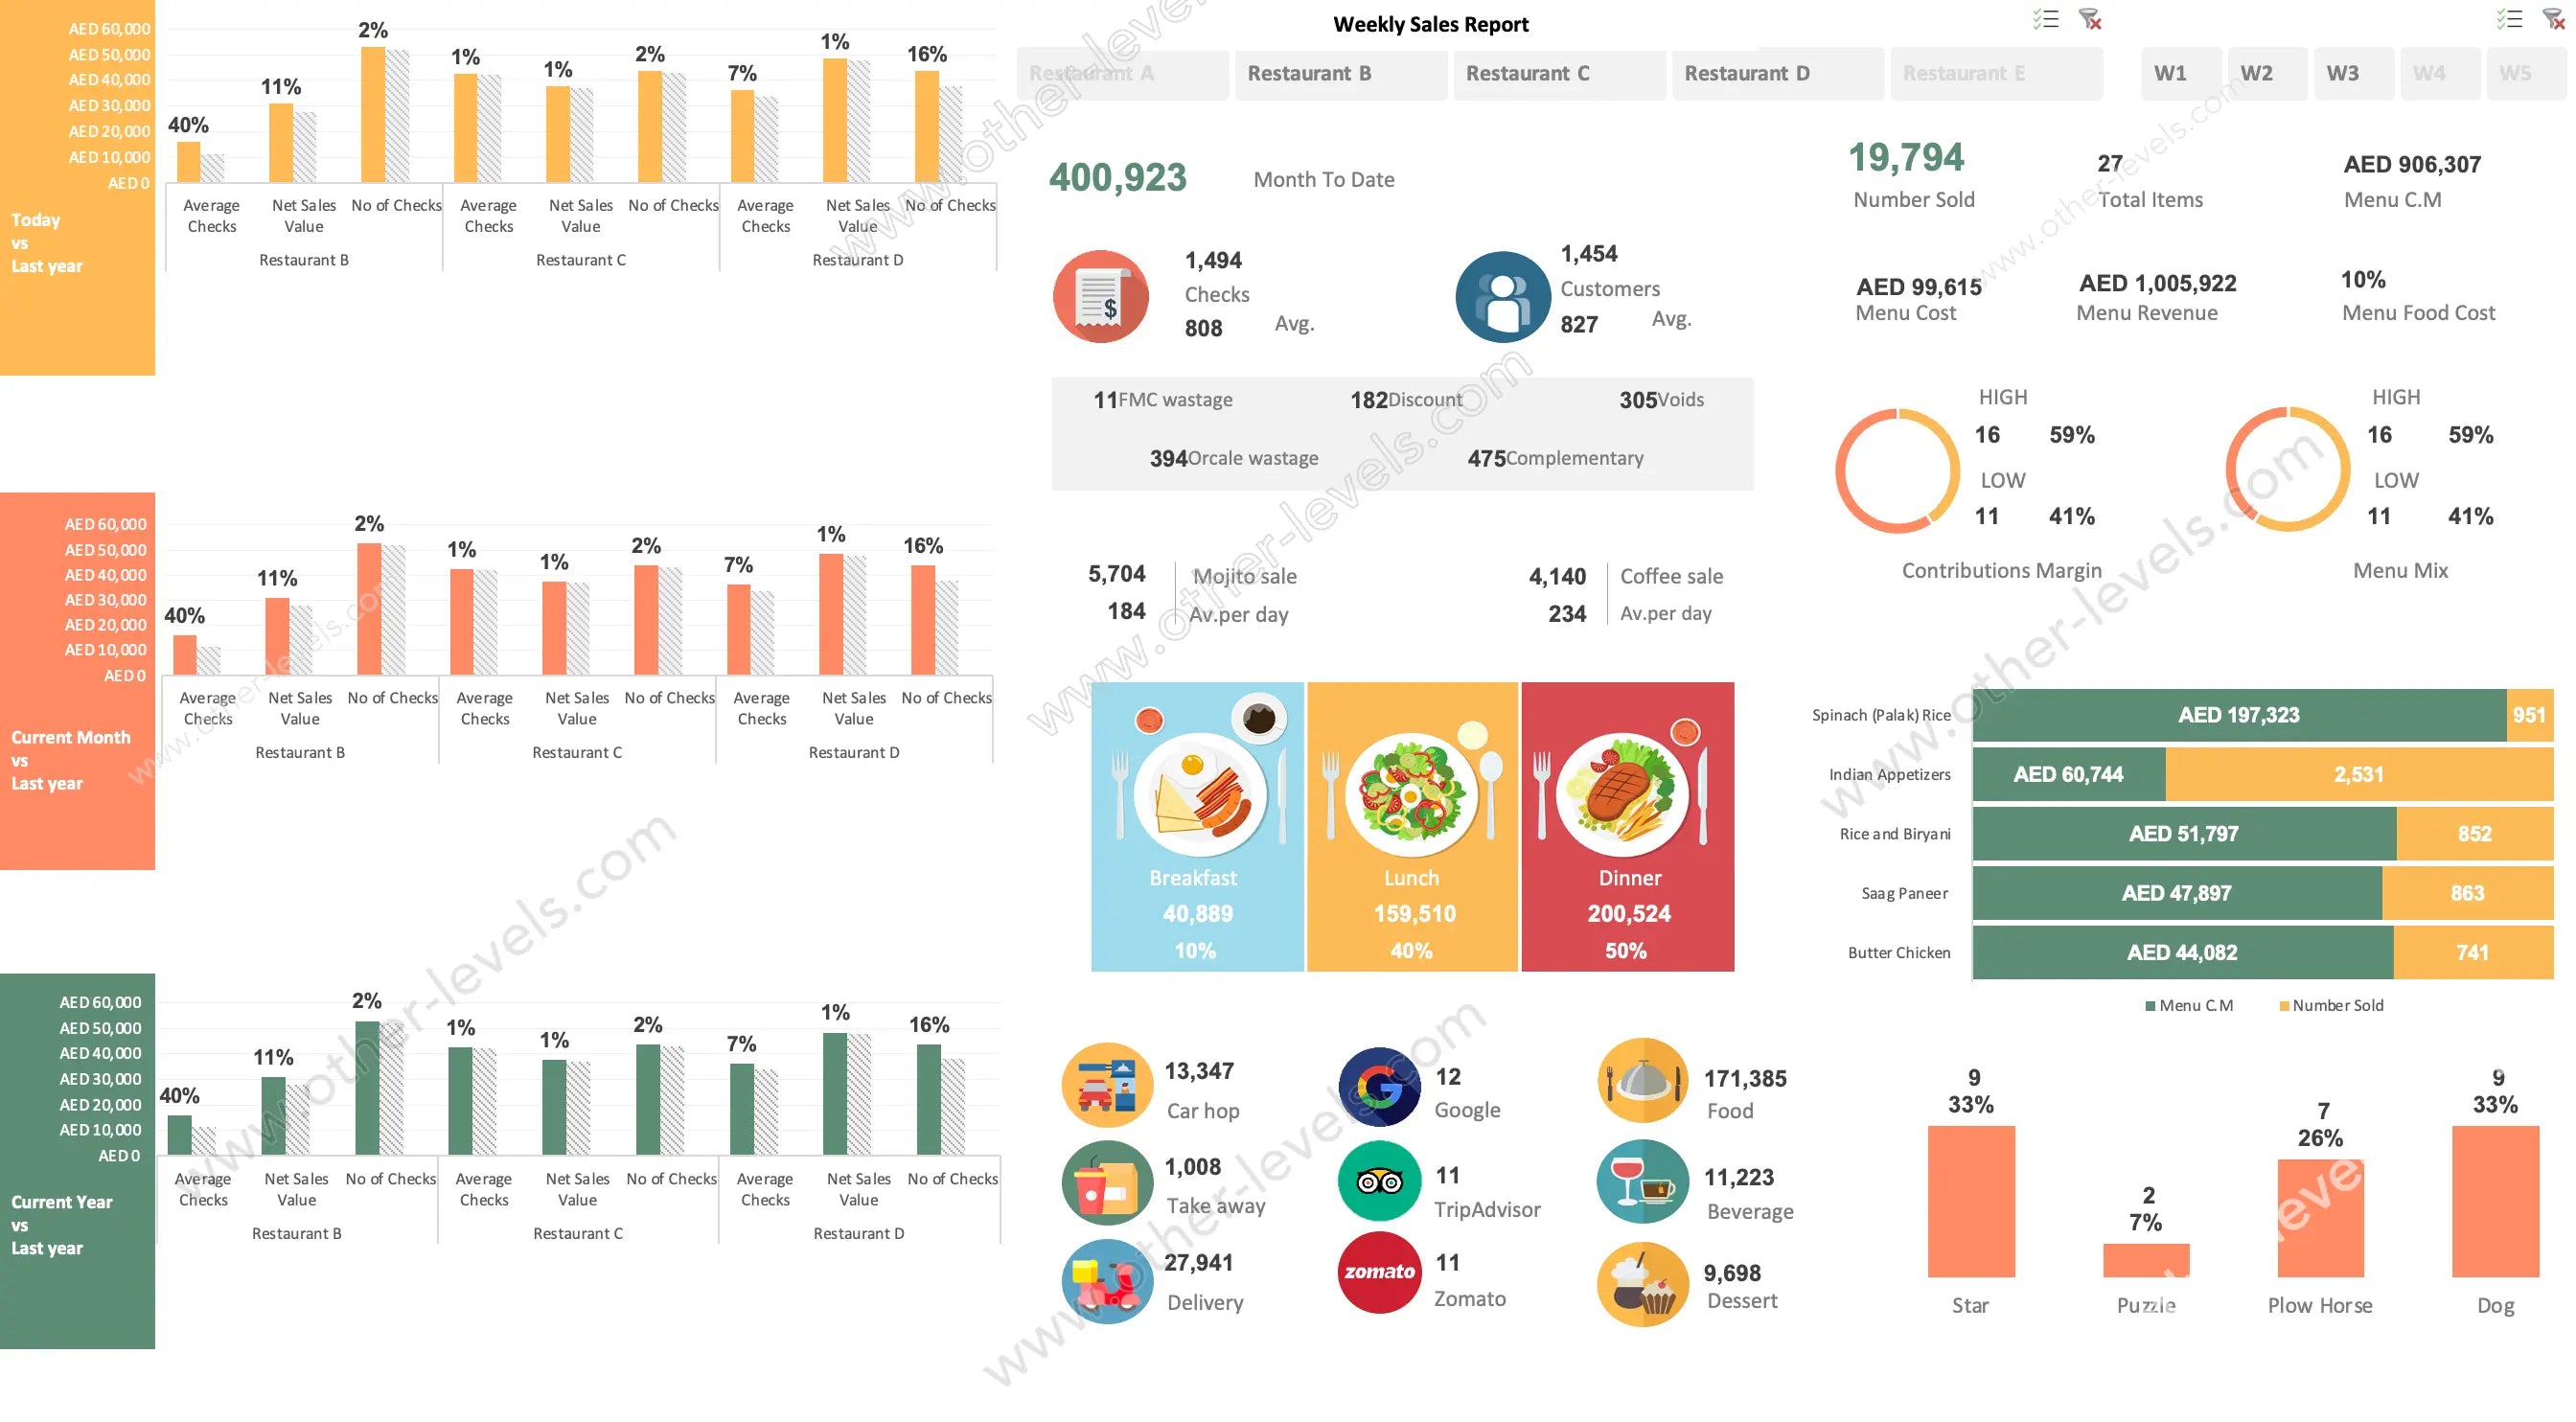
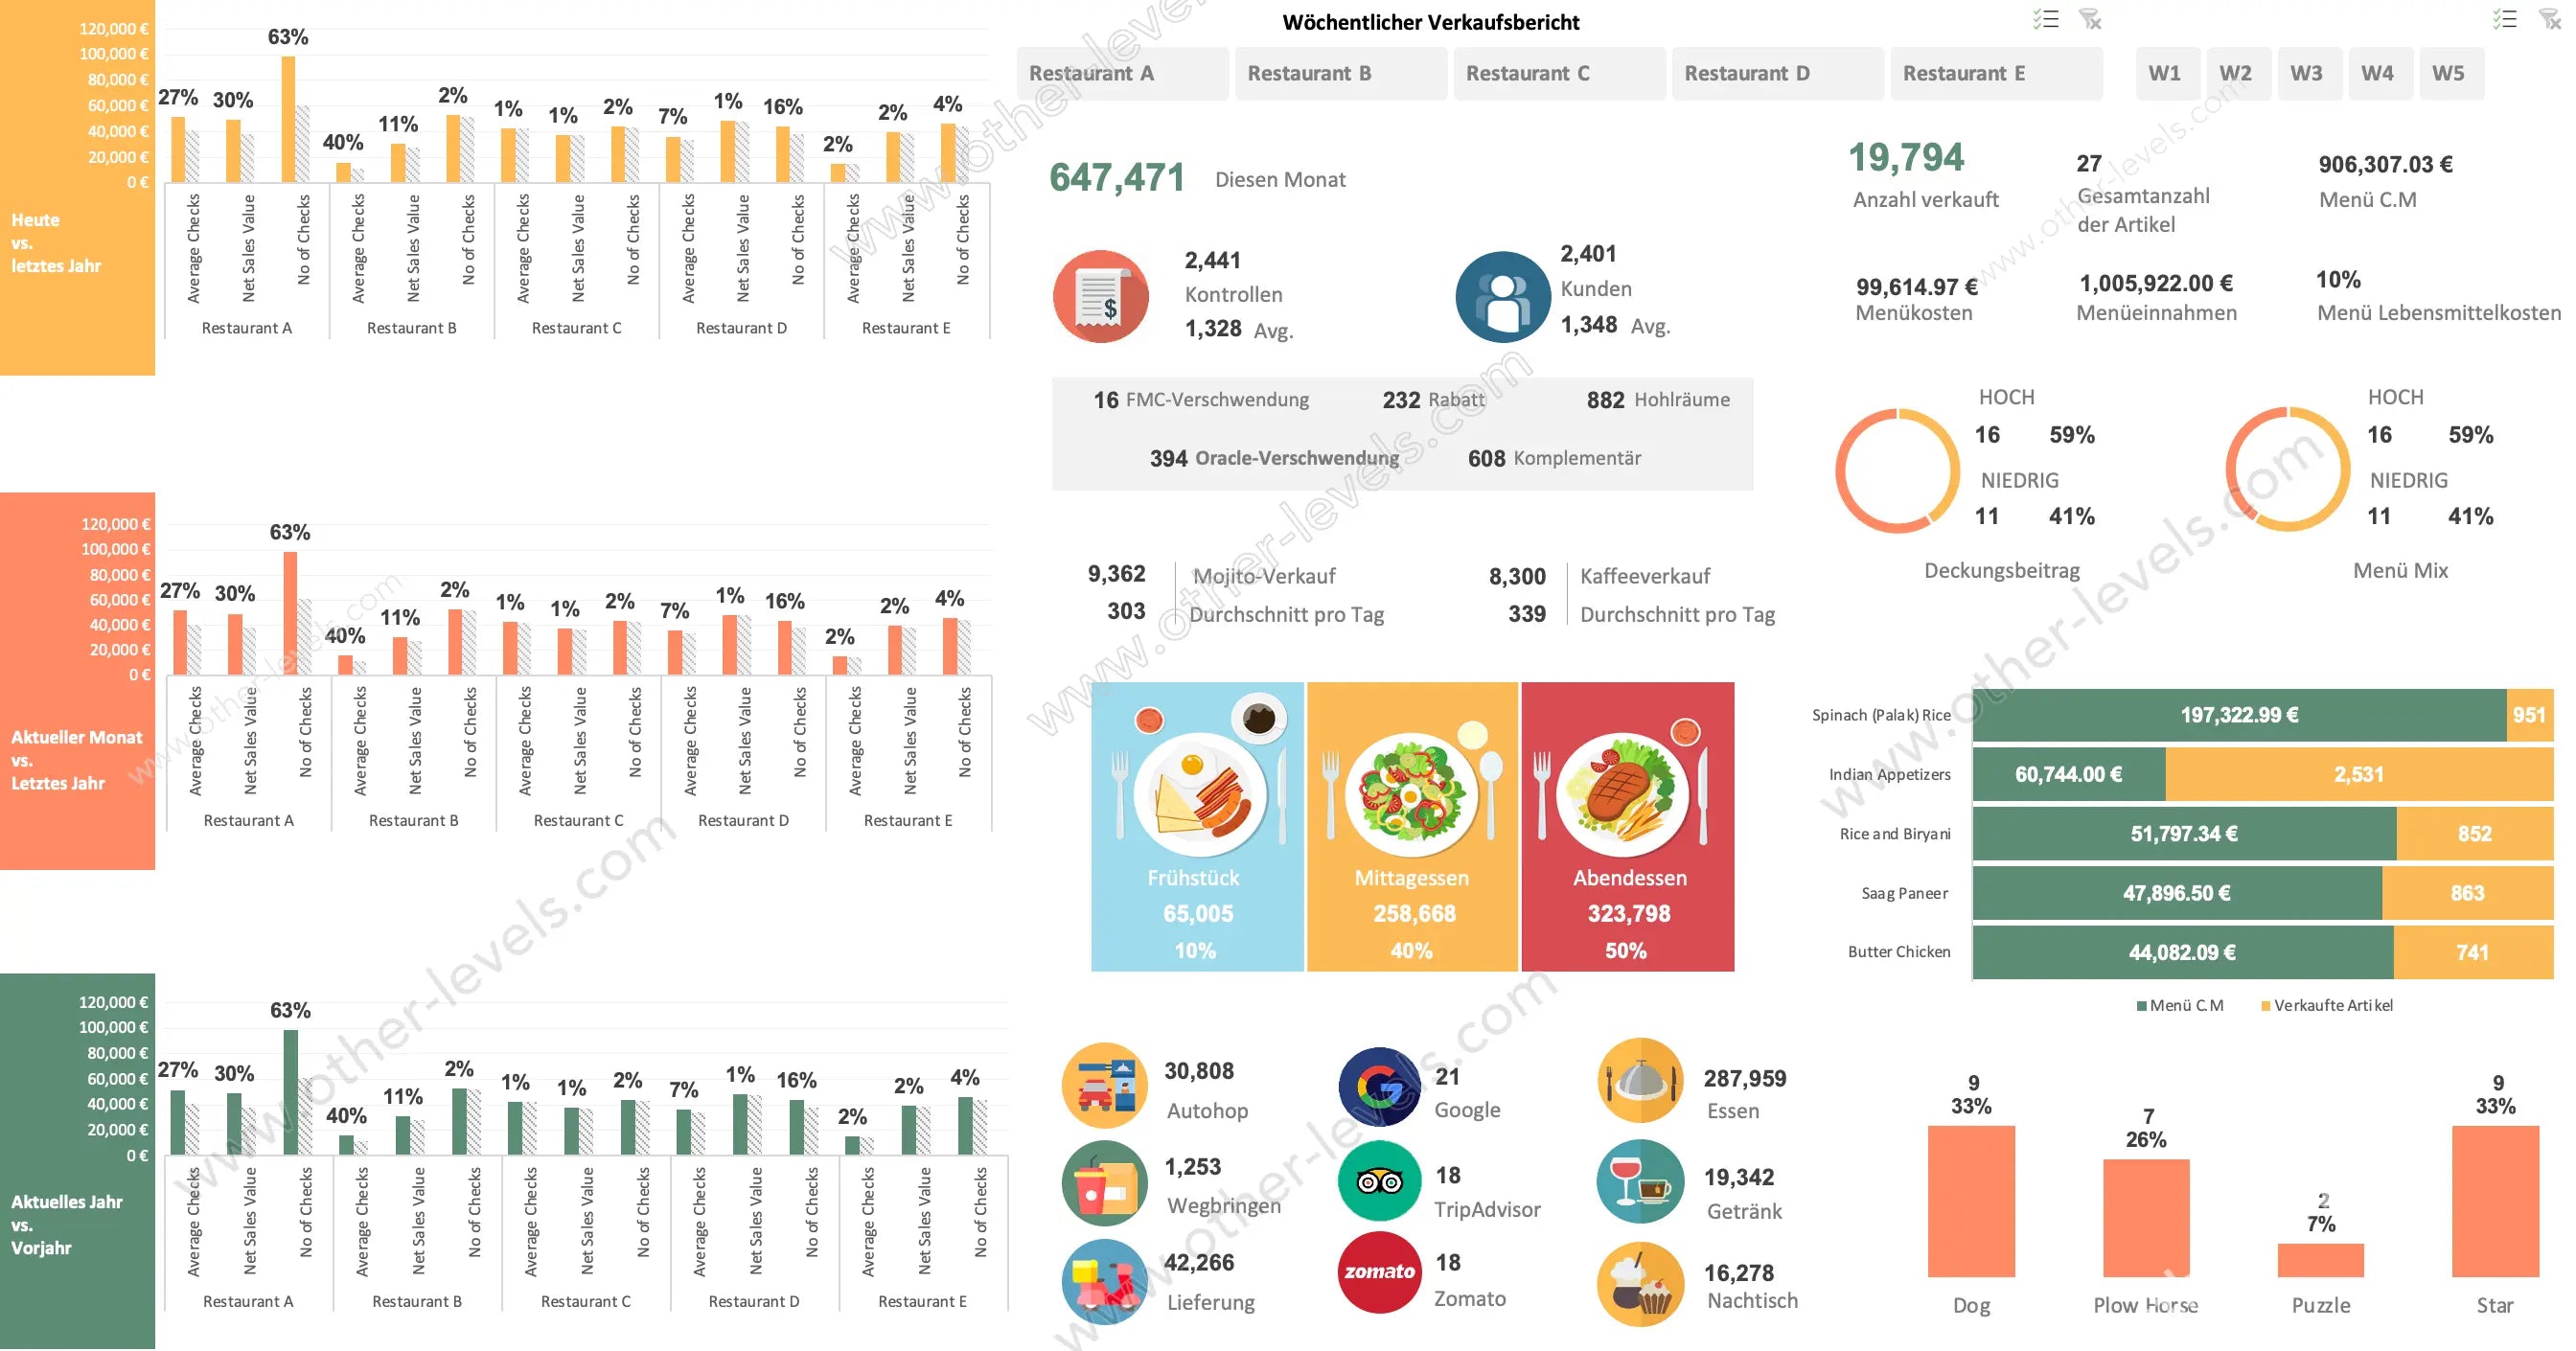
The Restaurants Sales Analytics Excel Dashboard is the perfect restaurant template for visualizing performance across branches. Built as a dynamic spreadsheet, it transforms complex data into easy-to-understand insights. Ideal for owners and managers preparing a restaurant business plan template, this tool tracks sales, costs, and customer behavior while ensuring every report looks polished and professional.
Comprehensive KPI Insights
Track your daily, monthly, and yearly results with clear visuals and instant filters. The dashboard highlights menu performance, customer volume, and profit margins—key elements in any restaurant business plan template. It also integrates with your restaurant p and l template to show real-time profitability and operational trends in one place.
Interactive Visuals & Smart Comparisons
- Compare Restaurants Sales across branches and time periods.
- Use colorful charts to explore types of food performance—breakfast, lunch, and dinner.
- Visualize cost and revenue mix through doughnut and bar charts.
- Analyze your menu efficiency with the built-in menu engineering quadrant.
Benefits & Use Cases
- Perfect for building a restaurant website template demo or showcasing business analytics online.
- Integrates smoothly with any restaurant p and l template for advanced financial tracking.
- Useful for restaurant groups, cafés, and hospitality companies managing multiple outlets.
- Supports executive reporting and data-driven decision-making for long-term planning.
Why Choose This Excel Dashboard
This restaurant template helps entrepreneurs and managers understand sales flow, cost ratios, and menu success instantly. Whether you're refining your restaurant business plan template or optimizing your operations, this Excel Dashboard gives you the structure and clarity to grow efficiently. Designed to align with your restaurant website template and business visuals, it brings together analytics and design in one seamless tool.
Expand your analysis with the Sales by Region Excel Dashboard to track area-based results, or get the complete Sales & Marketing Bundle for a unified system that connects sales, marketing, and restaurant performance templates.
Specifications
Get all essential details in one place. From features and package contents to software compatibility and skill level required, this section gives you a clear overview so you know exactly what to expect before download.
Template Features
Package Details
Software Compatibility
Skill Level Required
Beginner
FAQs
Please read our FAQs page to find out more.
Are the templates fully customizable?
Yes, all our templates are fully customizable. You can adjust the layout, data, and design elements to fit your specific needs. Our templates are designed to be flexible, allowing you to easily tailor them to your preferences.
Can I order a product in any language?
Yes, we provide products in any language. Simply select the "Other Language" option from the product options during your purchase. Once your order is placed, you will receive it within 48 hours.
What happens if I choose the wrong monitor screen size for my dashboard?
If you choose the wrong screen size, the dashboard may not display correctly on your monitor. Elements could appear too large, too small, or misaligned, affecting the readability and usability of the dashboard. We recommend selecting the appropriate screen size to ensure optimal viewing and performance.
Do I need specific skills to use the advanced Excel dashboard templates?
Our advanced Excel dashboards are easy to use, the only thing you need to know is how to work with PivotTables. With basic knowledge of PivotTables, you'll be able to customize and fully utilize these templates effortlessly. "Please check the skill level required"