


Excel Dashboard Templates for Clear, Faster Business Reporting
Choose a professional Excel dashboard template for finance, sales, project management, HR, operations, supply chain, education, and personal budgeting. Start with a proven reporting structure, add your own data, and turn complex spreadsheets into decisions your team can understand.
Read more
Not sure where to begin? Choose the dashboard that matches the question you need to answer—sales performance, budget versus actual, profit and loss, project status, workforce KPIs, logistics performance, or monthly expenses.
- Ready-made structure: avoid starting from a blank workbook.
- Editable Excel files: customize labels, data, colors, and reporting periods.
- Interactive reporting: explore KPI cards, charts, PivotTables, filters, and slicers.
- Business-ready use cases: templates for analysts, managers, consultants, teams, and small businesses.
Browse Excel Dashboards by Business Function
- Financial Dashboard Templates — cash flow, P&L, budgets, expenses, and forecasts.
- Sales Dashboard Templates — revenue, targets, teams, regions, and sales KPIs.
- HR Dashboard Templates — attendance, turnover, headcount, payroll, and workforce analytics.
- Project Management Dashboards — milestones, budgets, capacity, status, and risks.
- Supply Chain Dashboards — logistics, freight, fleet, vendors, and operations.
- Personal Finance Dashboards — budgets, income, expenses, savings, and net worth.
- KPI Dashboard Templates — executive scorecards, sales KPIs, project and call centre KPI trackers.
Need templates for several departments or client projects? Compare Full Access with purchasing individual dashboards.
Explore frequently asked questions
Can I use my own data?
These templates are customizable reporting starting points. Review each product page for its included file, supported layout, available options, and instructions before purchasing.
Should I buy one template or Full Access?
Choose an individual dashboard for one defined reporting need. Full Access may be a better fit when you create reports for multiple teams, departments, or clients.
How do I choose the right dashboard?
Start with the decision the report must support, then choose the template whose KPIs, layout, and business use case are closest to that decision.
Excel Dashboard Templates & Guide
Excel Dashboard Templates for Clear, Faster Business Reporting
Choose a professional Excel dashboard template for finance, sales, project management, HR, operations, supply chain, education, and personal budgeting. Start with a proven reporting structure, add your own data, and turn complex spreadsheets into decisions your team can understand.
Read more
Not sure where to begin? Choose the dashboard that matches the question you need to answer—sales performance, budget versus actual, profit and loss, project status, workforce KPIs, logistics performance, or monthly expenses.
- Ready-made structure: avoid starting from a blank workbook.
- Editable Excel files: customize labels, data, colors, and reporting periods.
- Interactive reporting: explore KPI cards, charts, PivotTables, filters, and slicers.
- Business-ready use cases: templates for analysts, managers, consultants, teams, and small businesses.
Browse Excel Dashboards by Business Function
- Financial Dashboard Templates — cash flow, P&L, budgets, expenses, and forecasts.
- Sales Dashboard Templates — revenue, targets, teams, regions, and sales KPIs.
- HR Dashboard Templates — attendance, turnover, headcount, payroll, and workforce analytics.
- Project Management Dashboards — milestones, budgets, capacity, status, and risks.
- Supply Chain Dashboards — logistics, freight, fleet, vendors, and operations.
- Personal Finance Dashboards — budgets, income, expenses, savings, and net worth.
- KPI Dashboard Templates — executive scorecards, sales KPIs, project and call centre KPI trackers.
Need templates for several departments or client projects? Compare Full Access with purchasing individual dashboards.
Explore frequently asked questions
Can I use my own data?
These templates are customizable reporting starting points. Review each product page for its included file, supported layout, available options, and instructions before purchasing.
Should I buy one template or Full Access?
Choose an individual dashboard for one defined reporting need. Full Access may be a better fit when you create reports for multiple teams, departments, or clients.
How do I choose the right dashboard?
Start with the decision the report must support, then choose the template whose KPIs, layout, and business use case are closest to that decision.
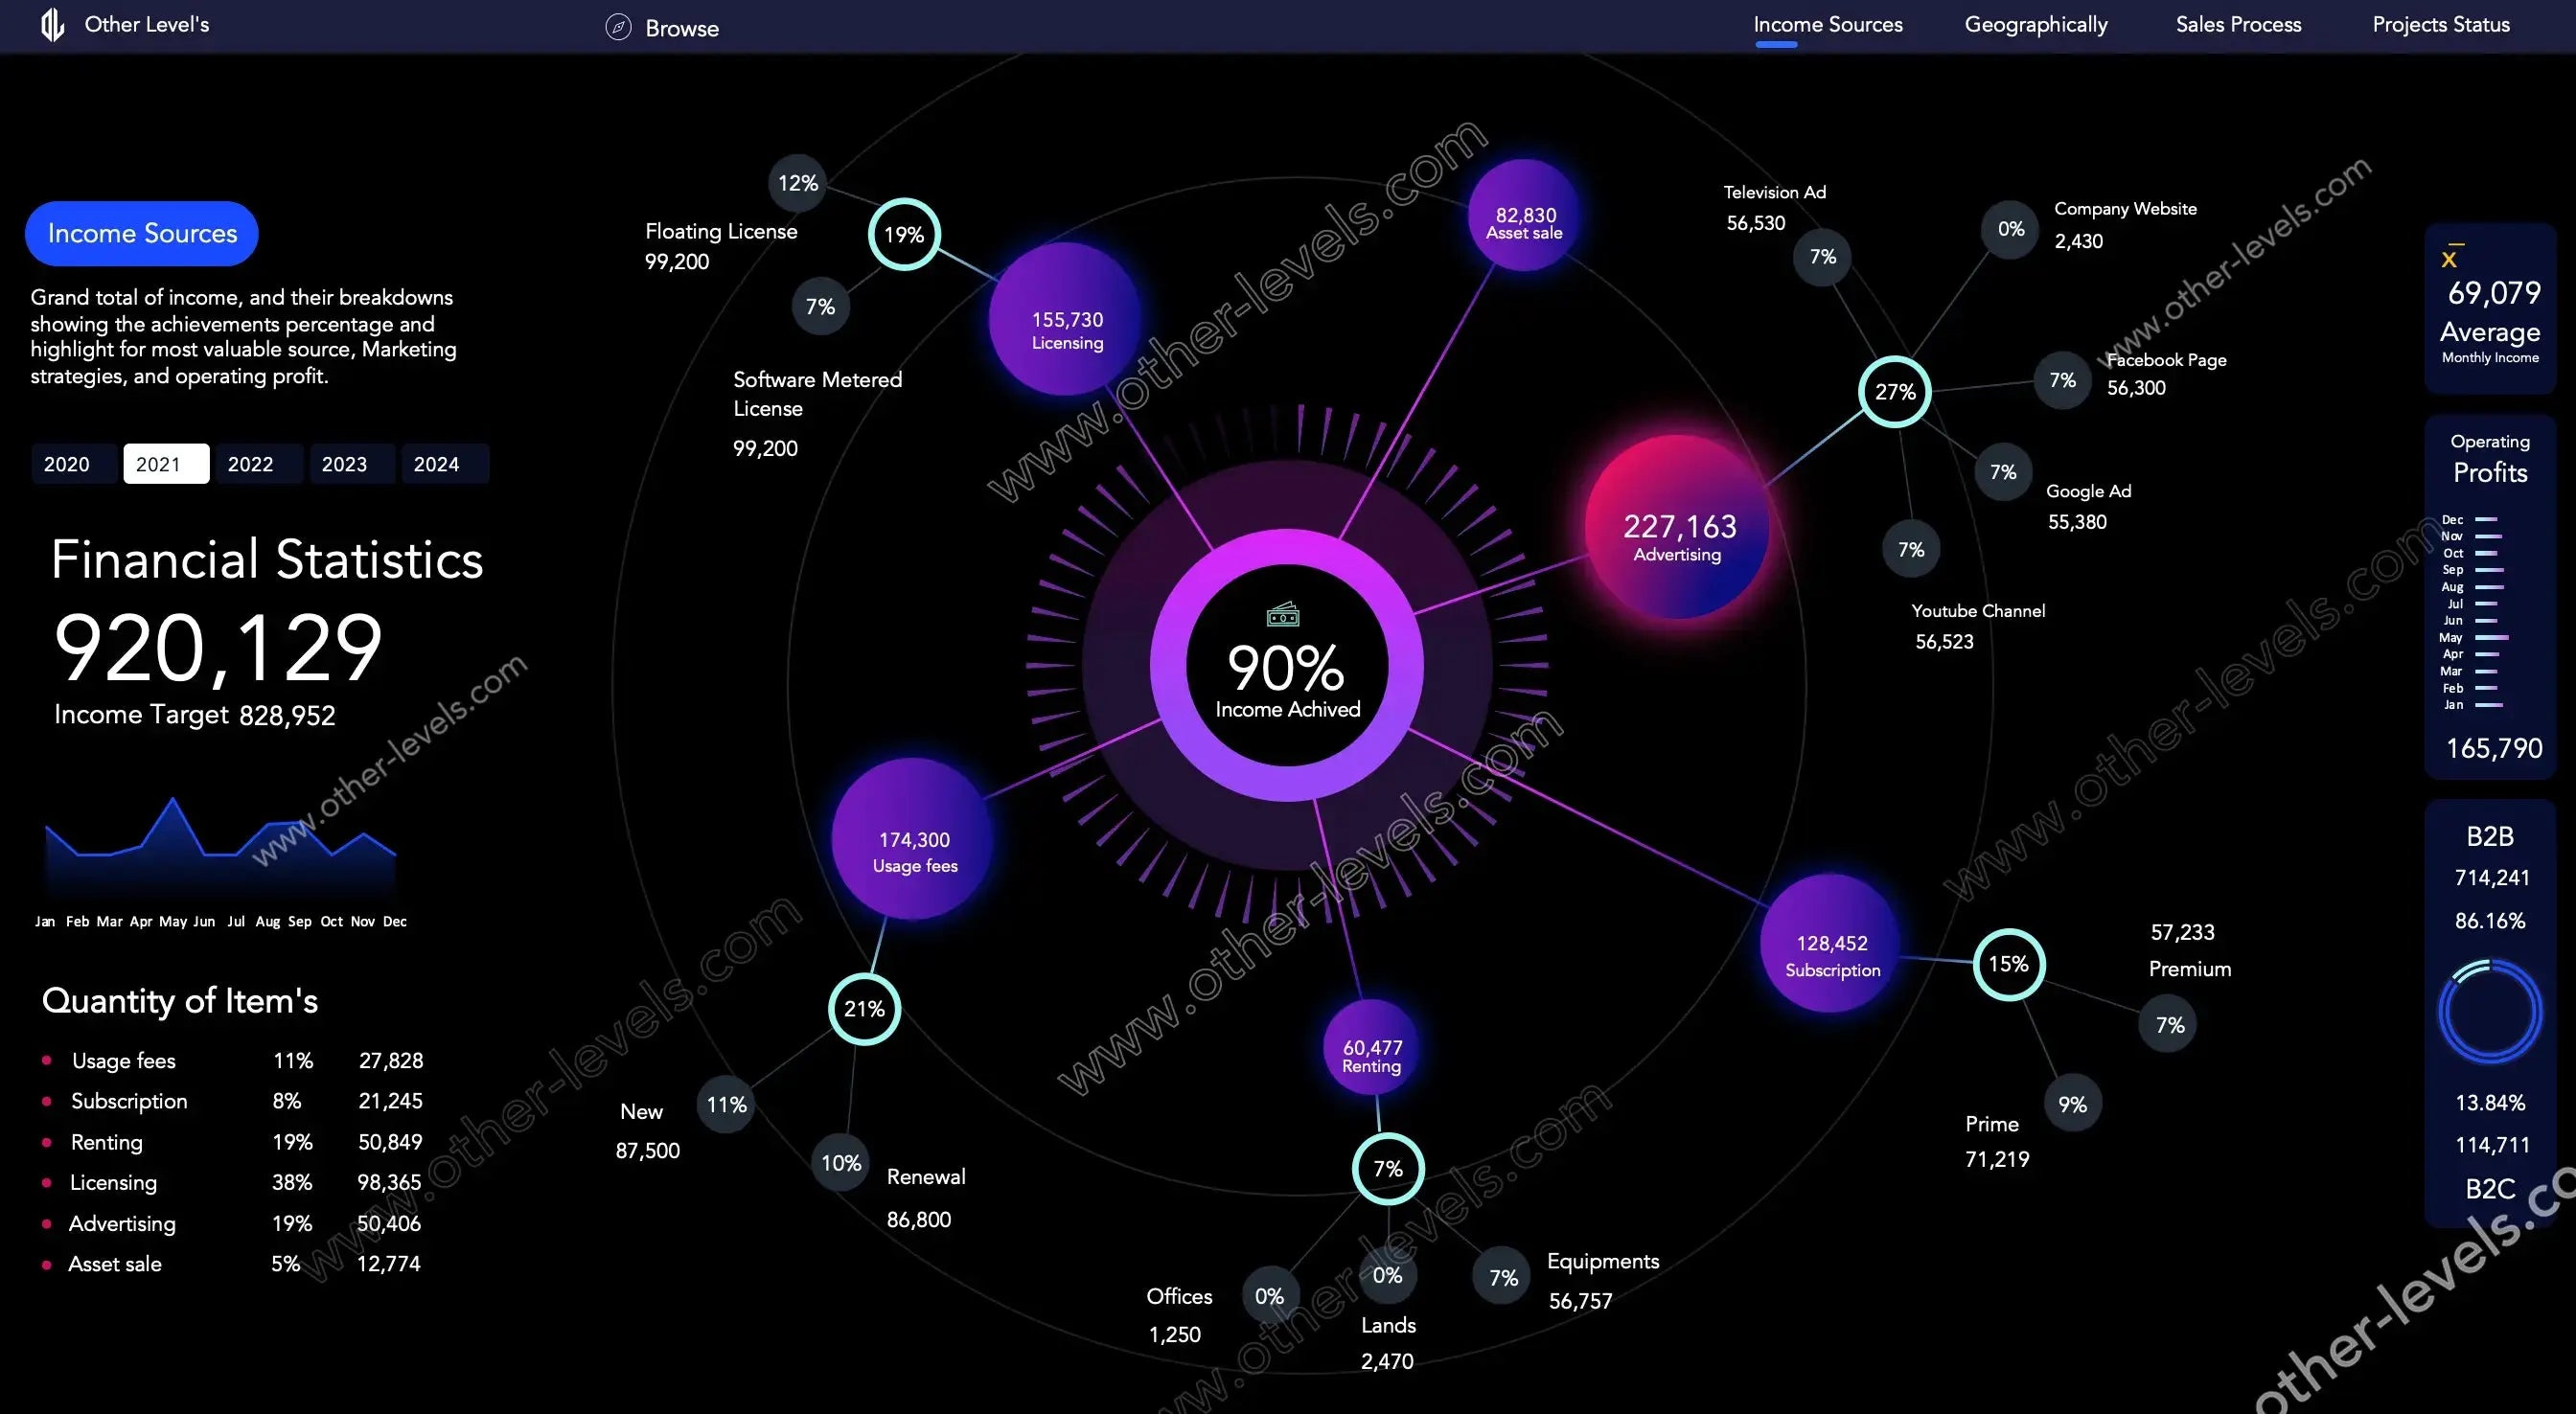
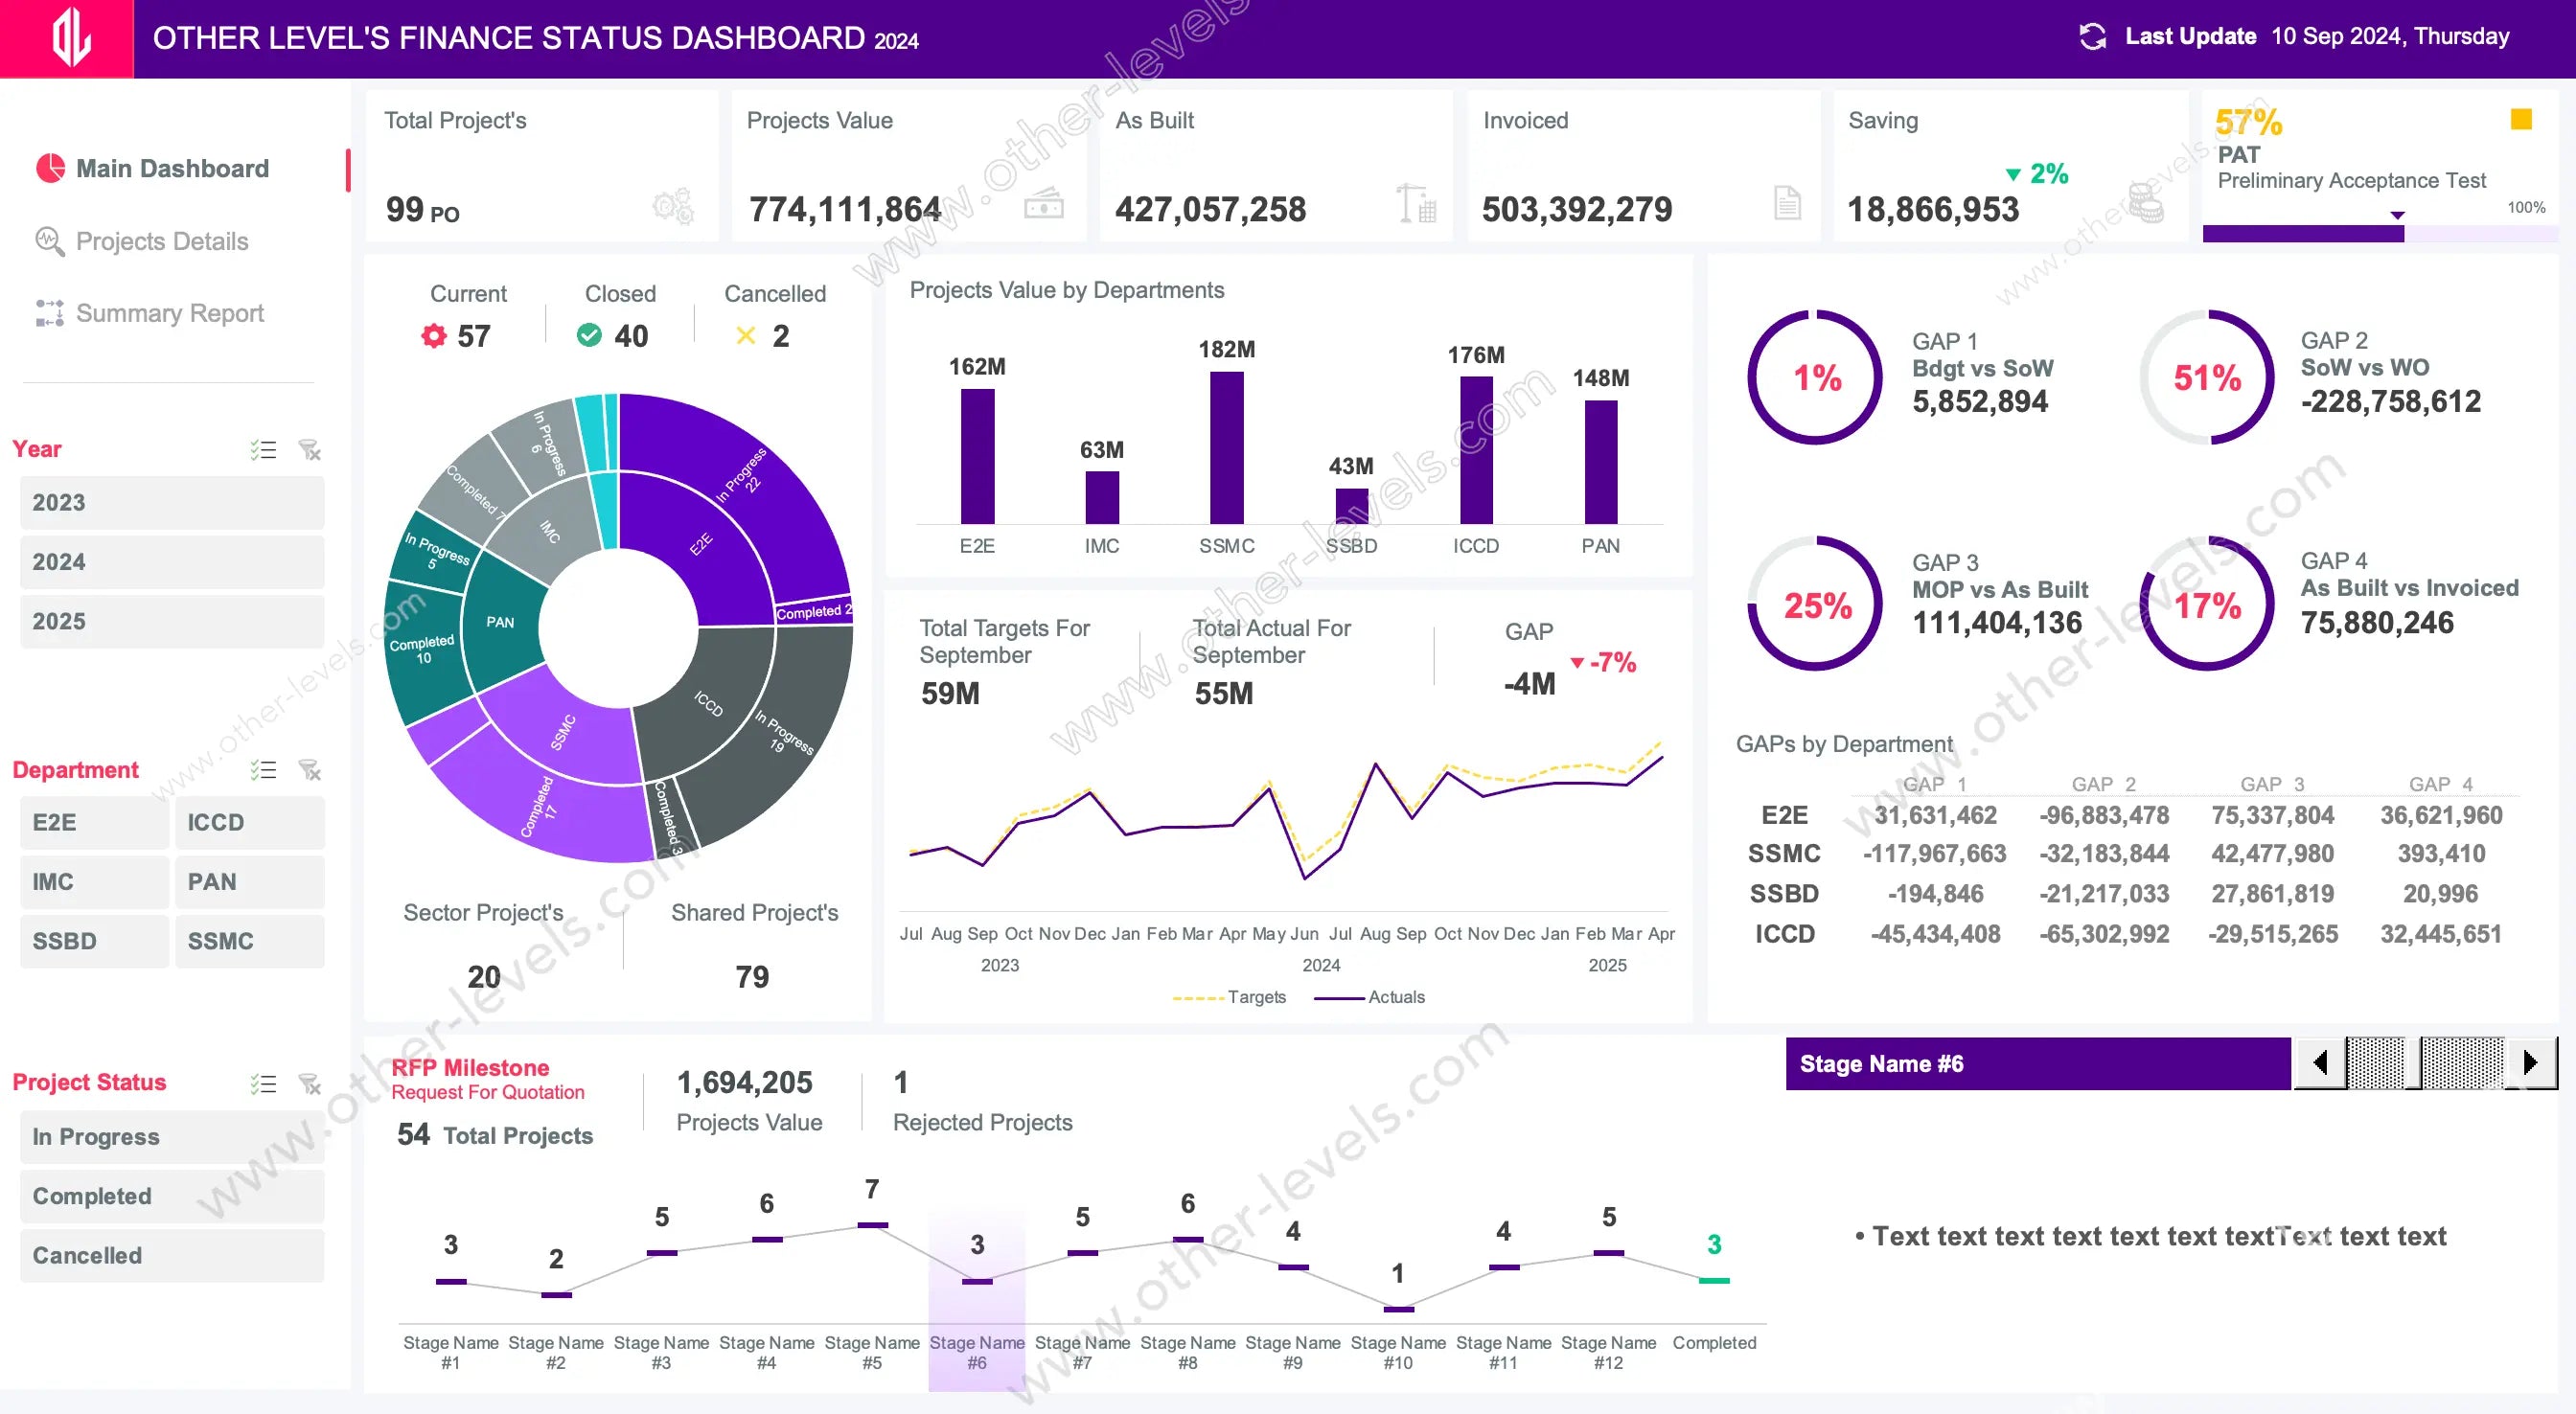
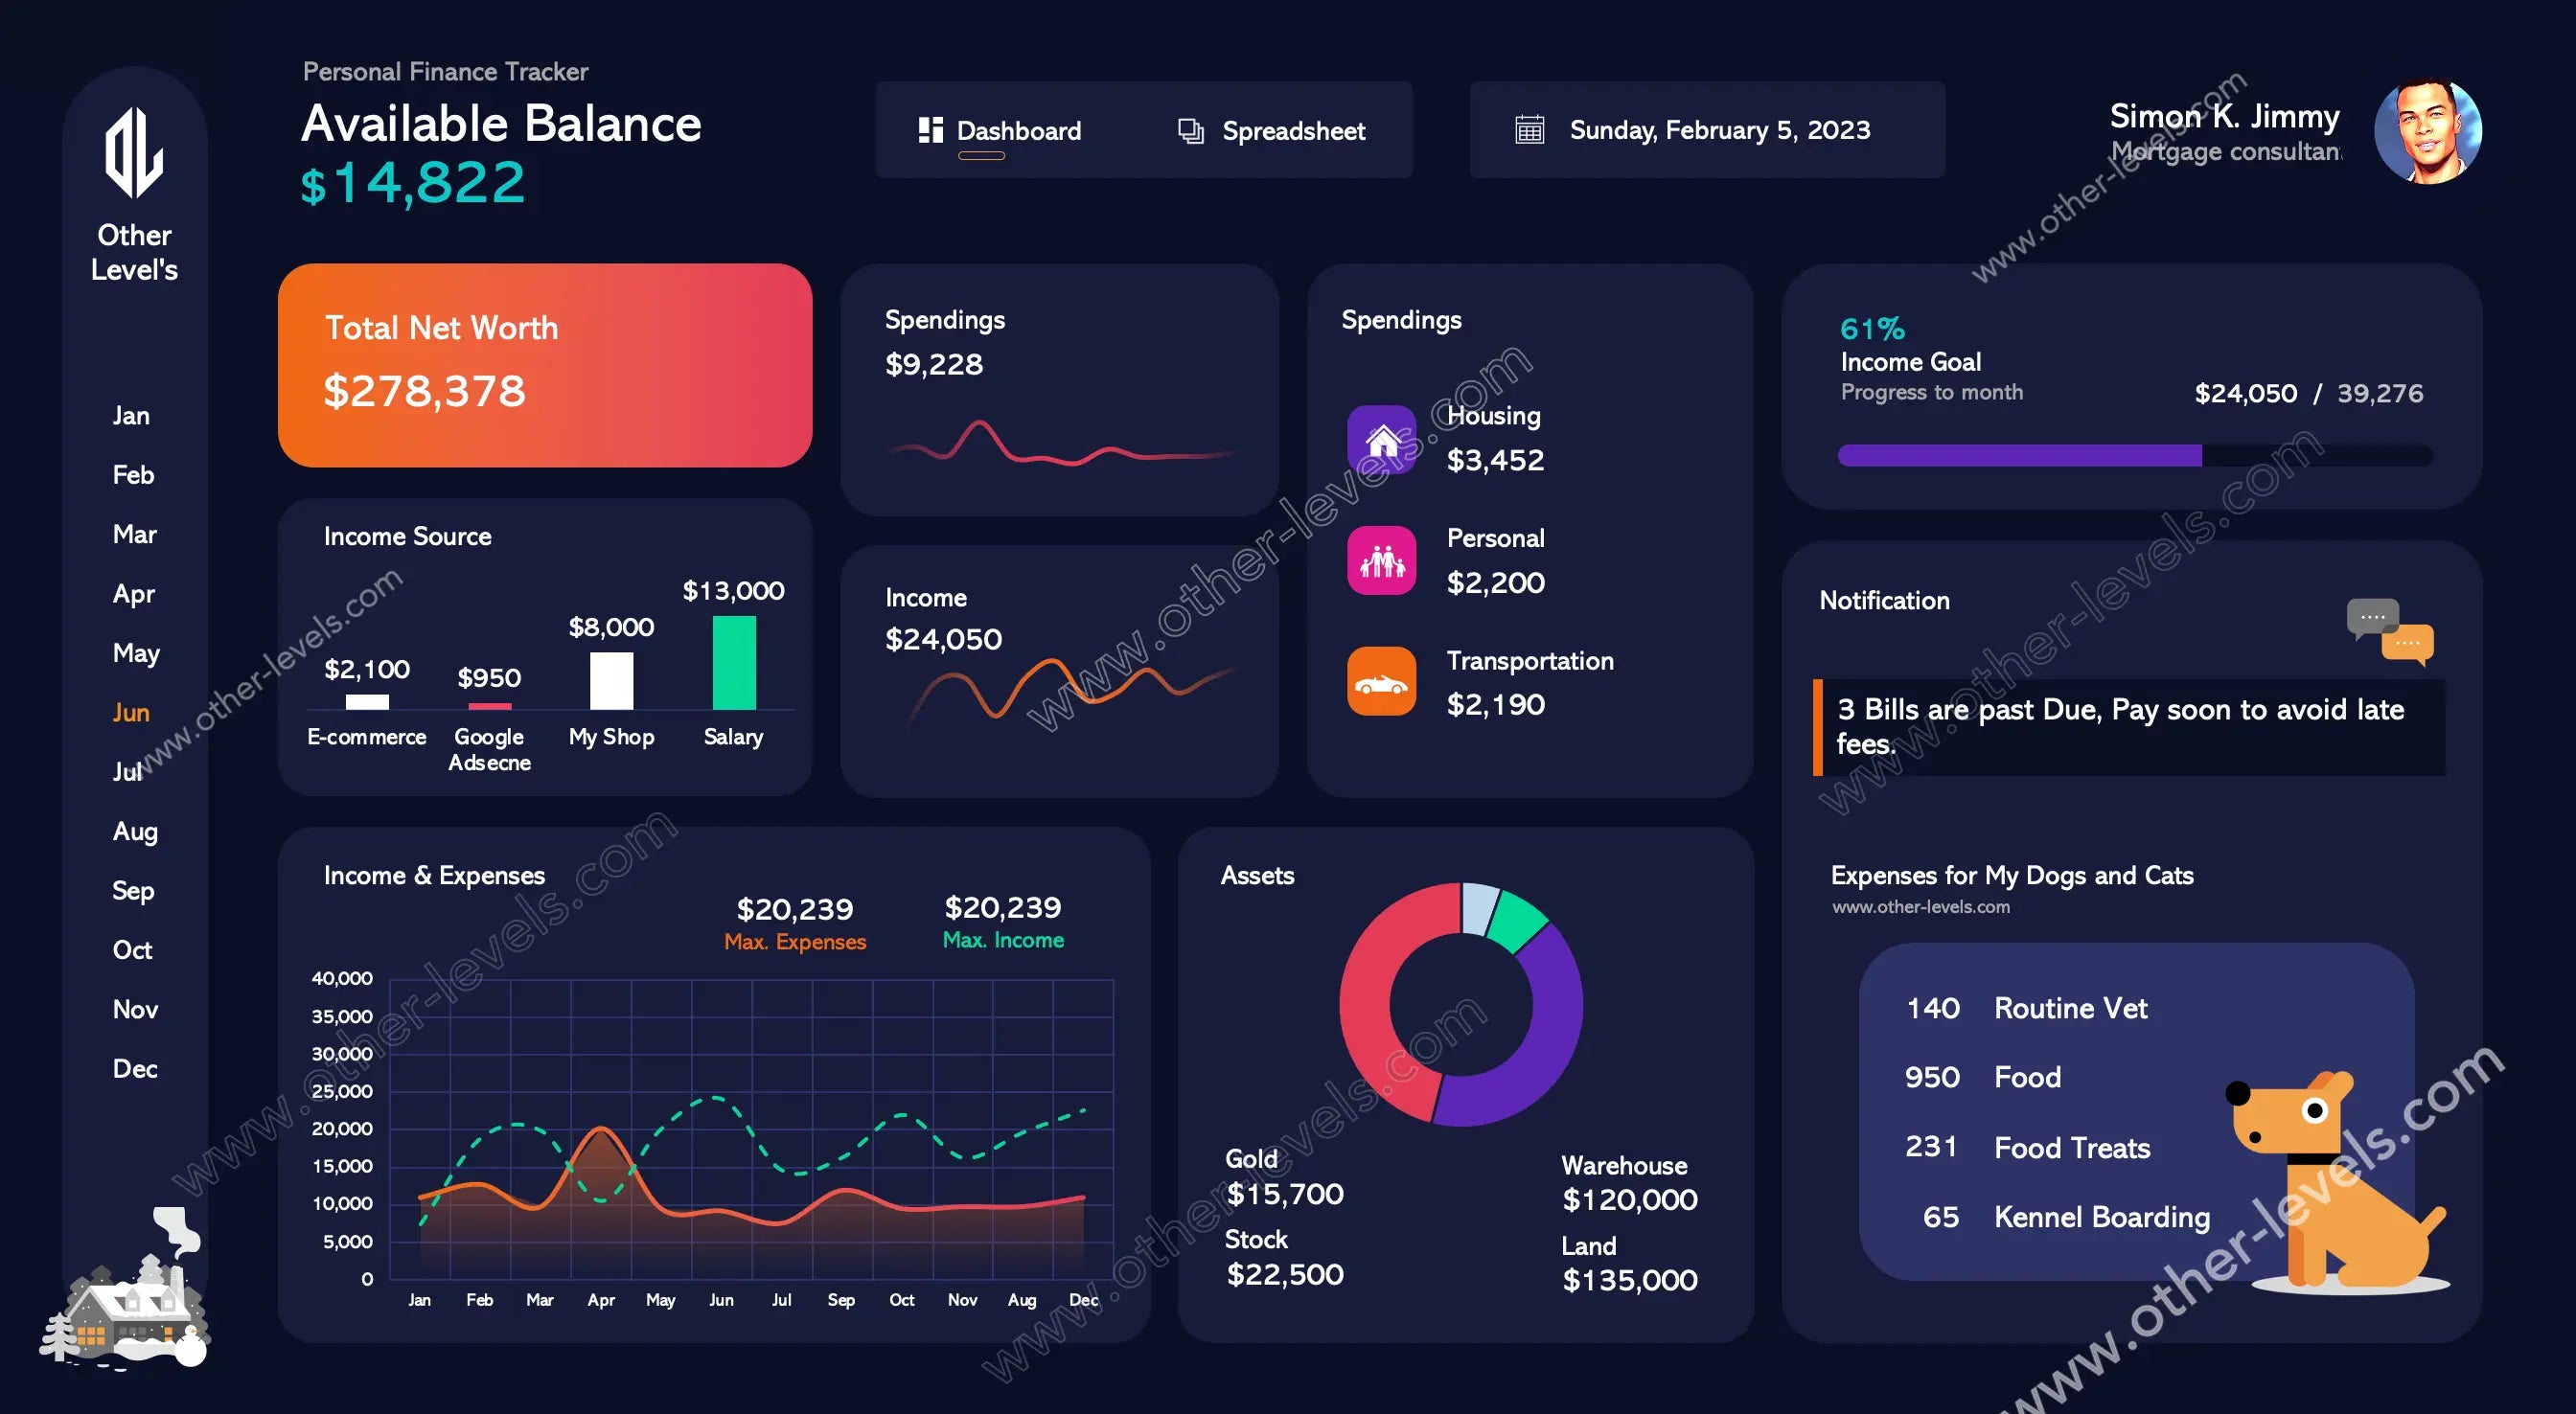
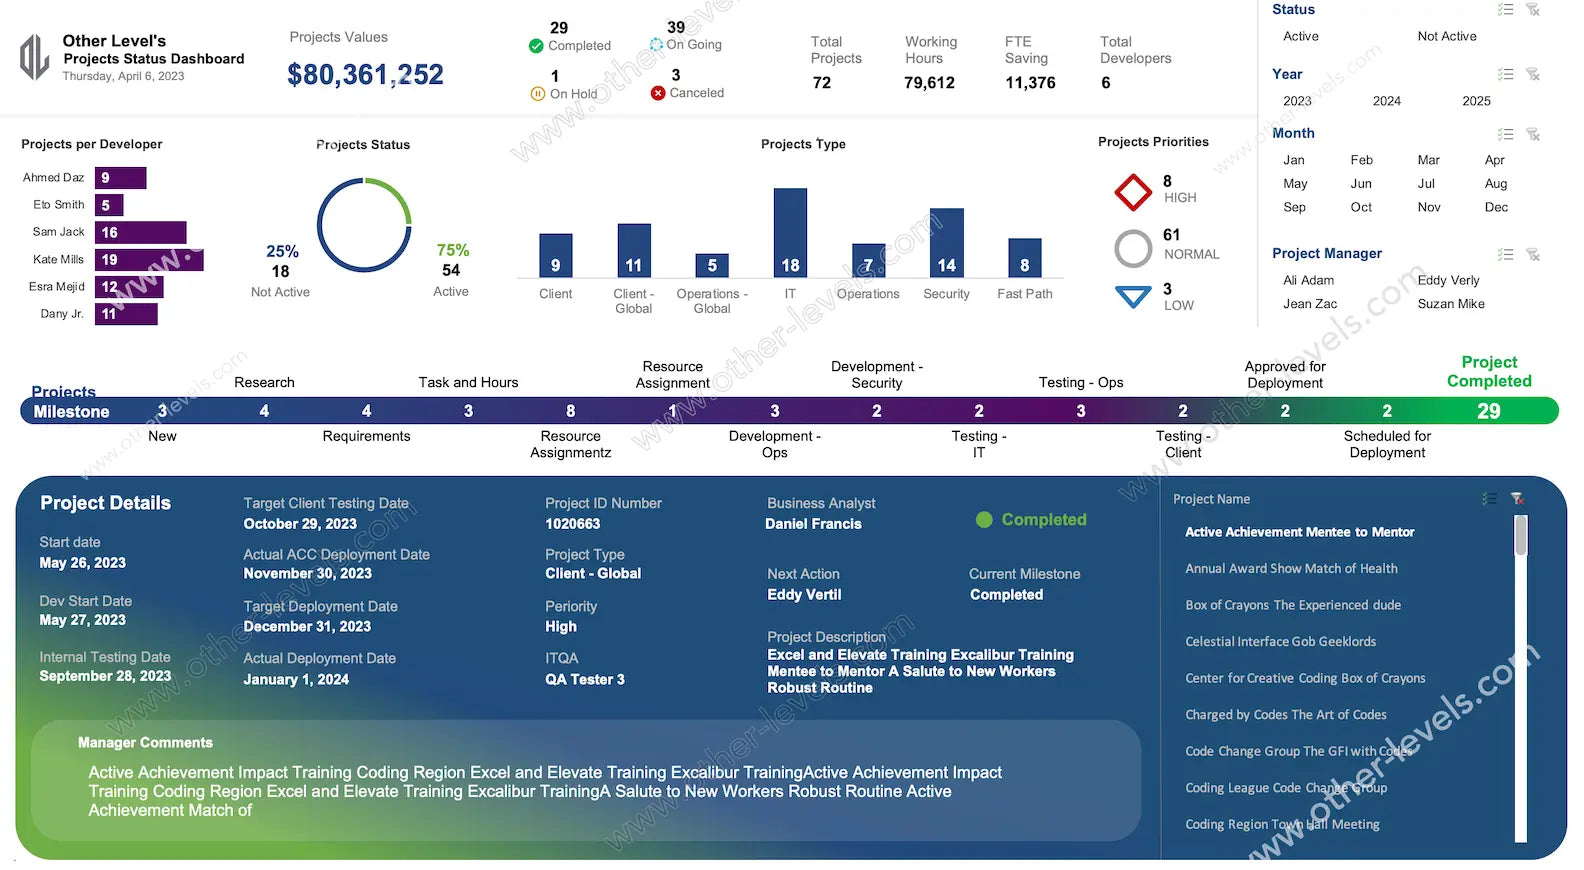
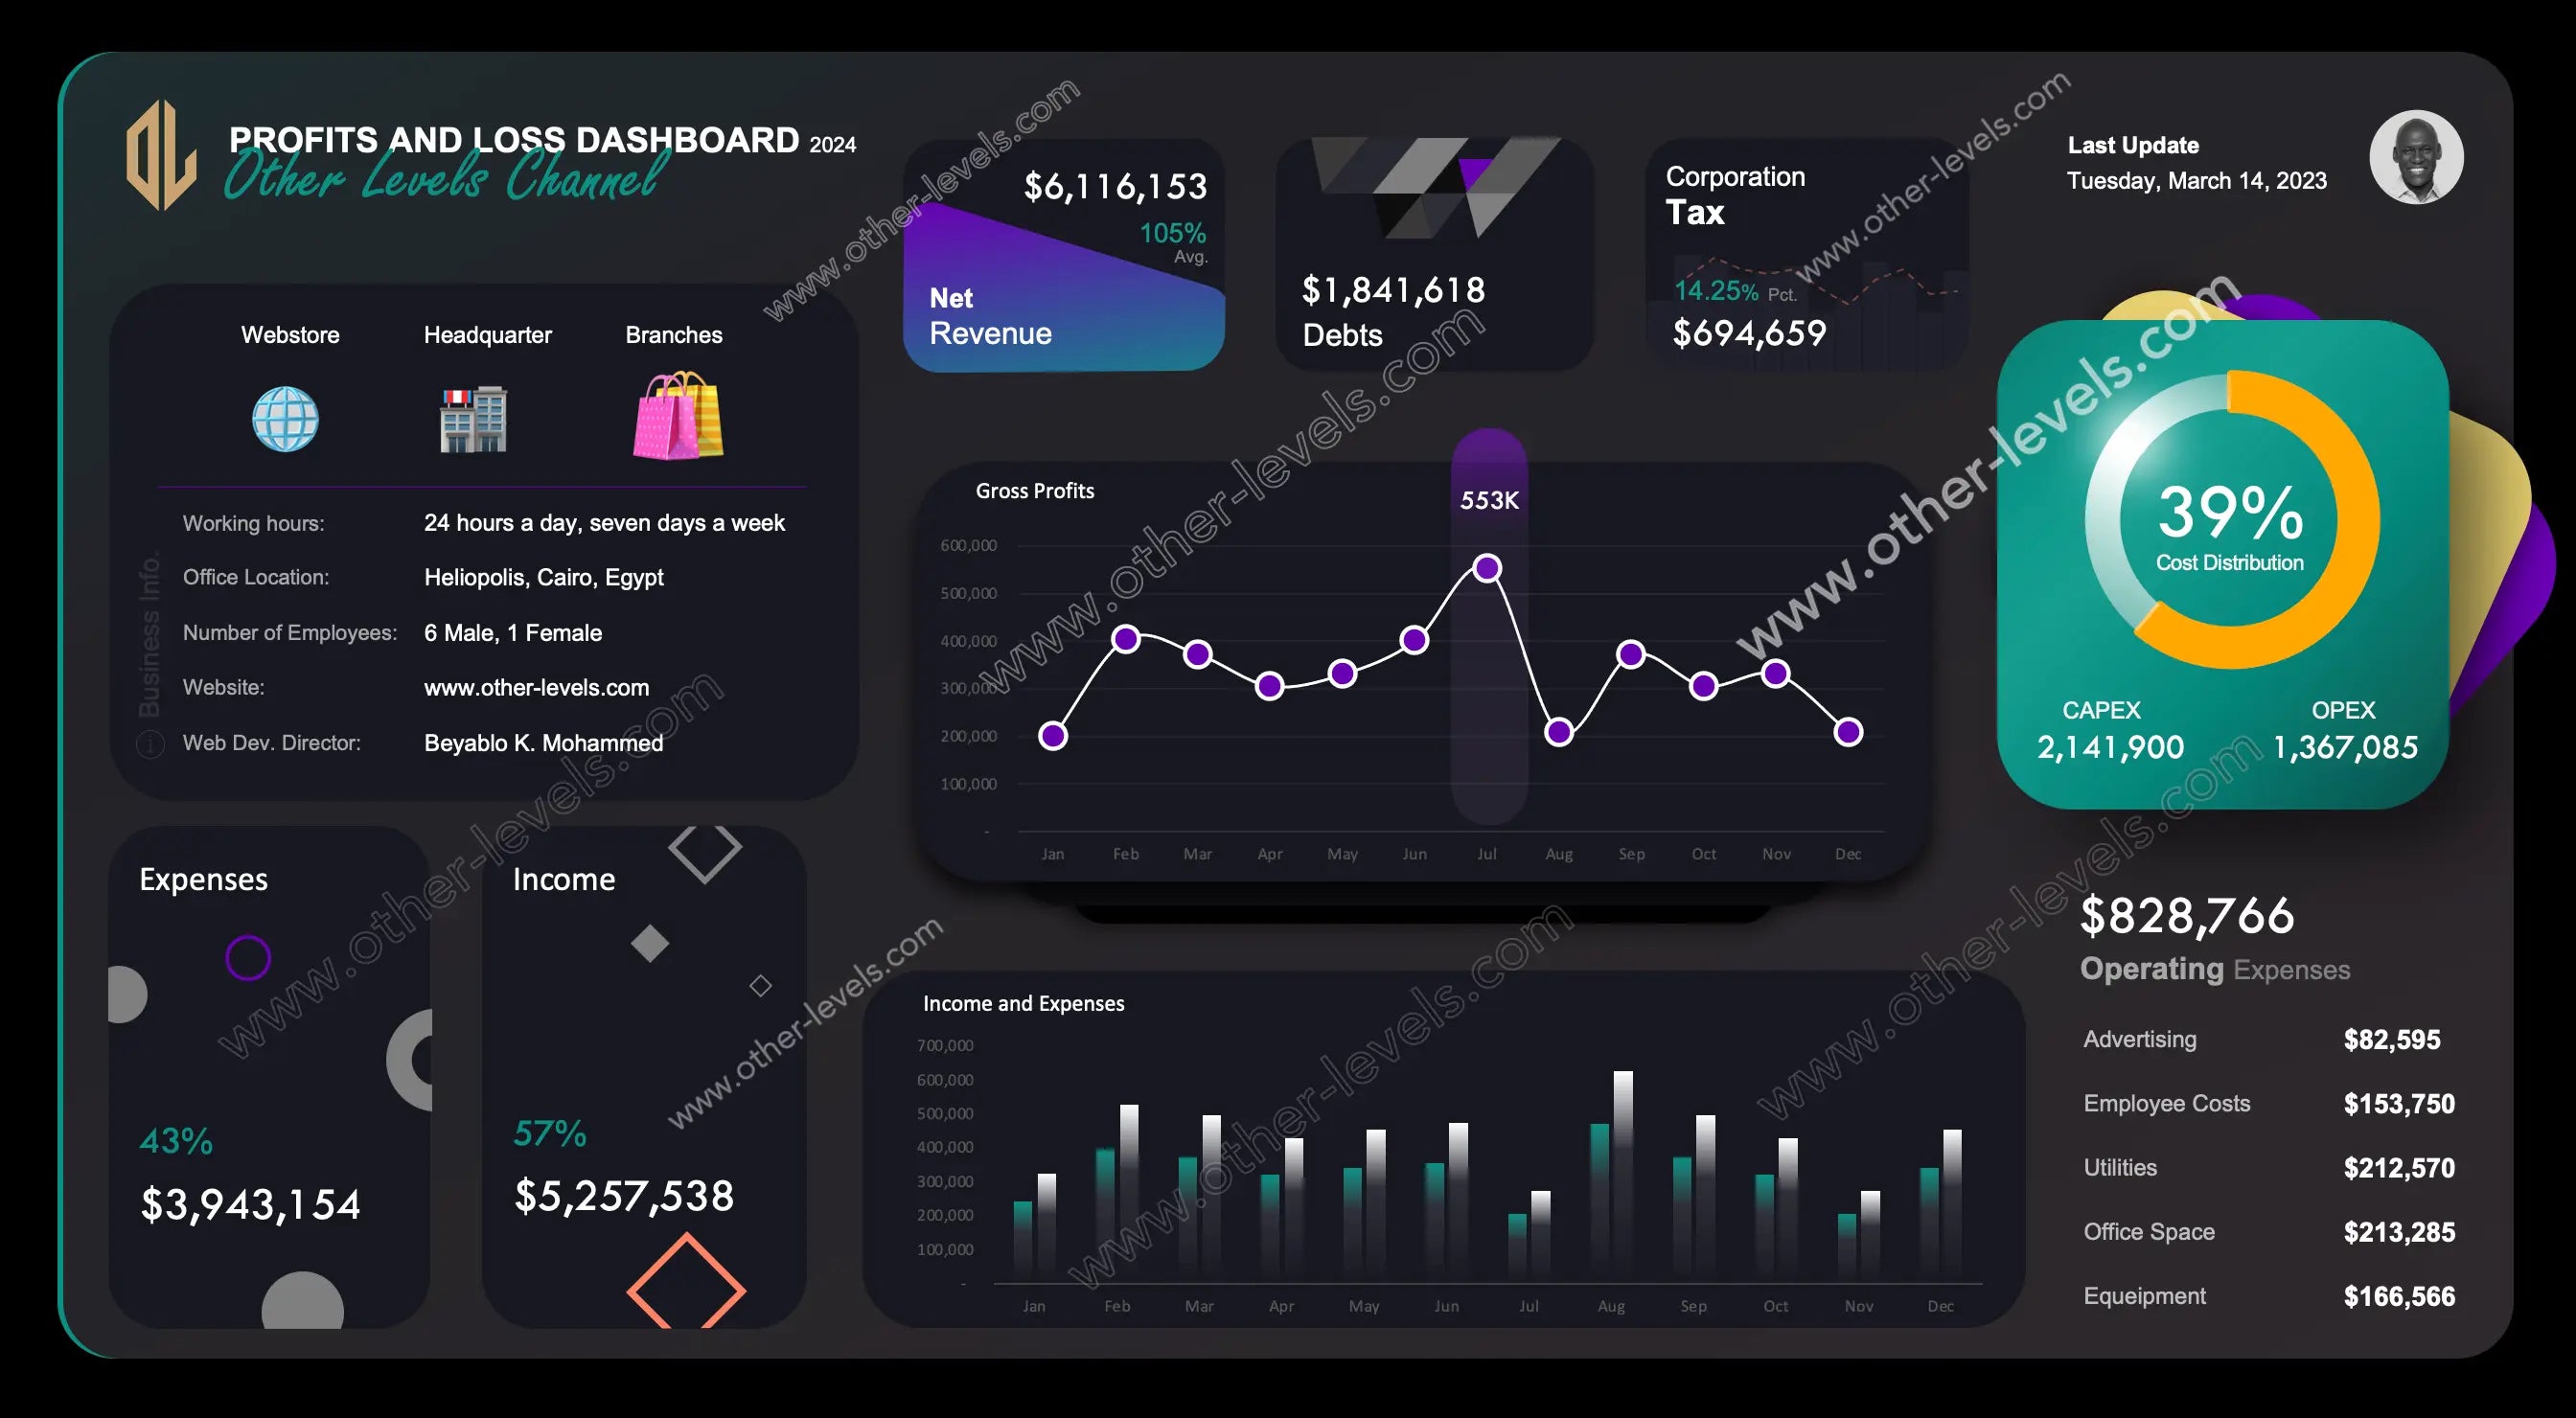
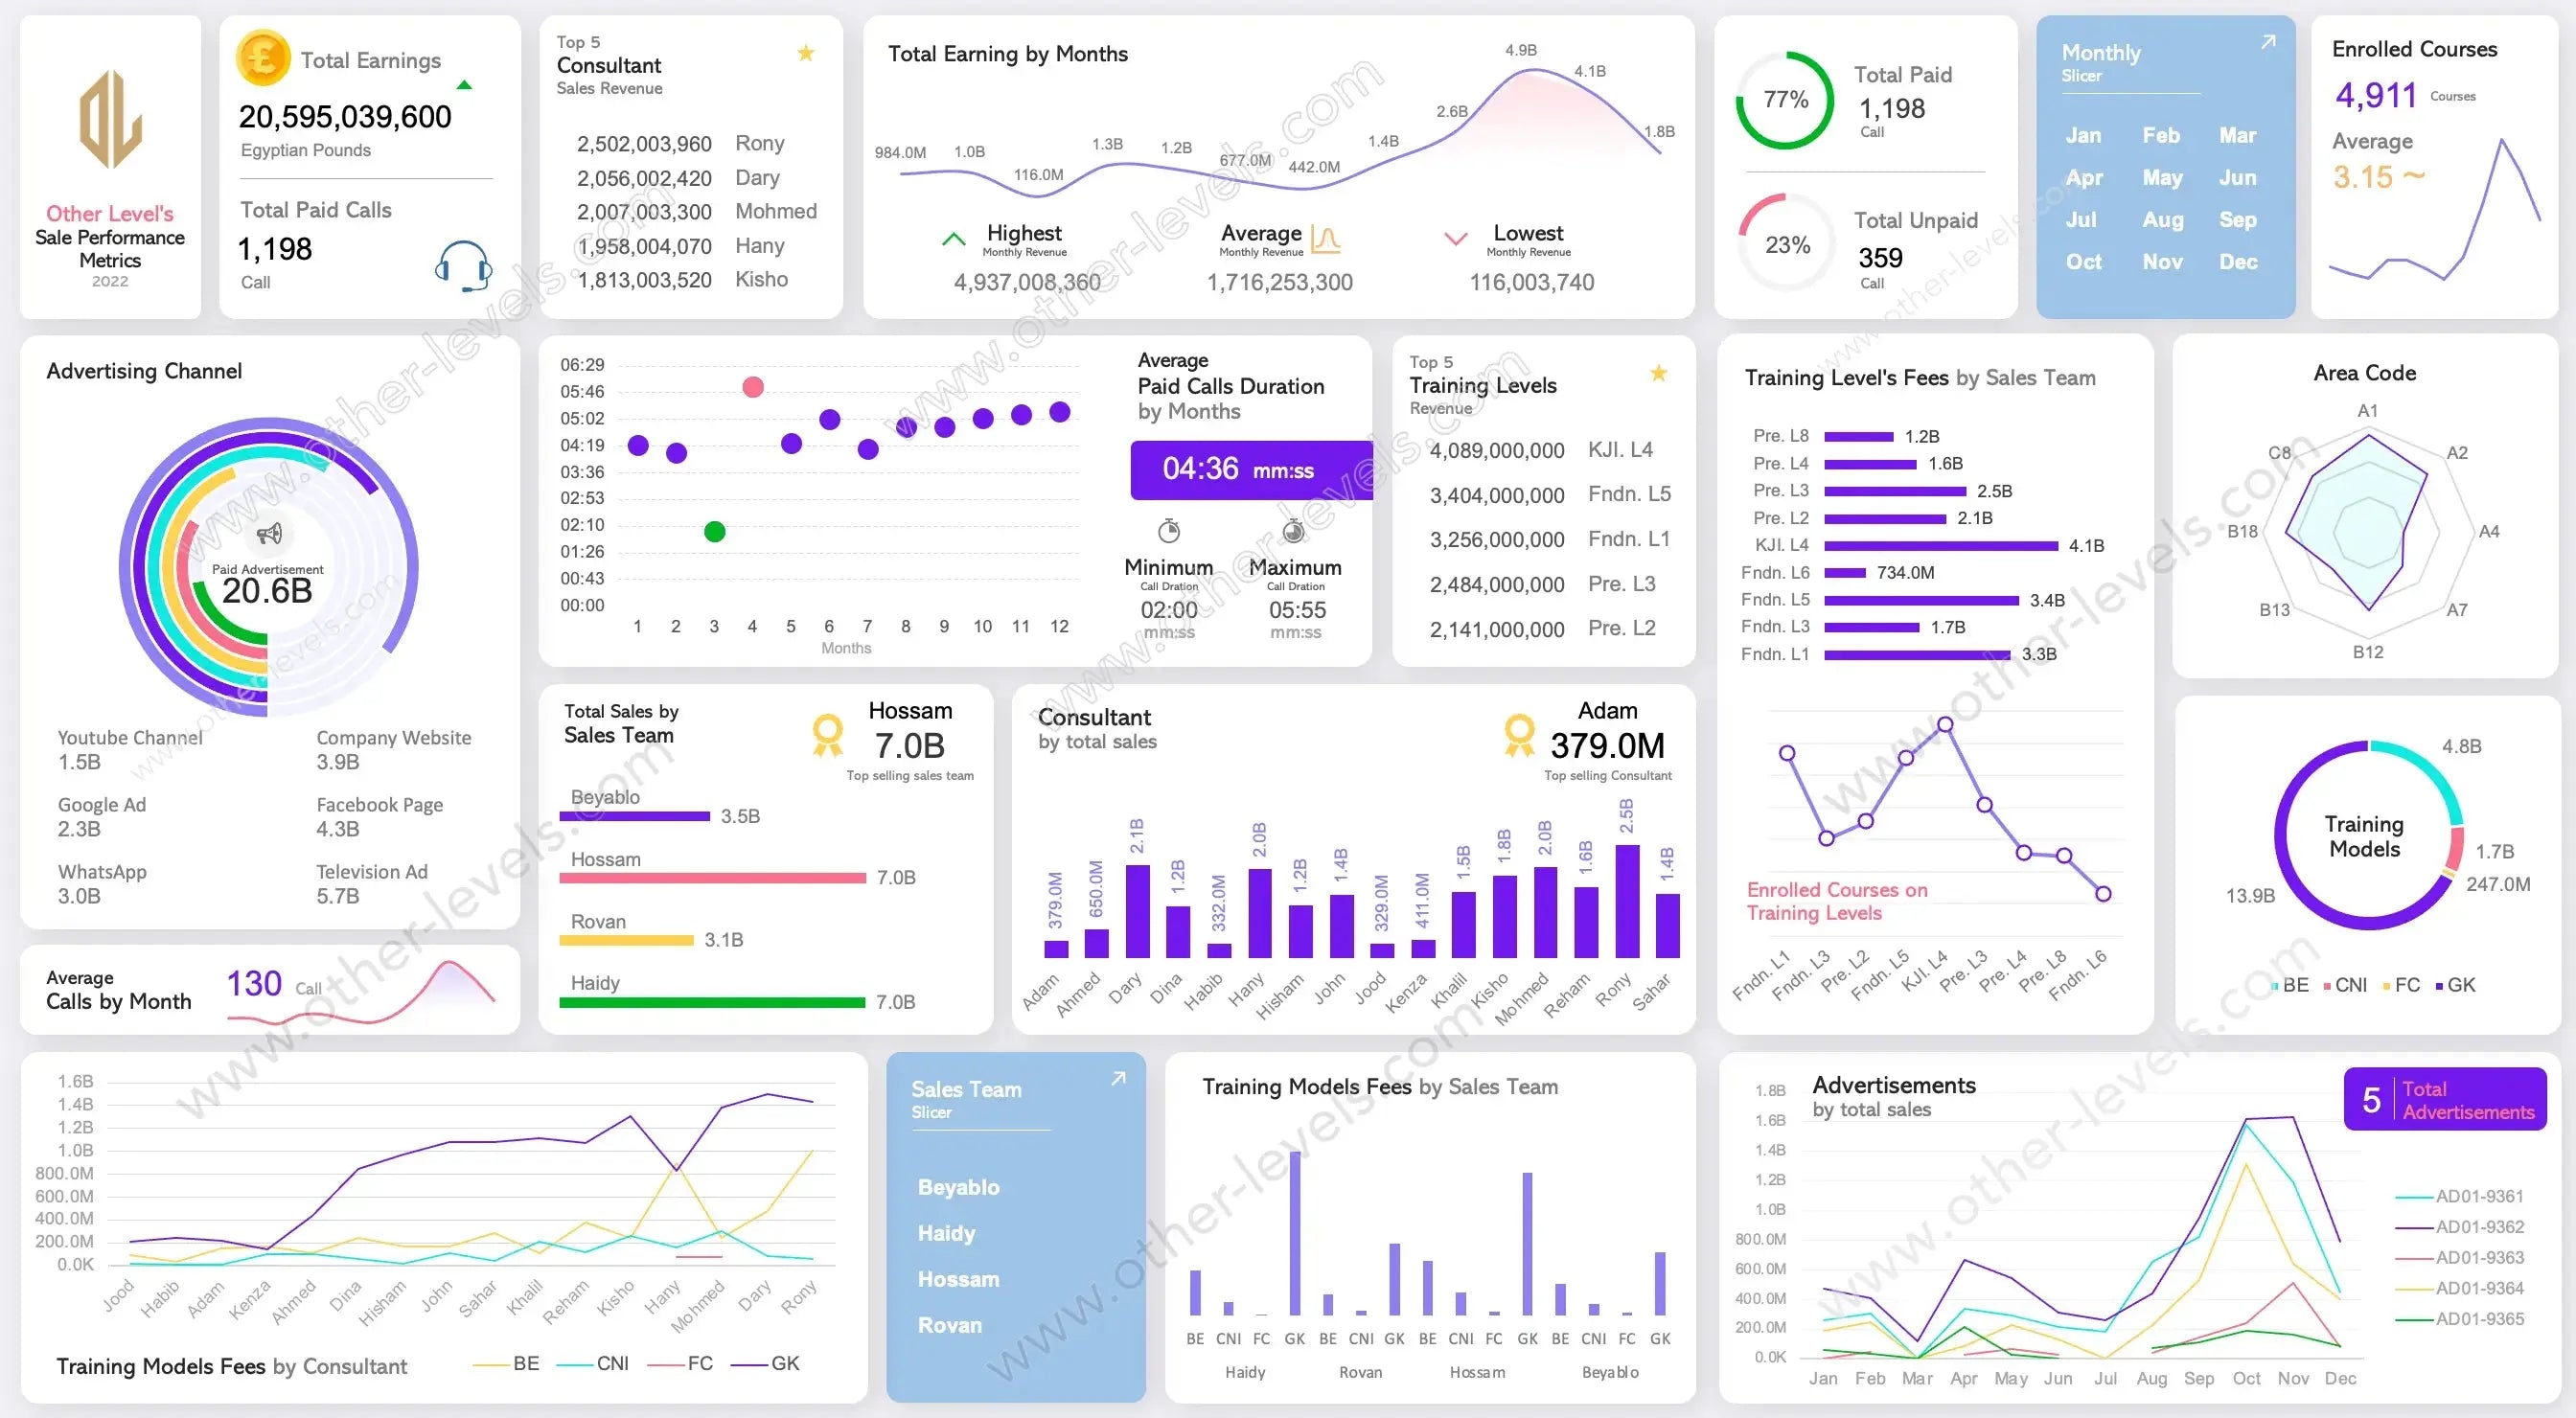
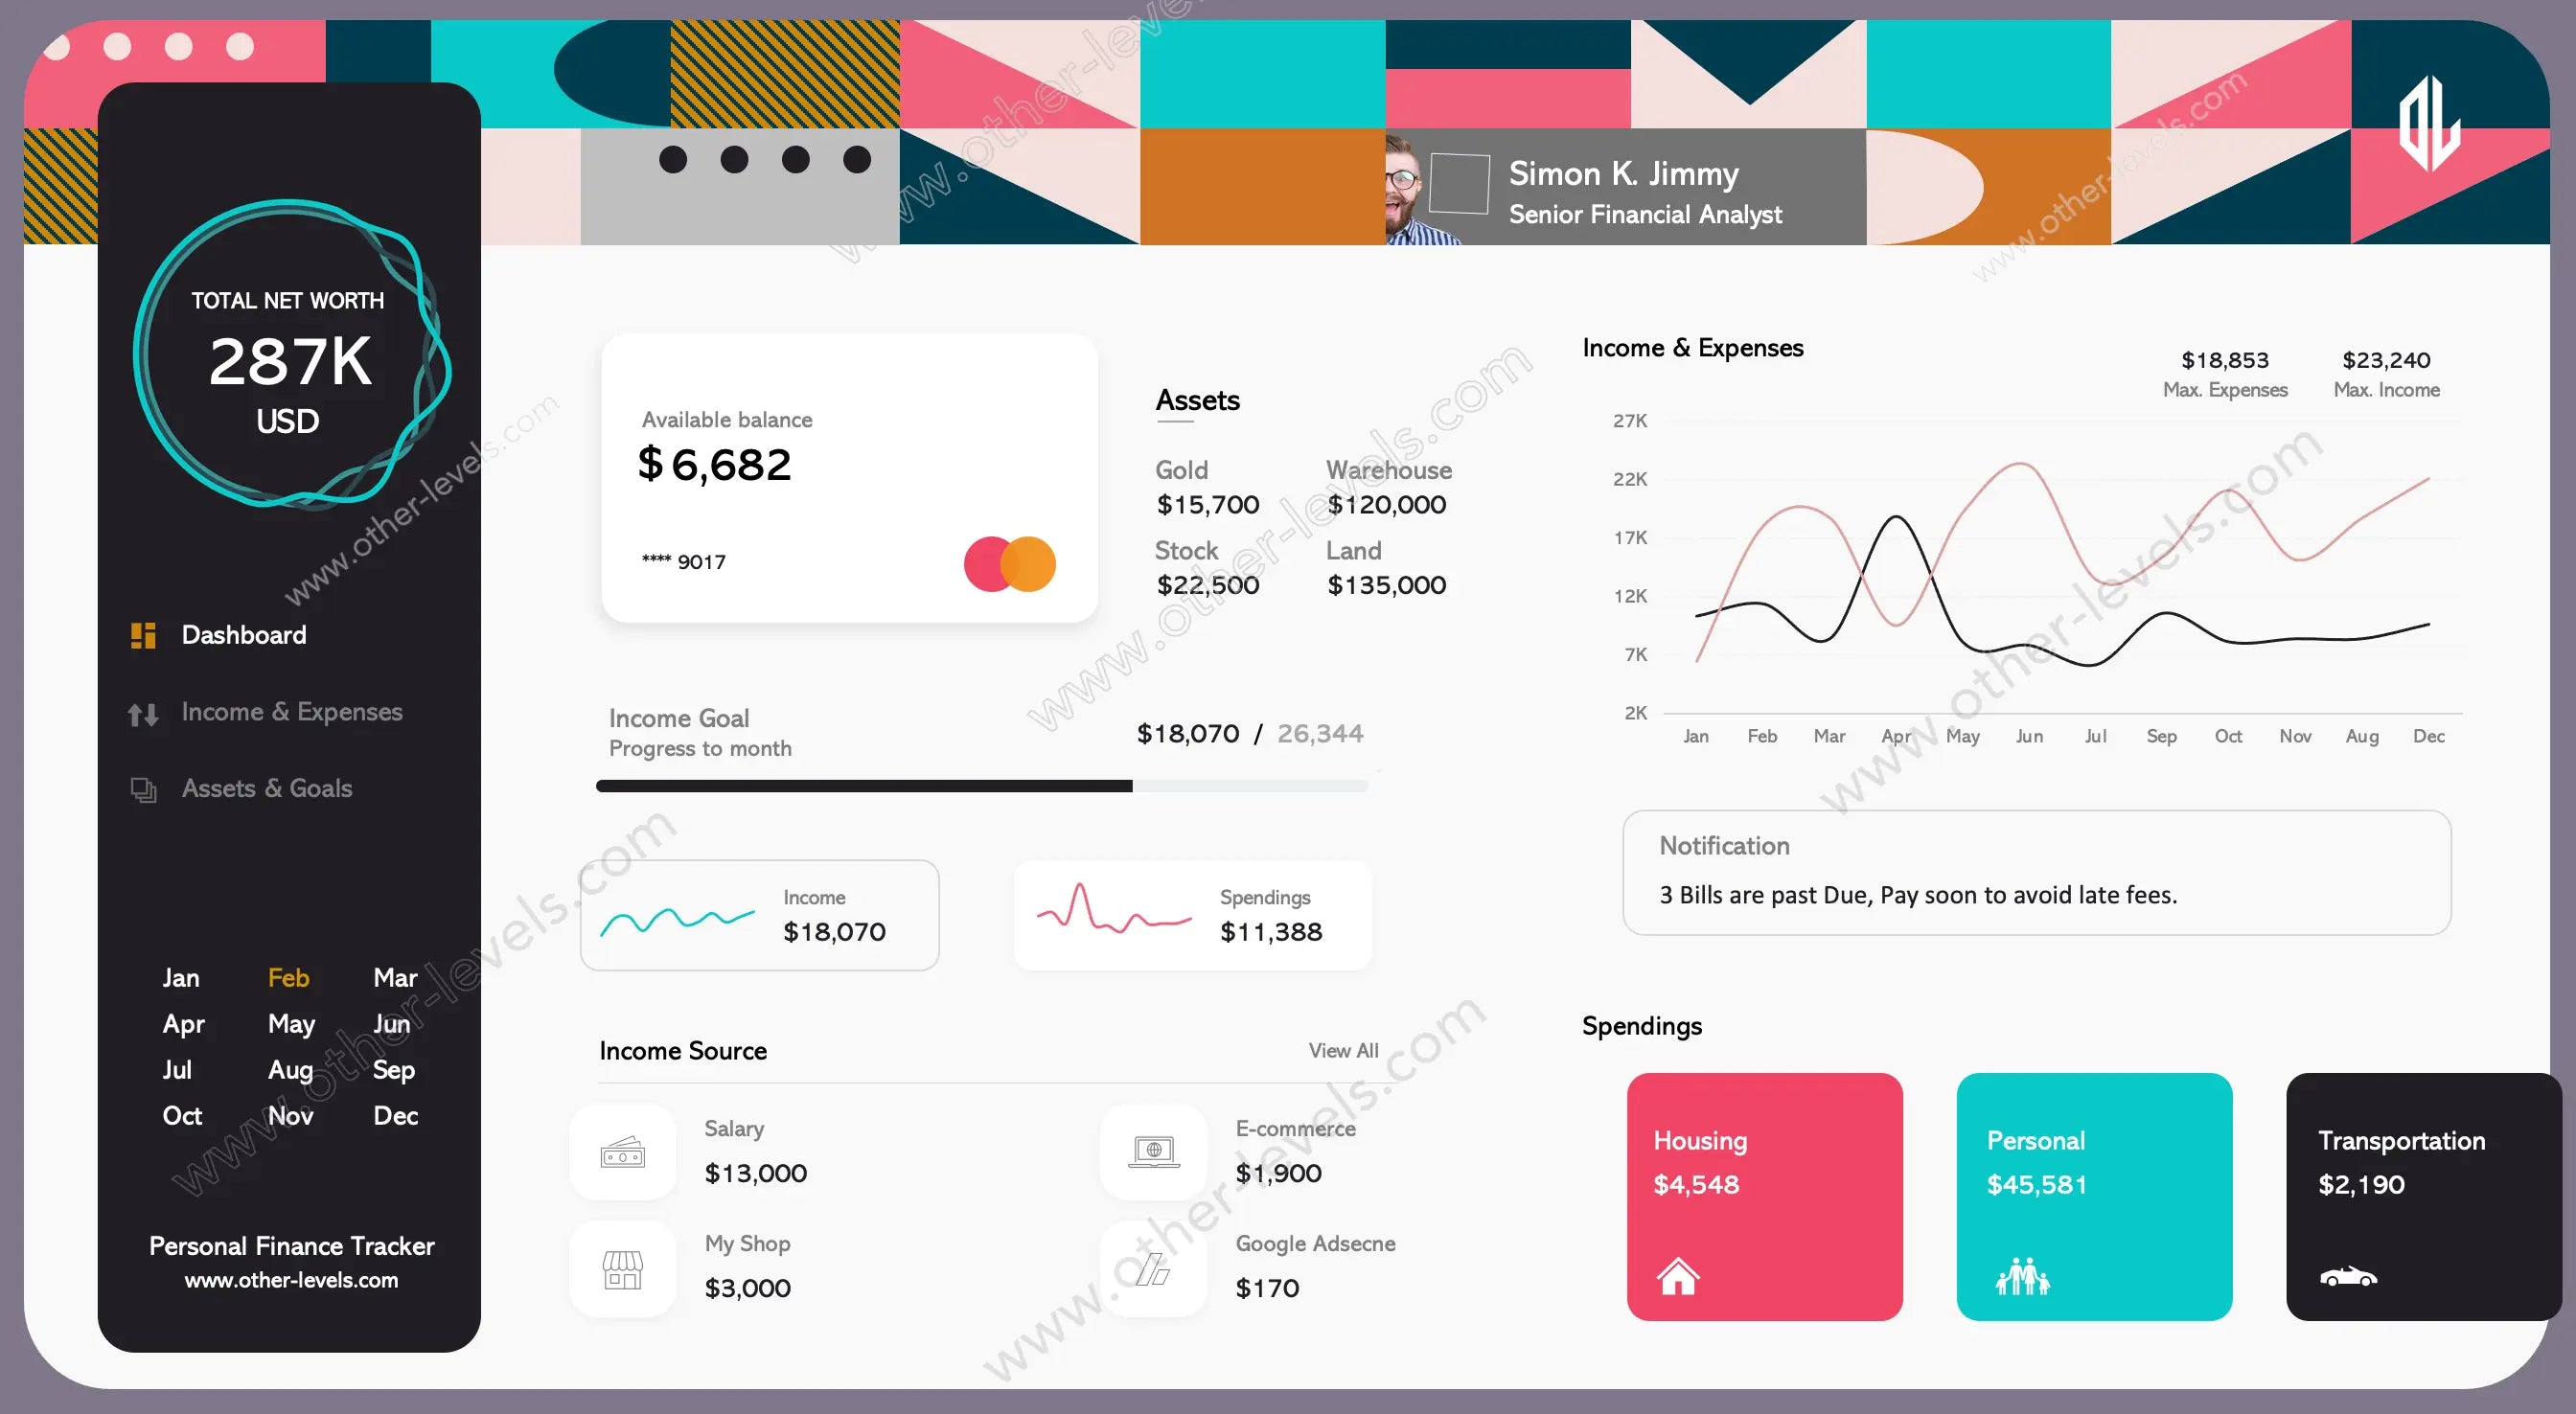
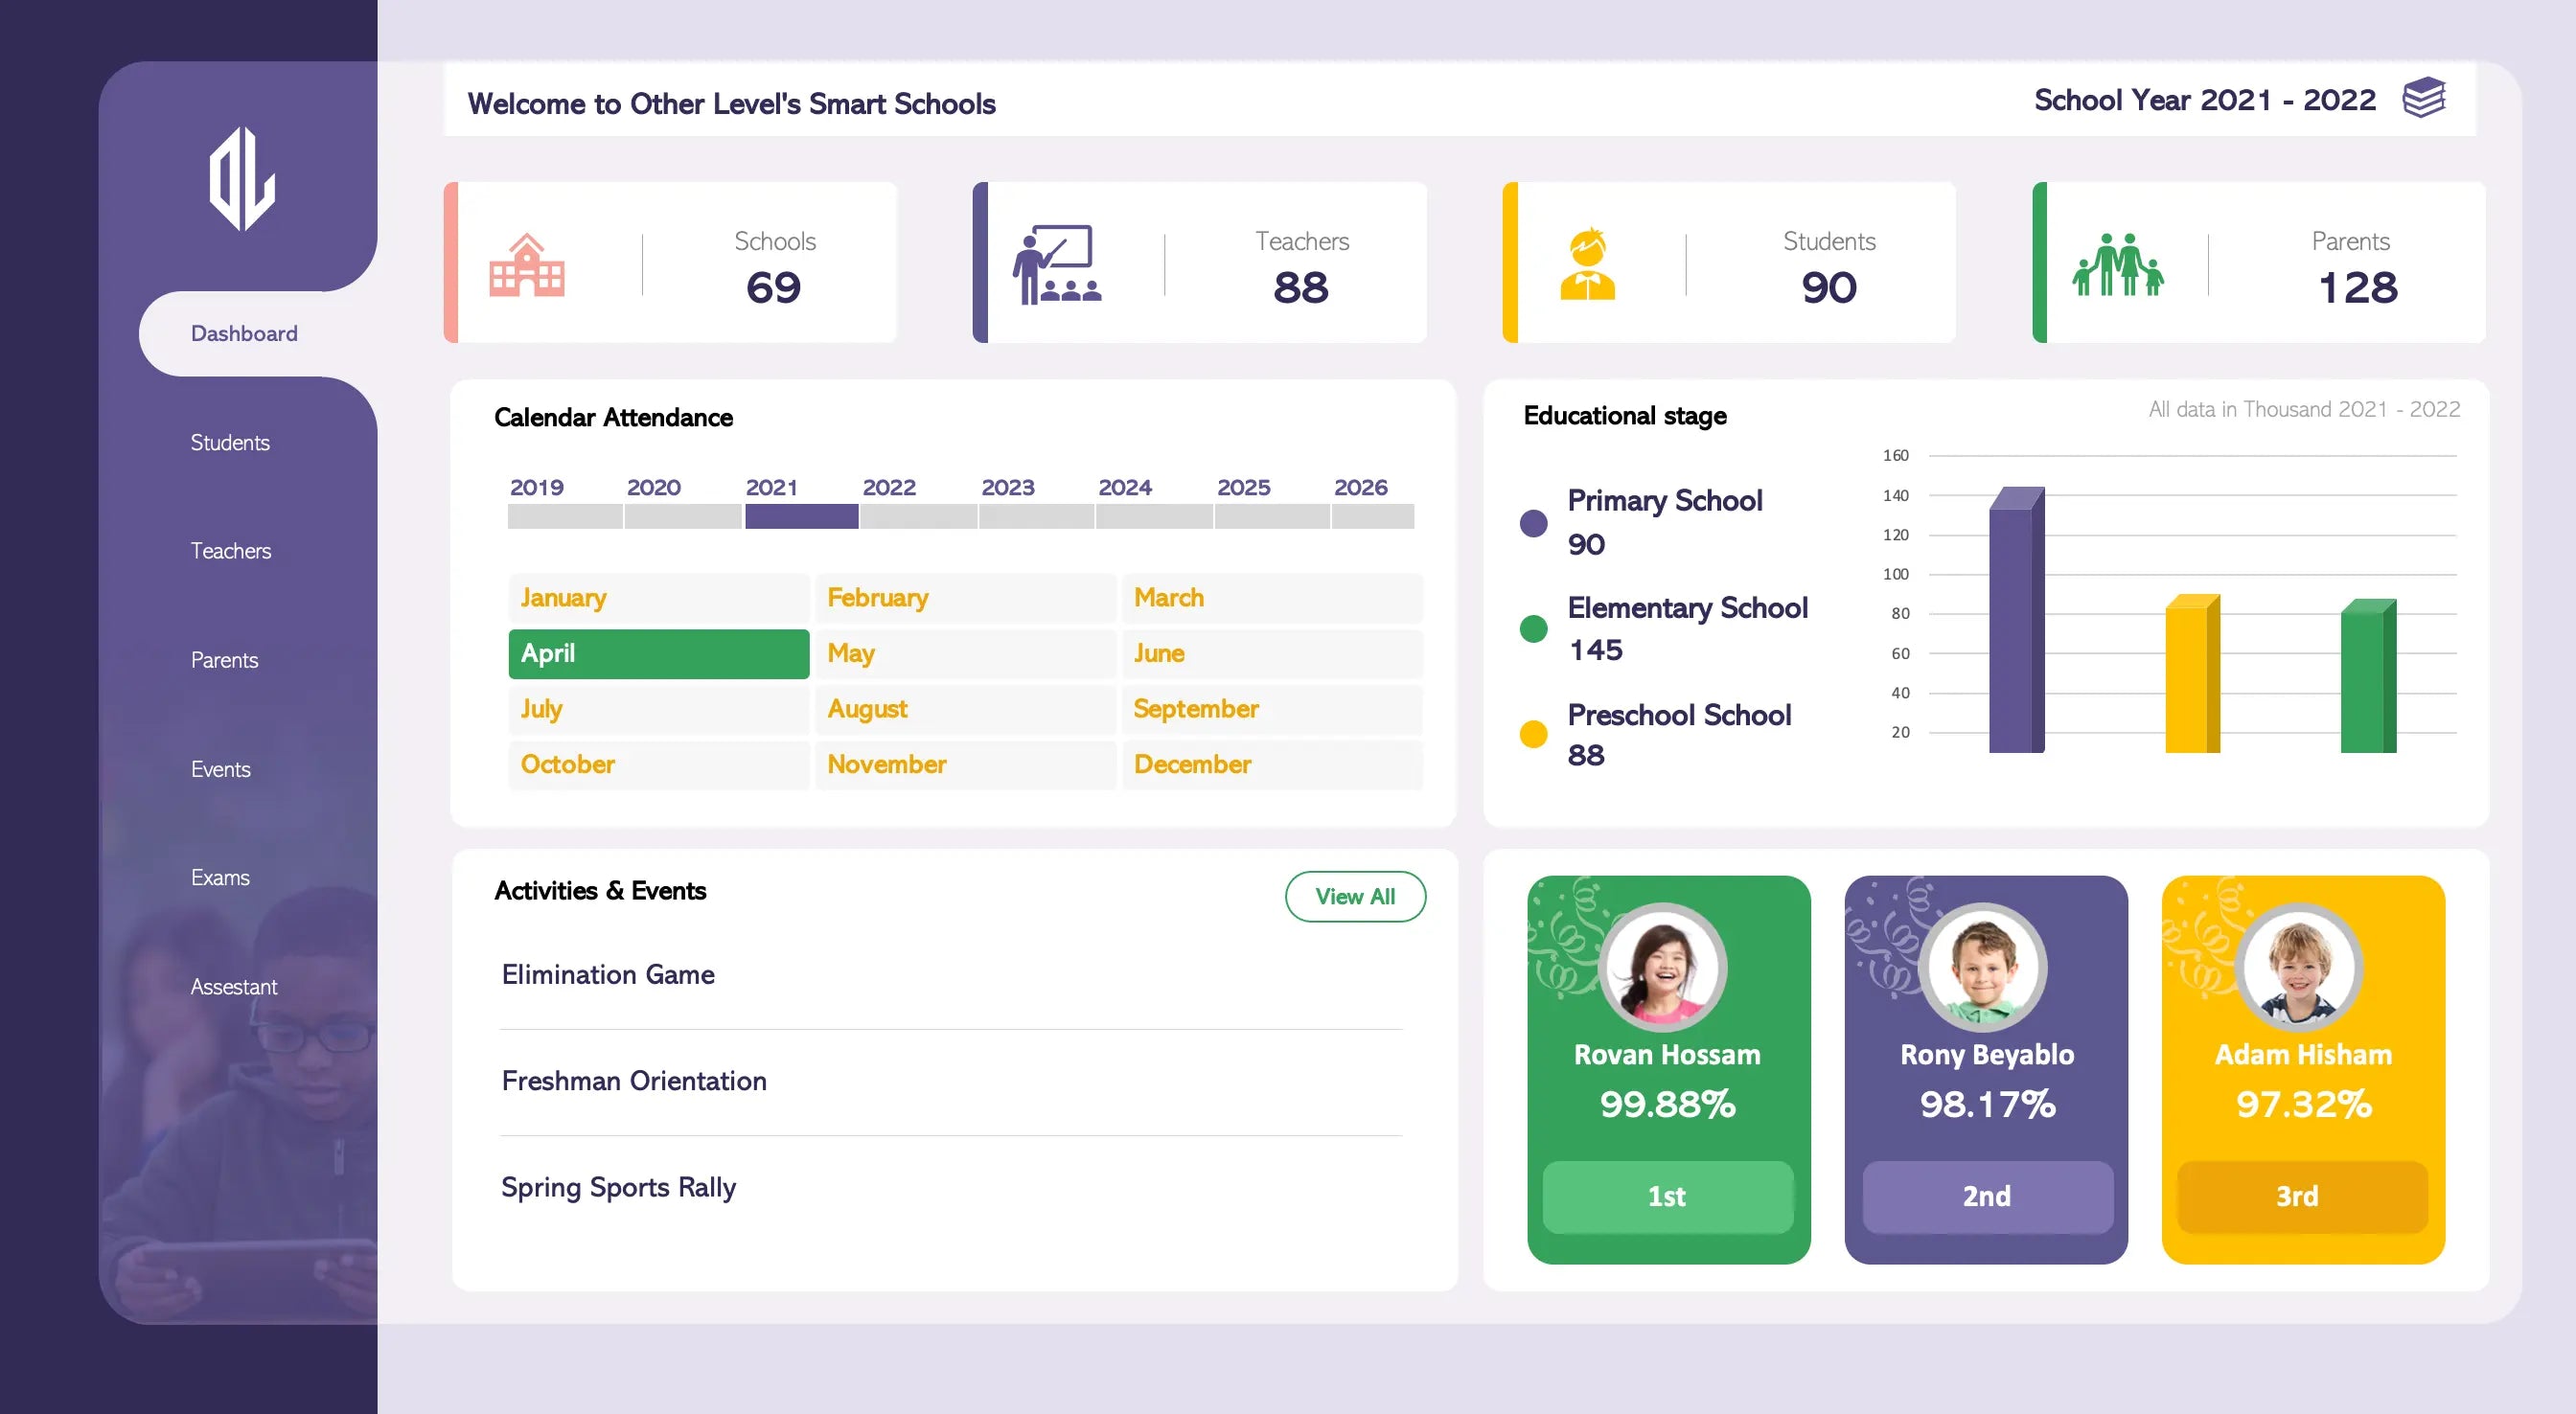
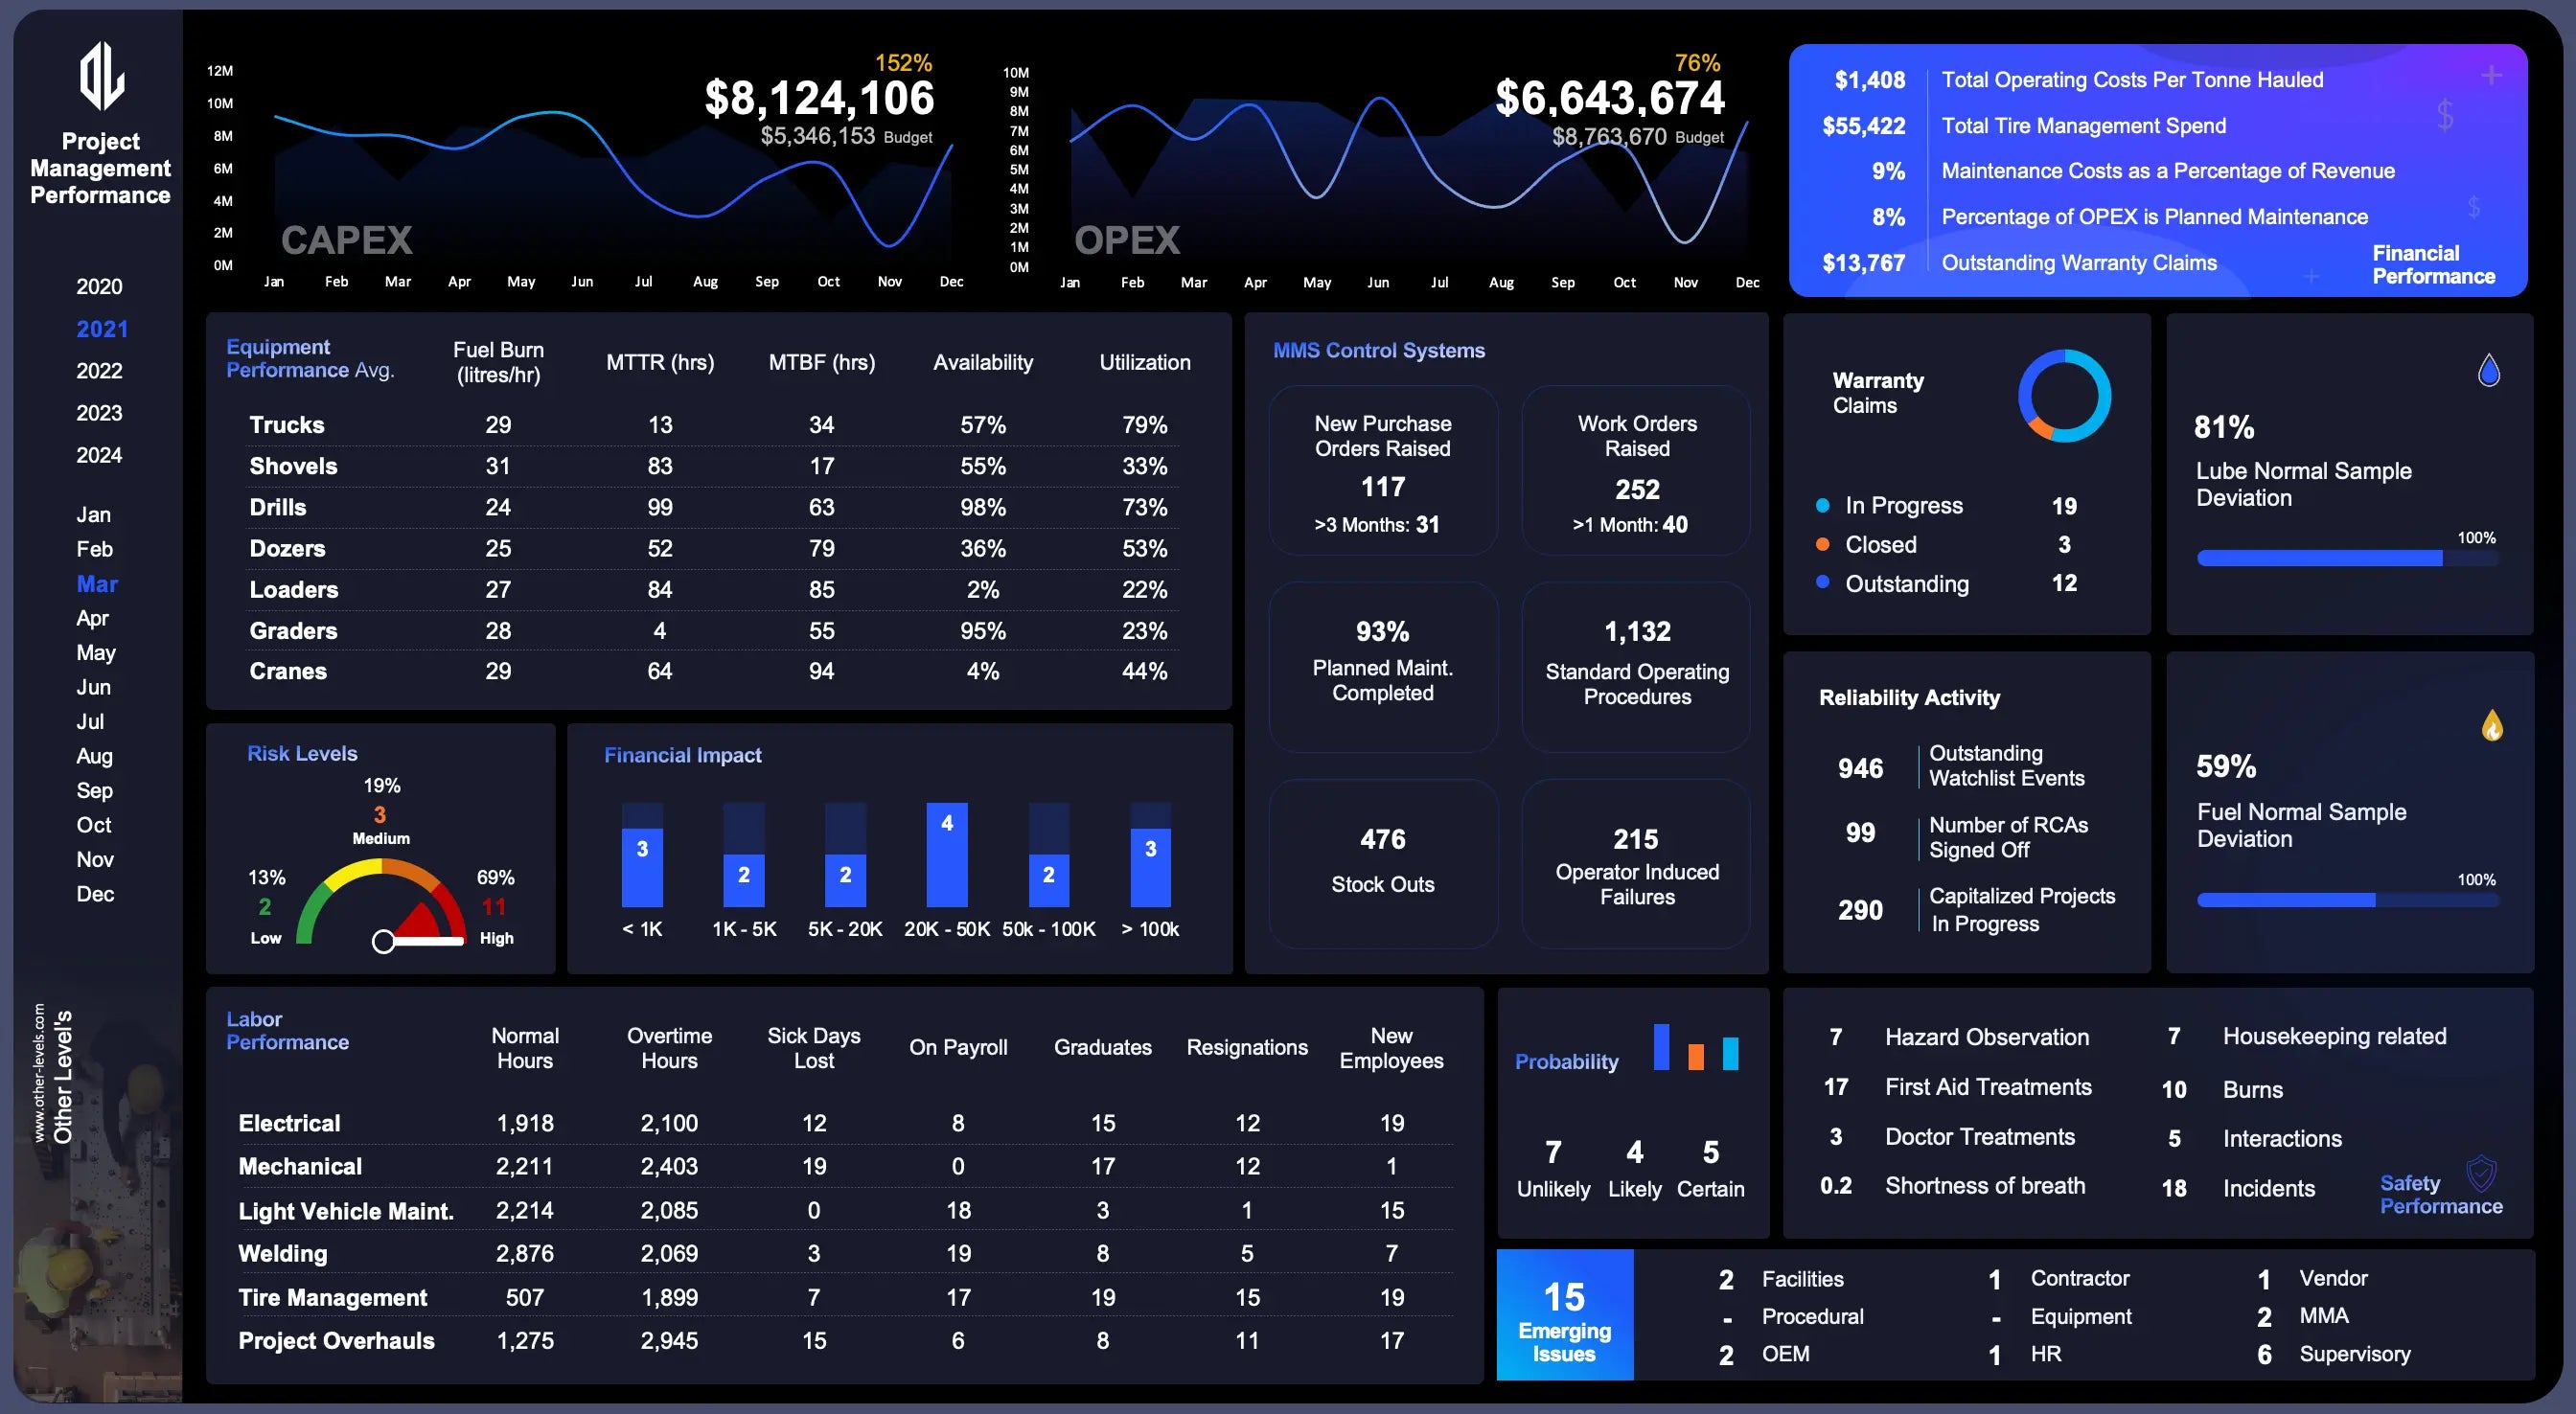
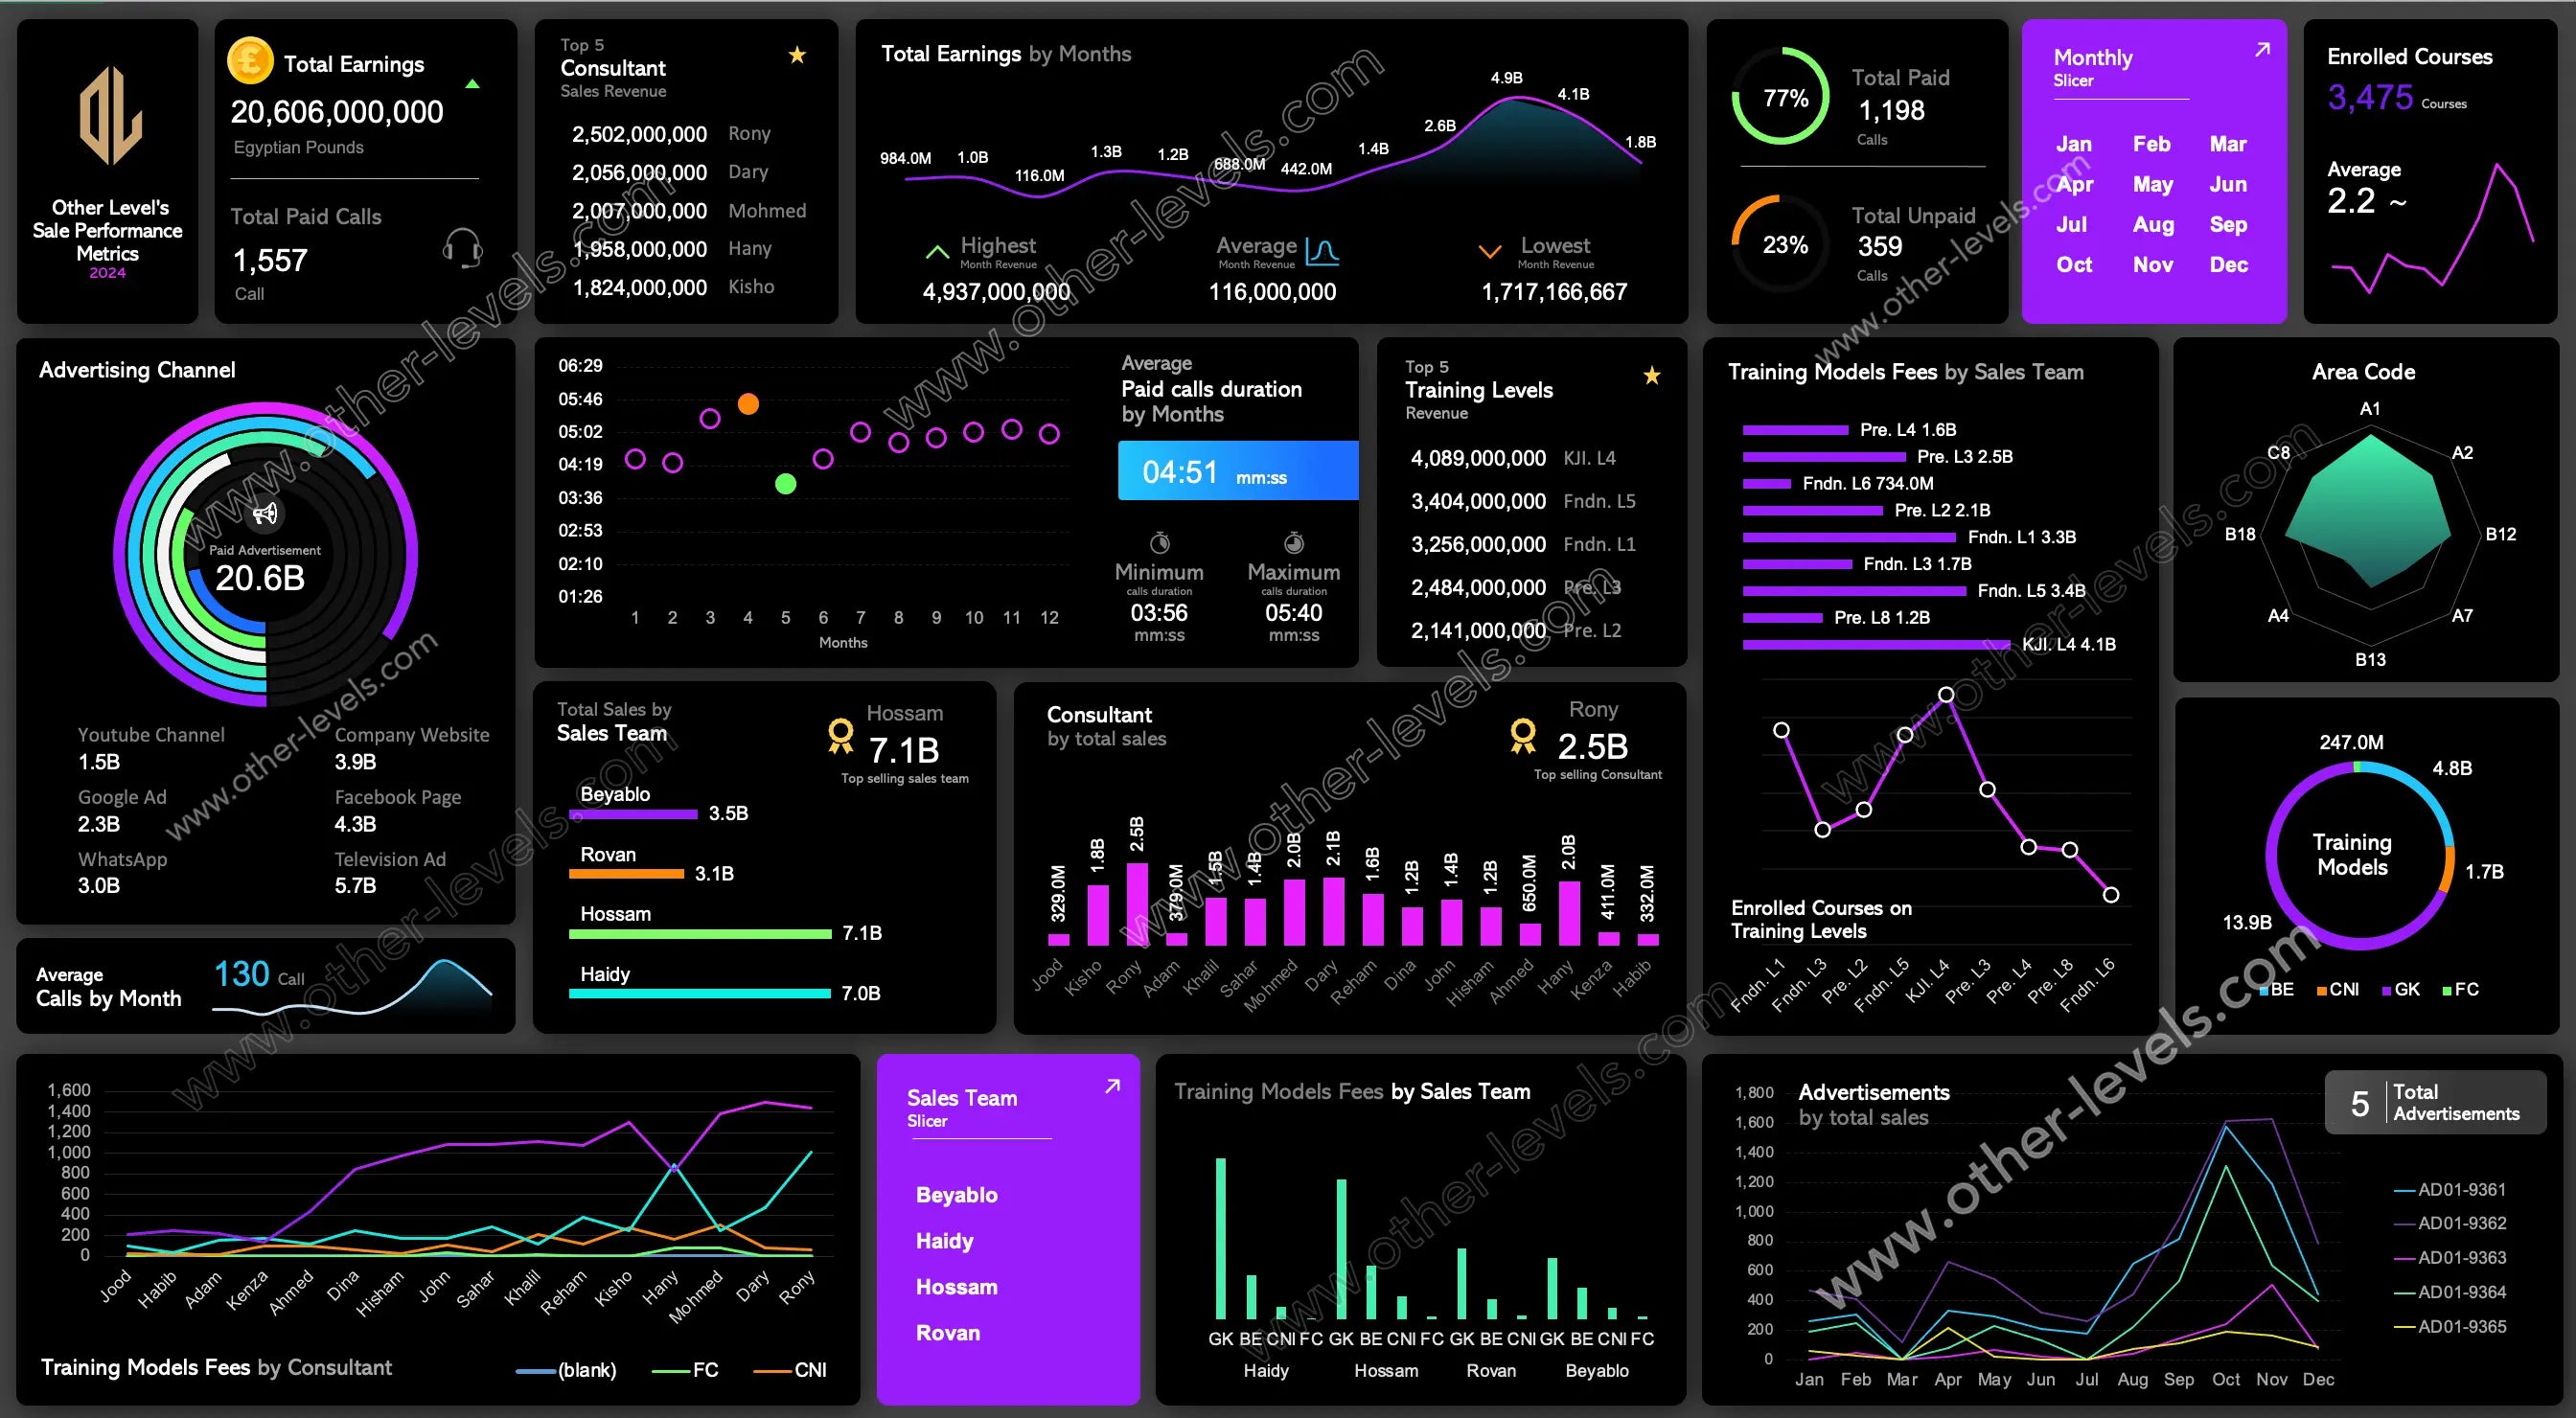
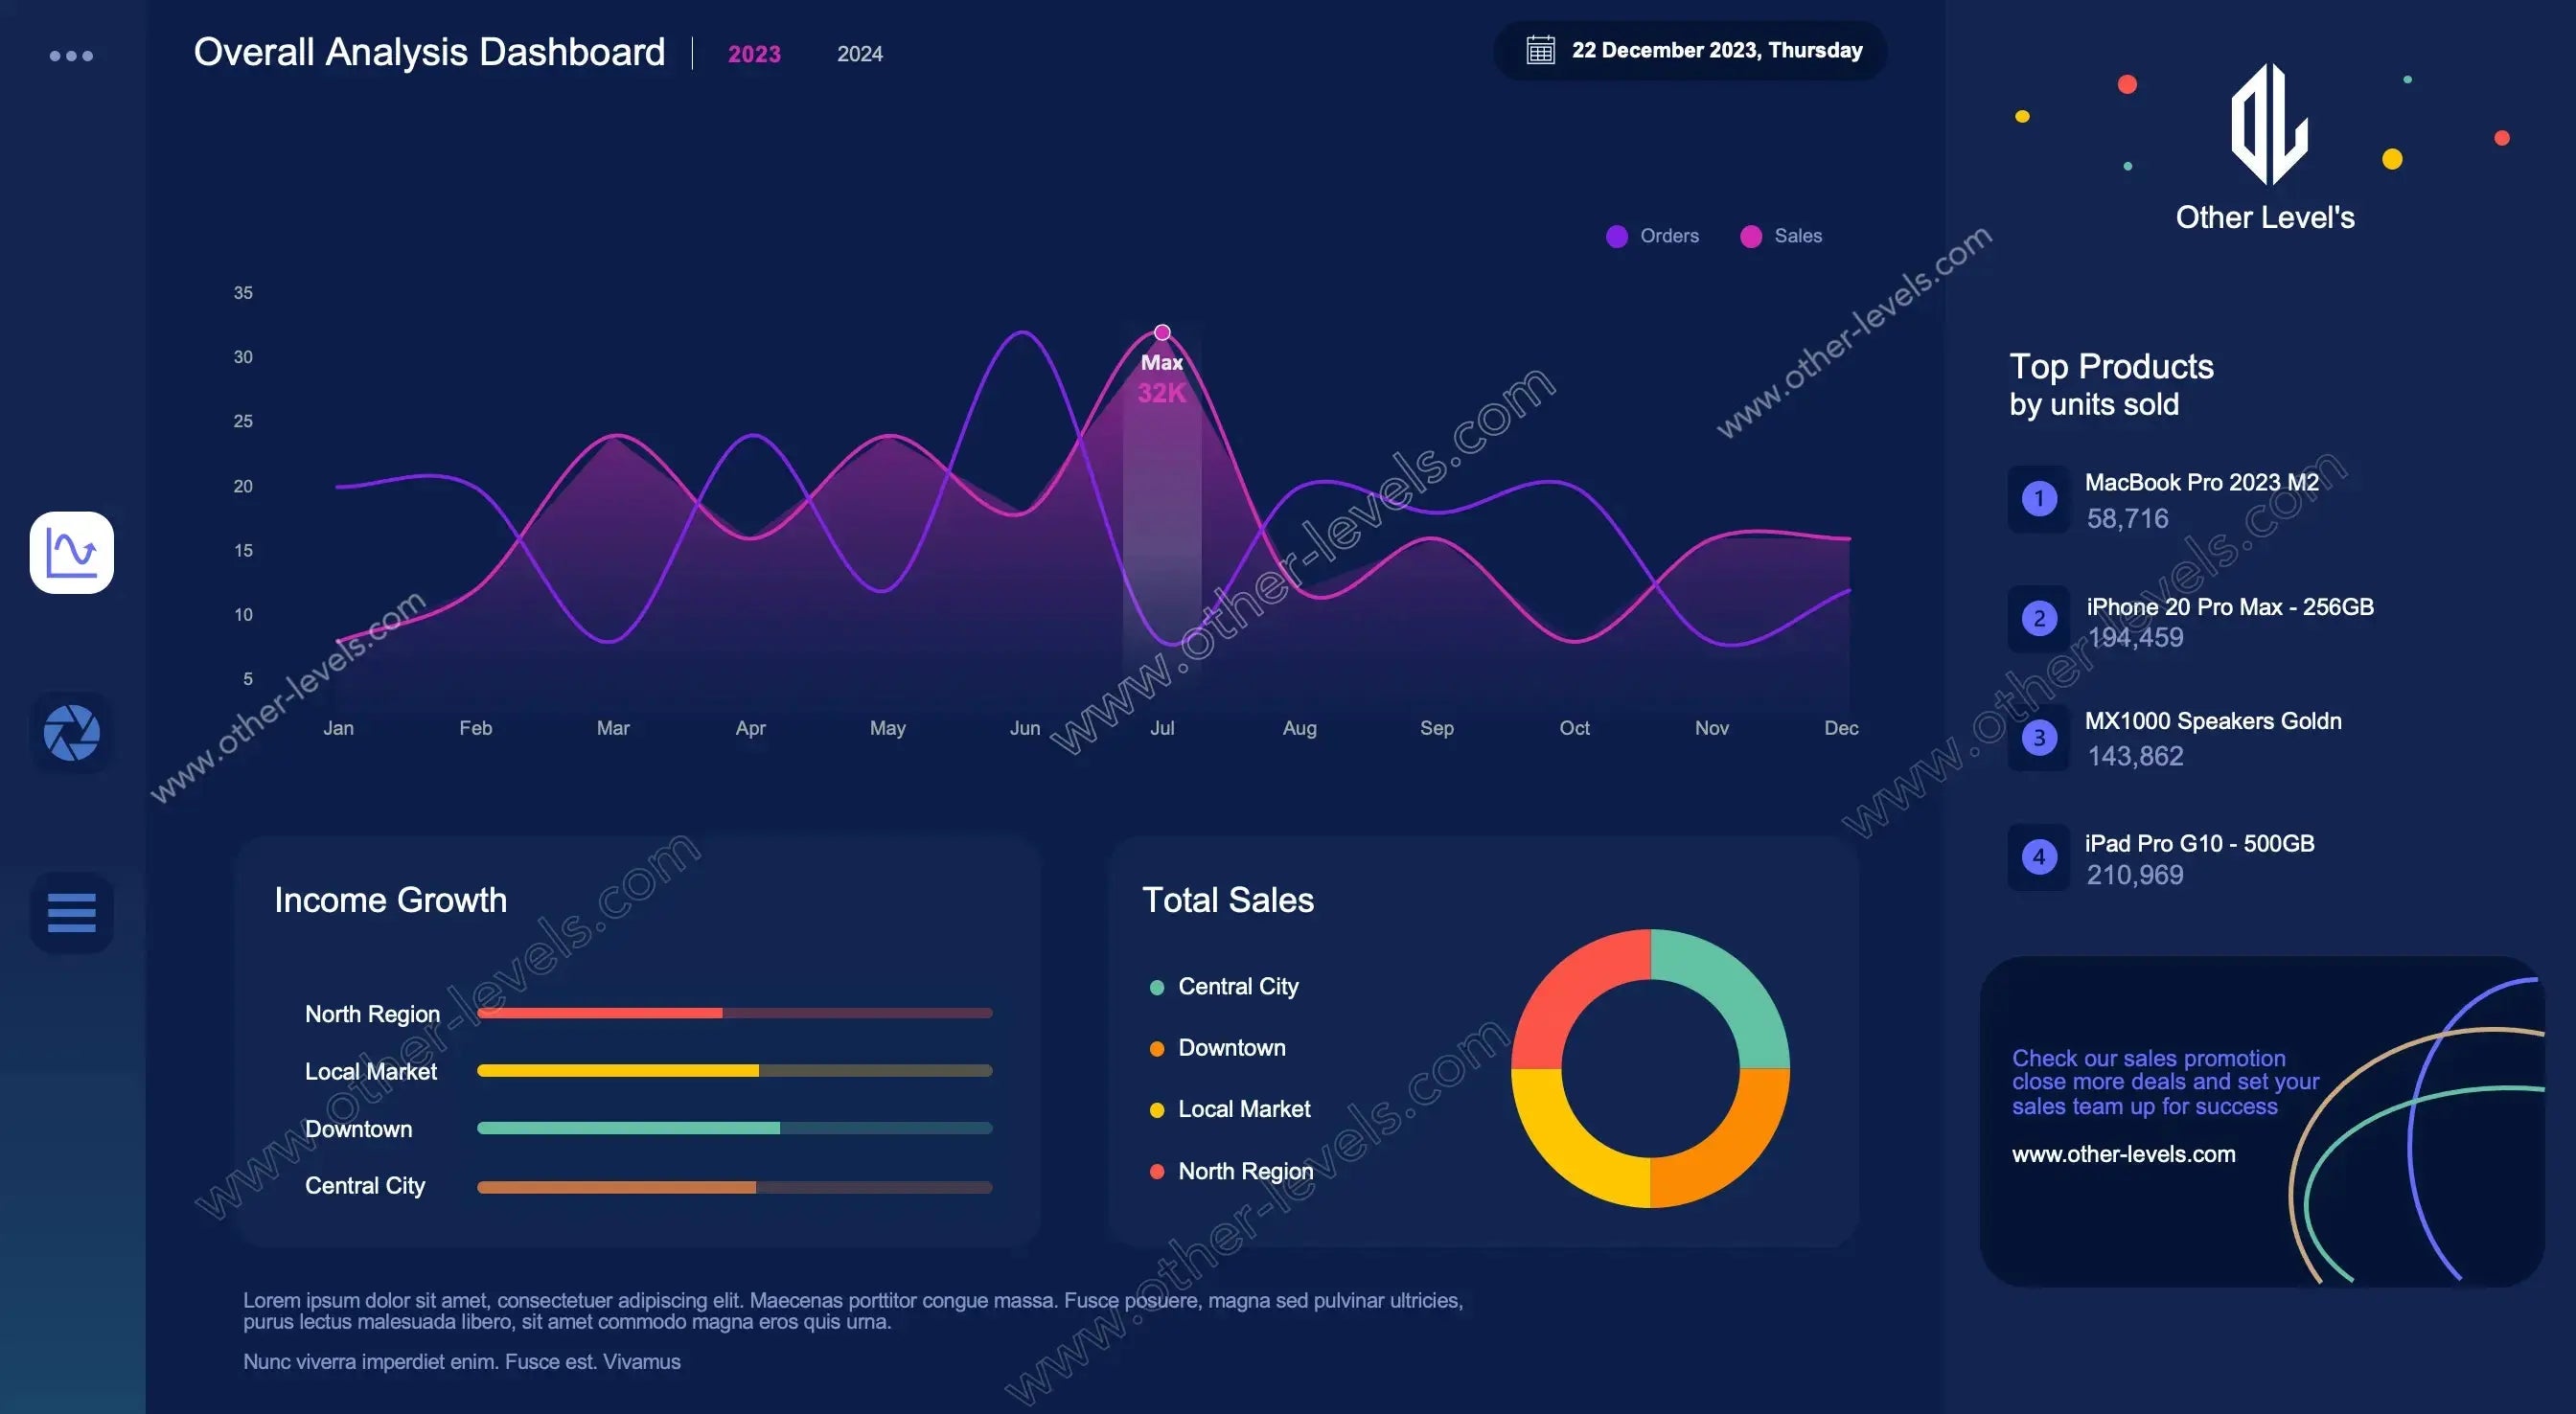
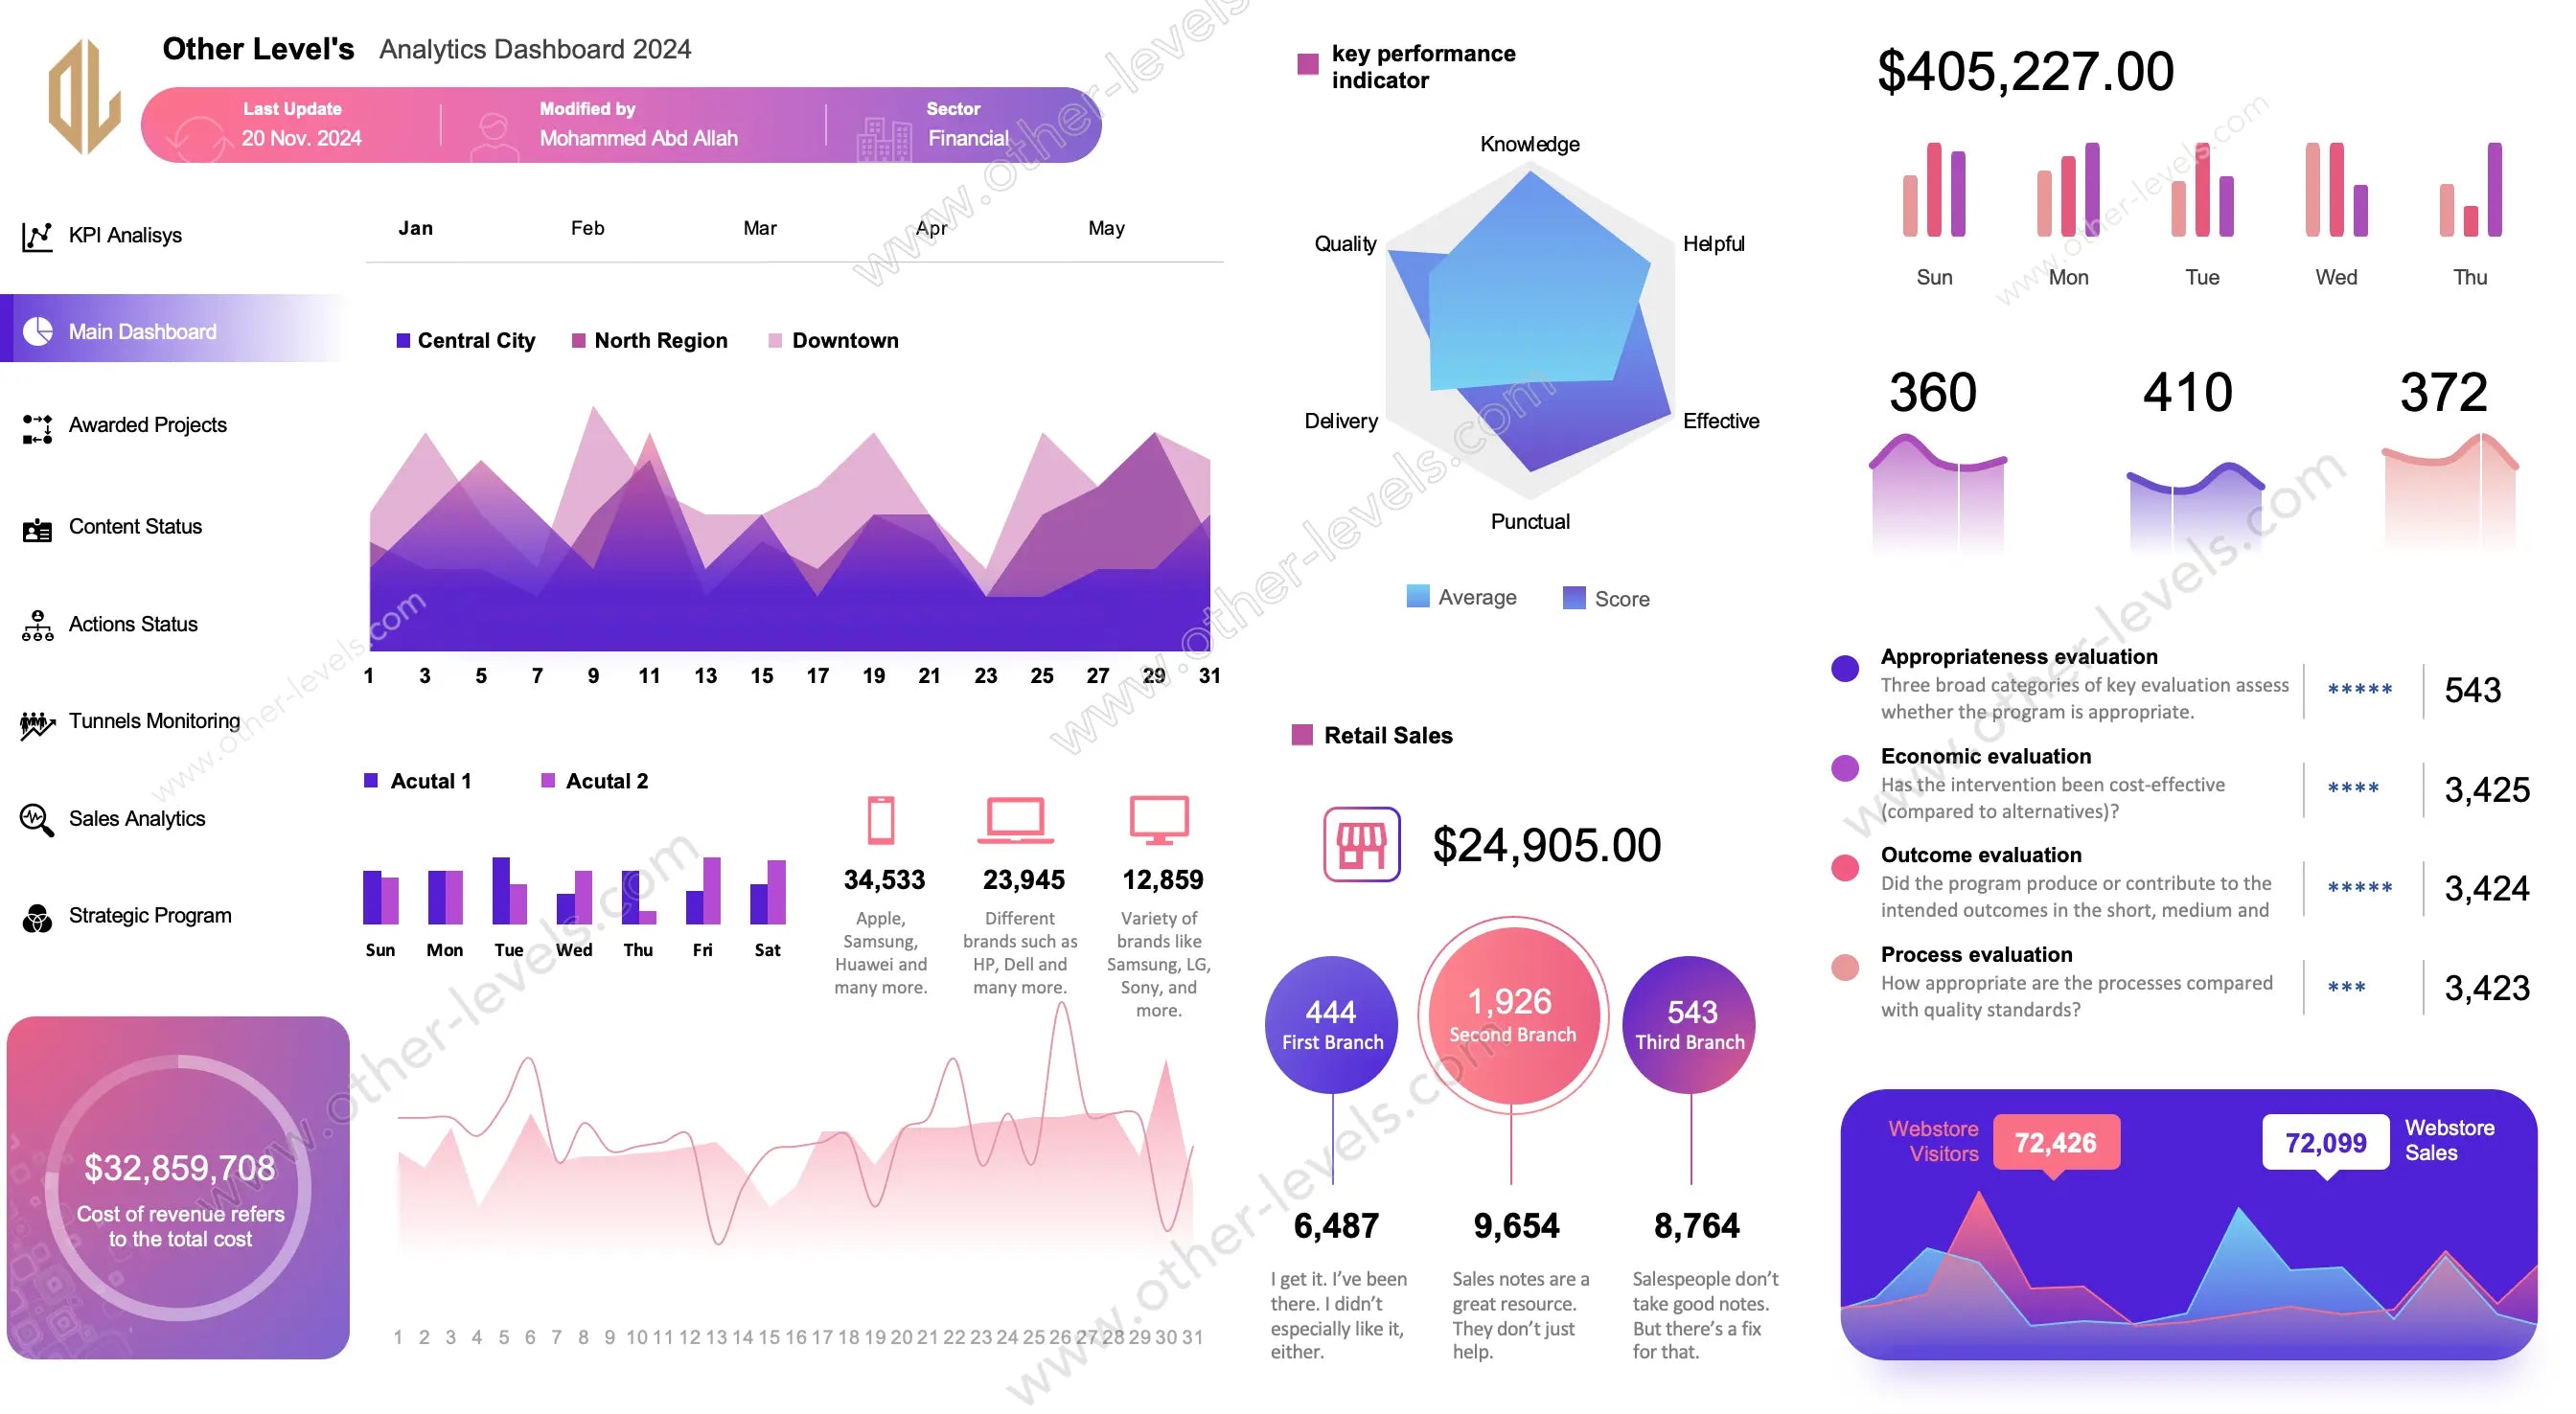
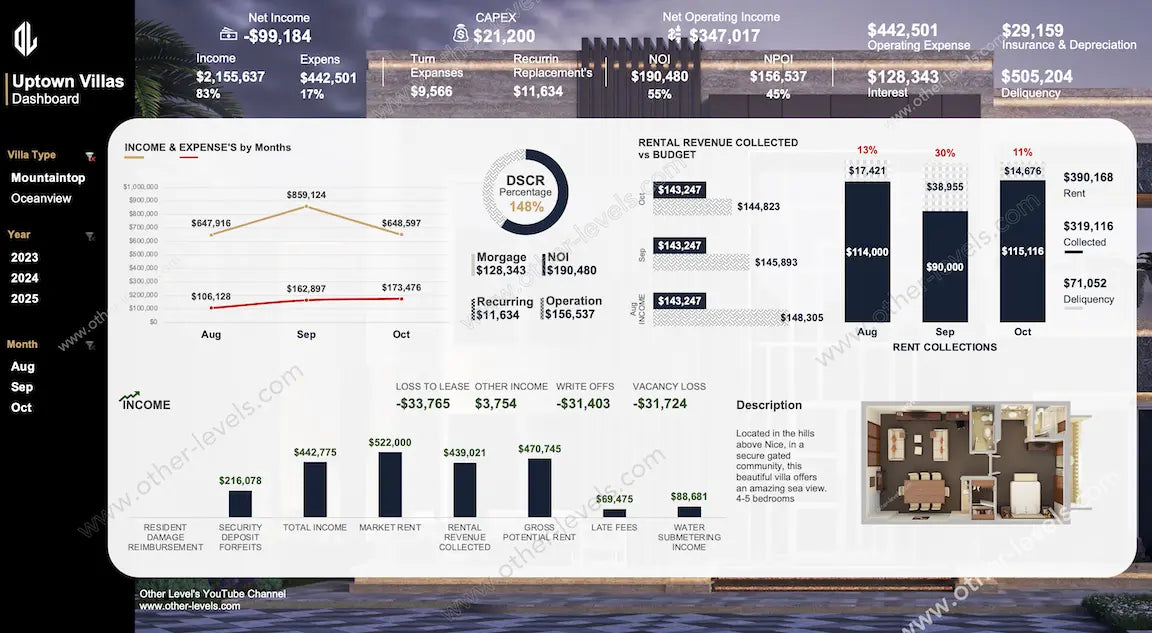
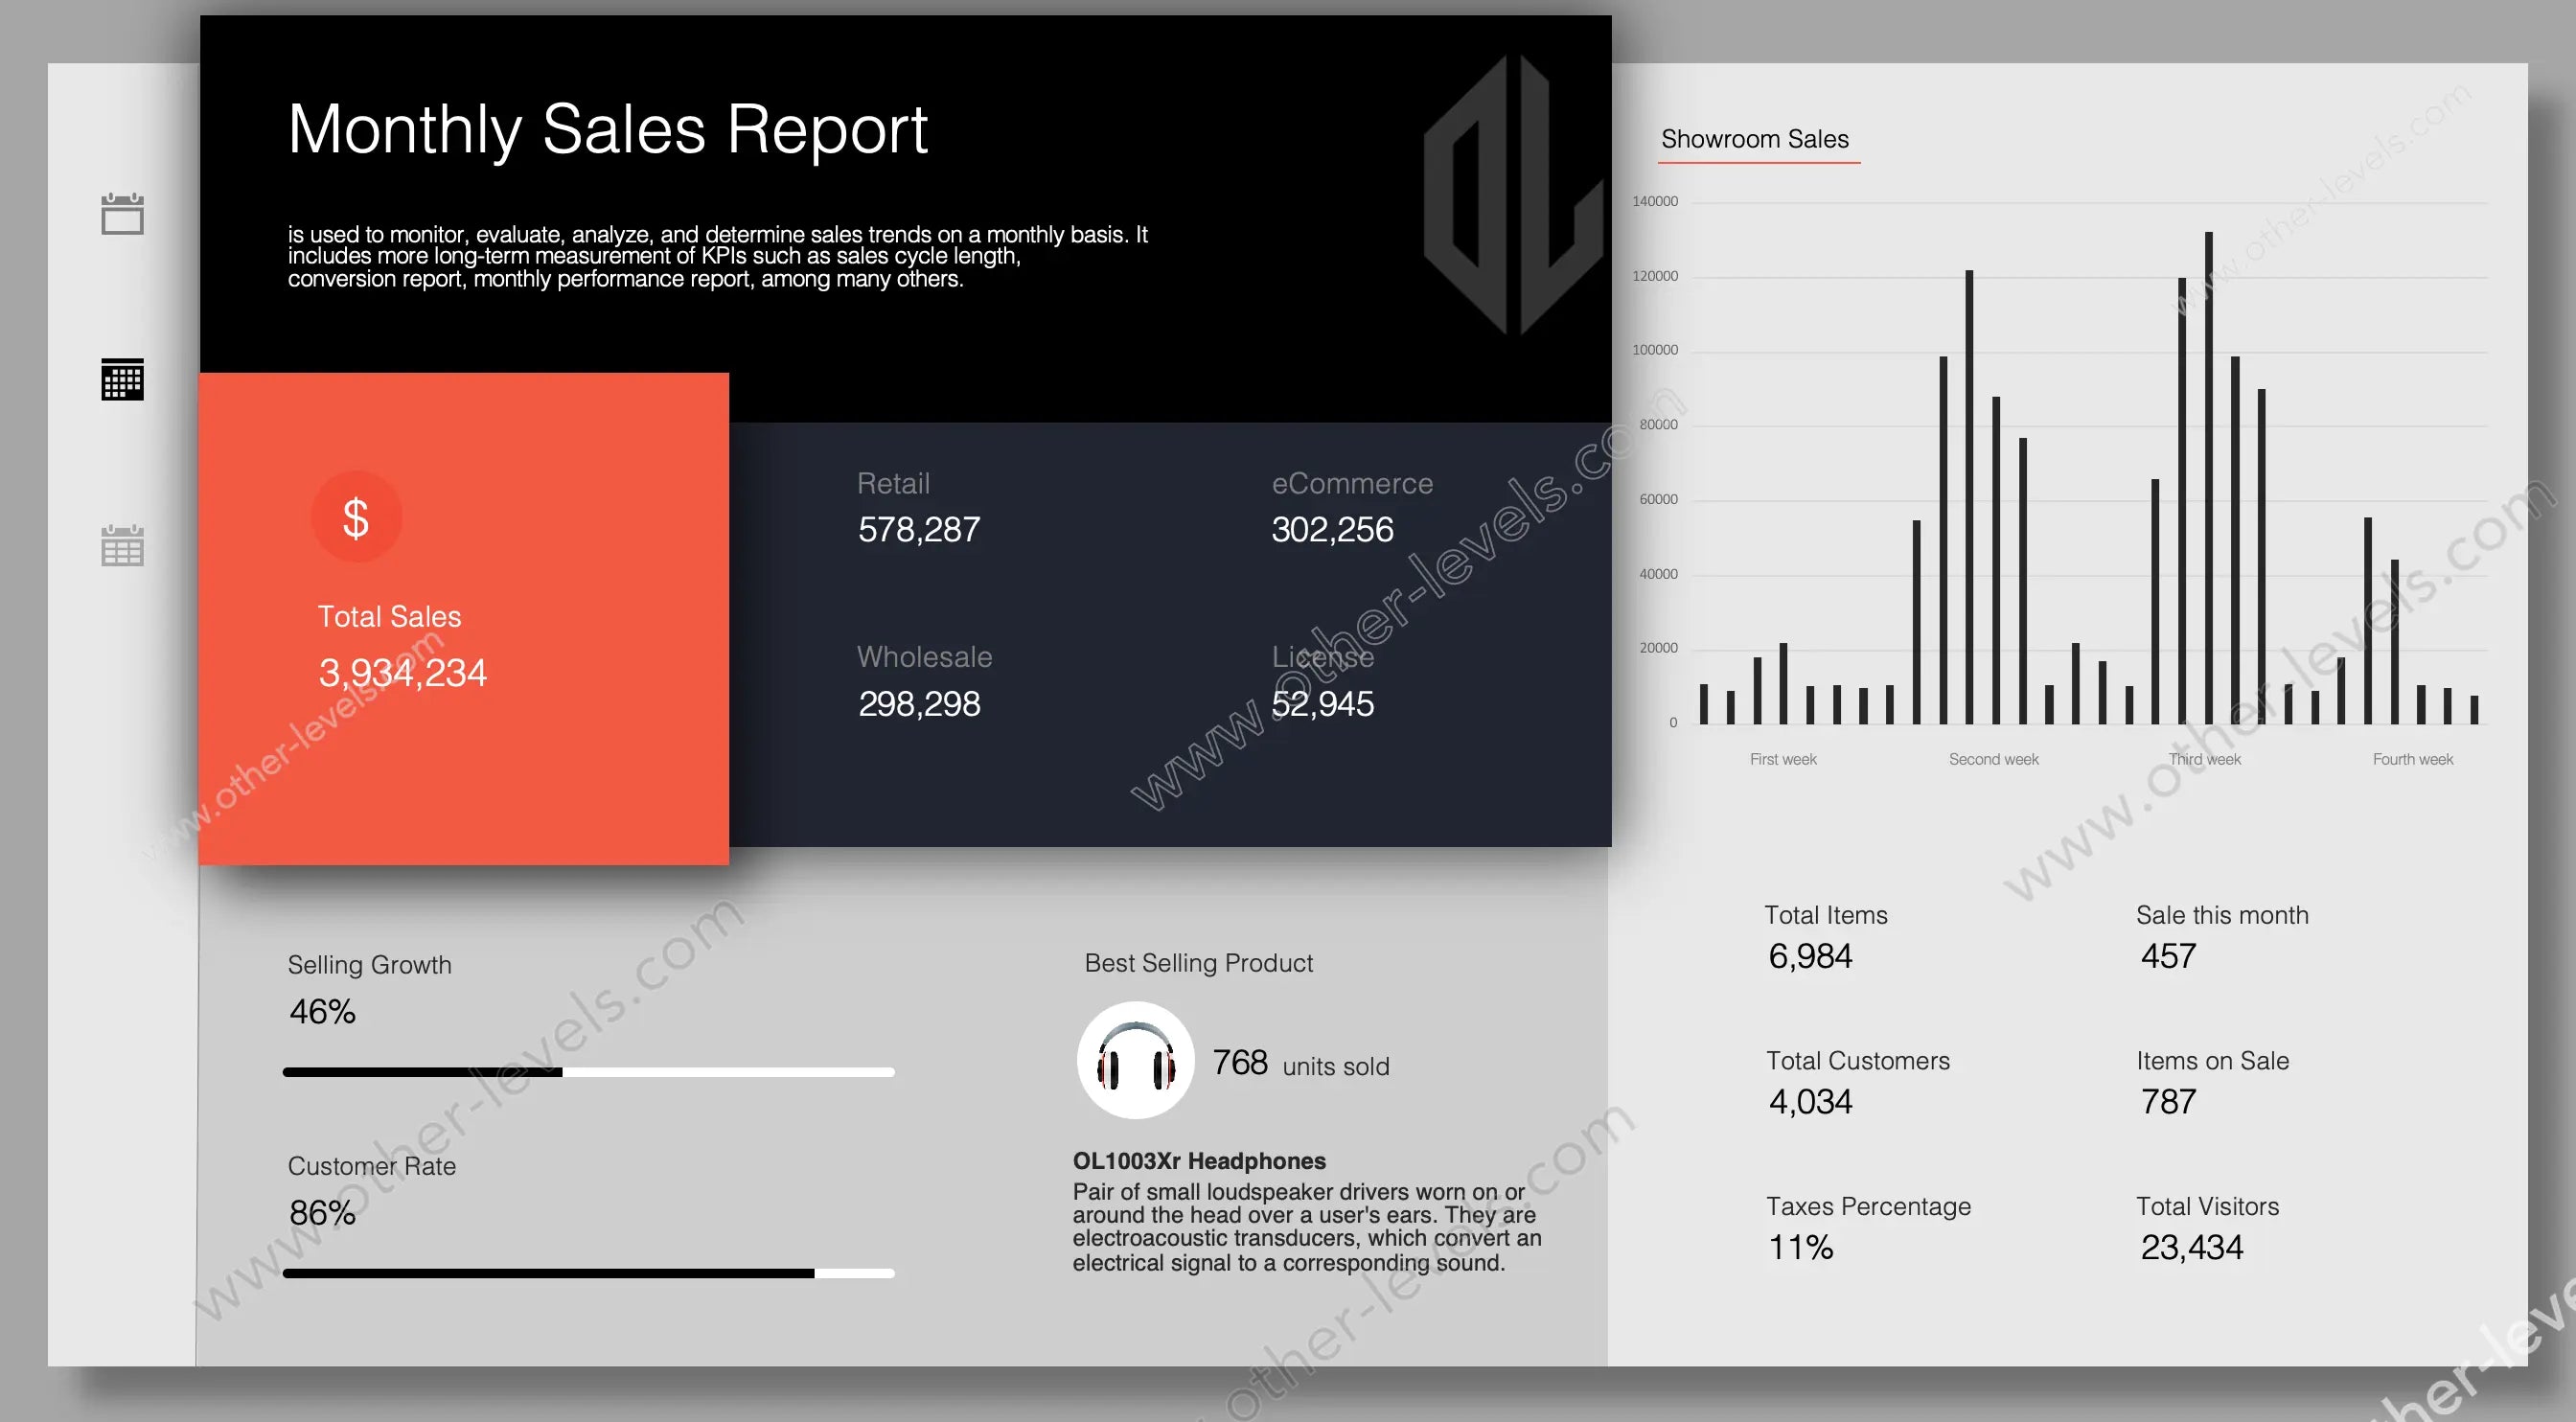
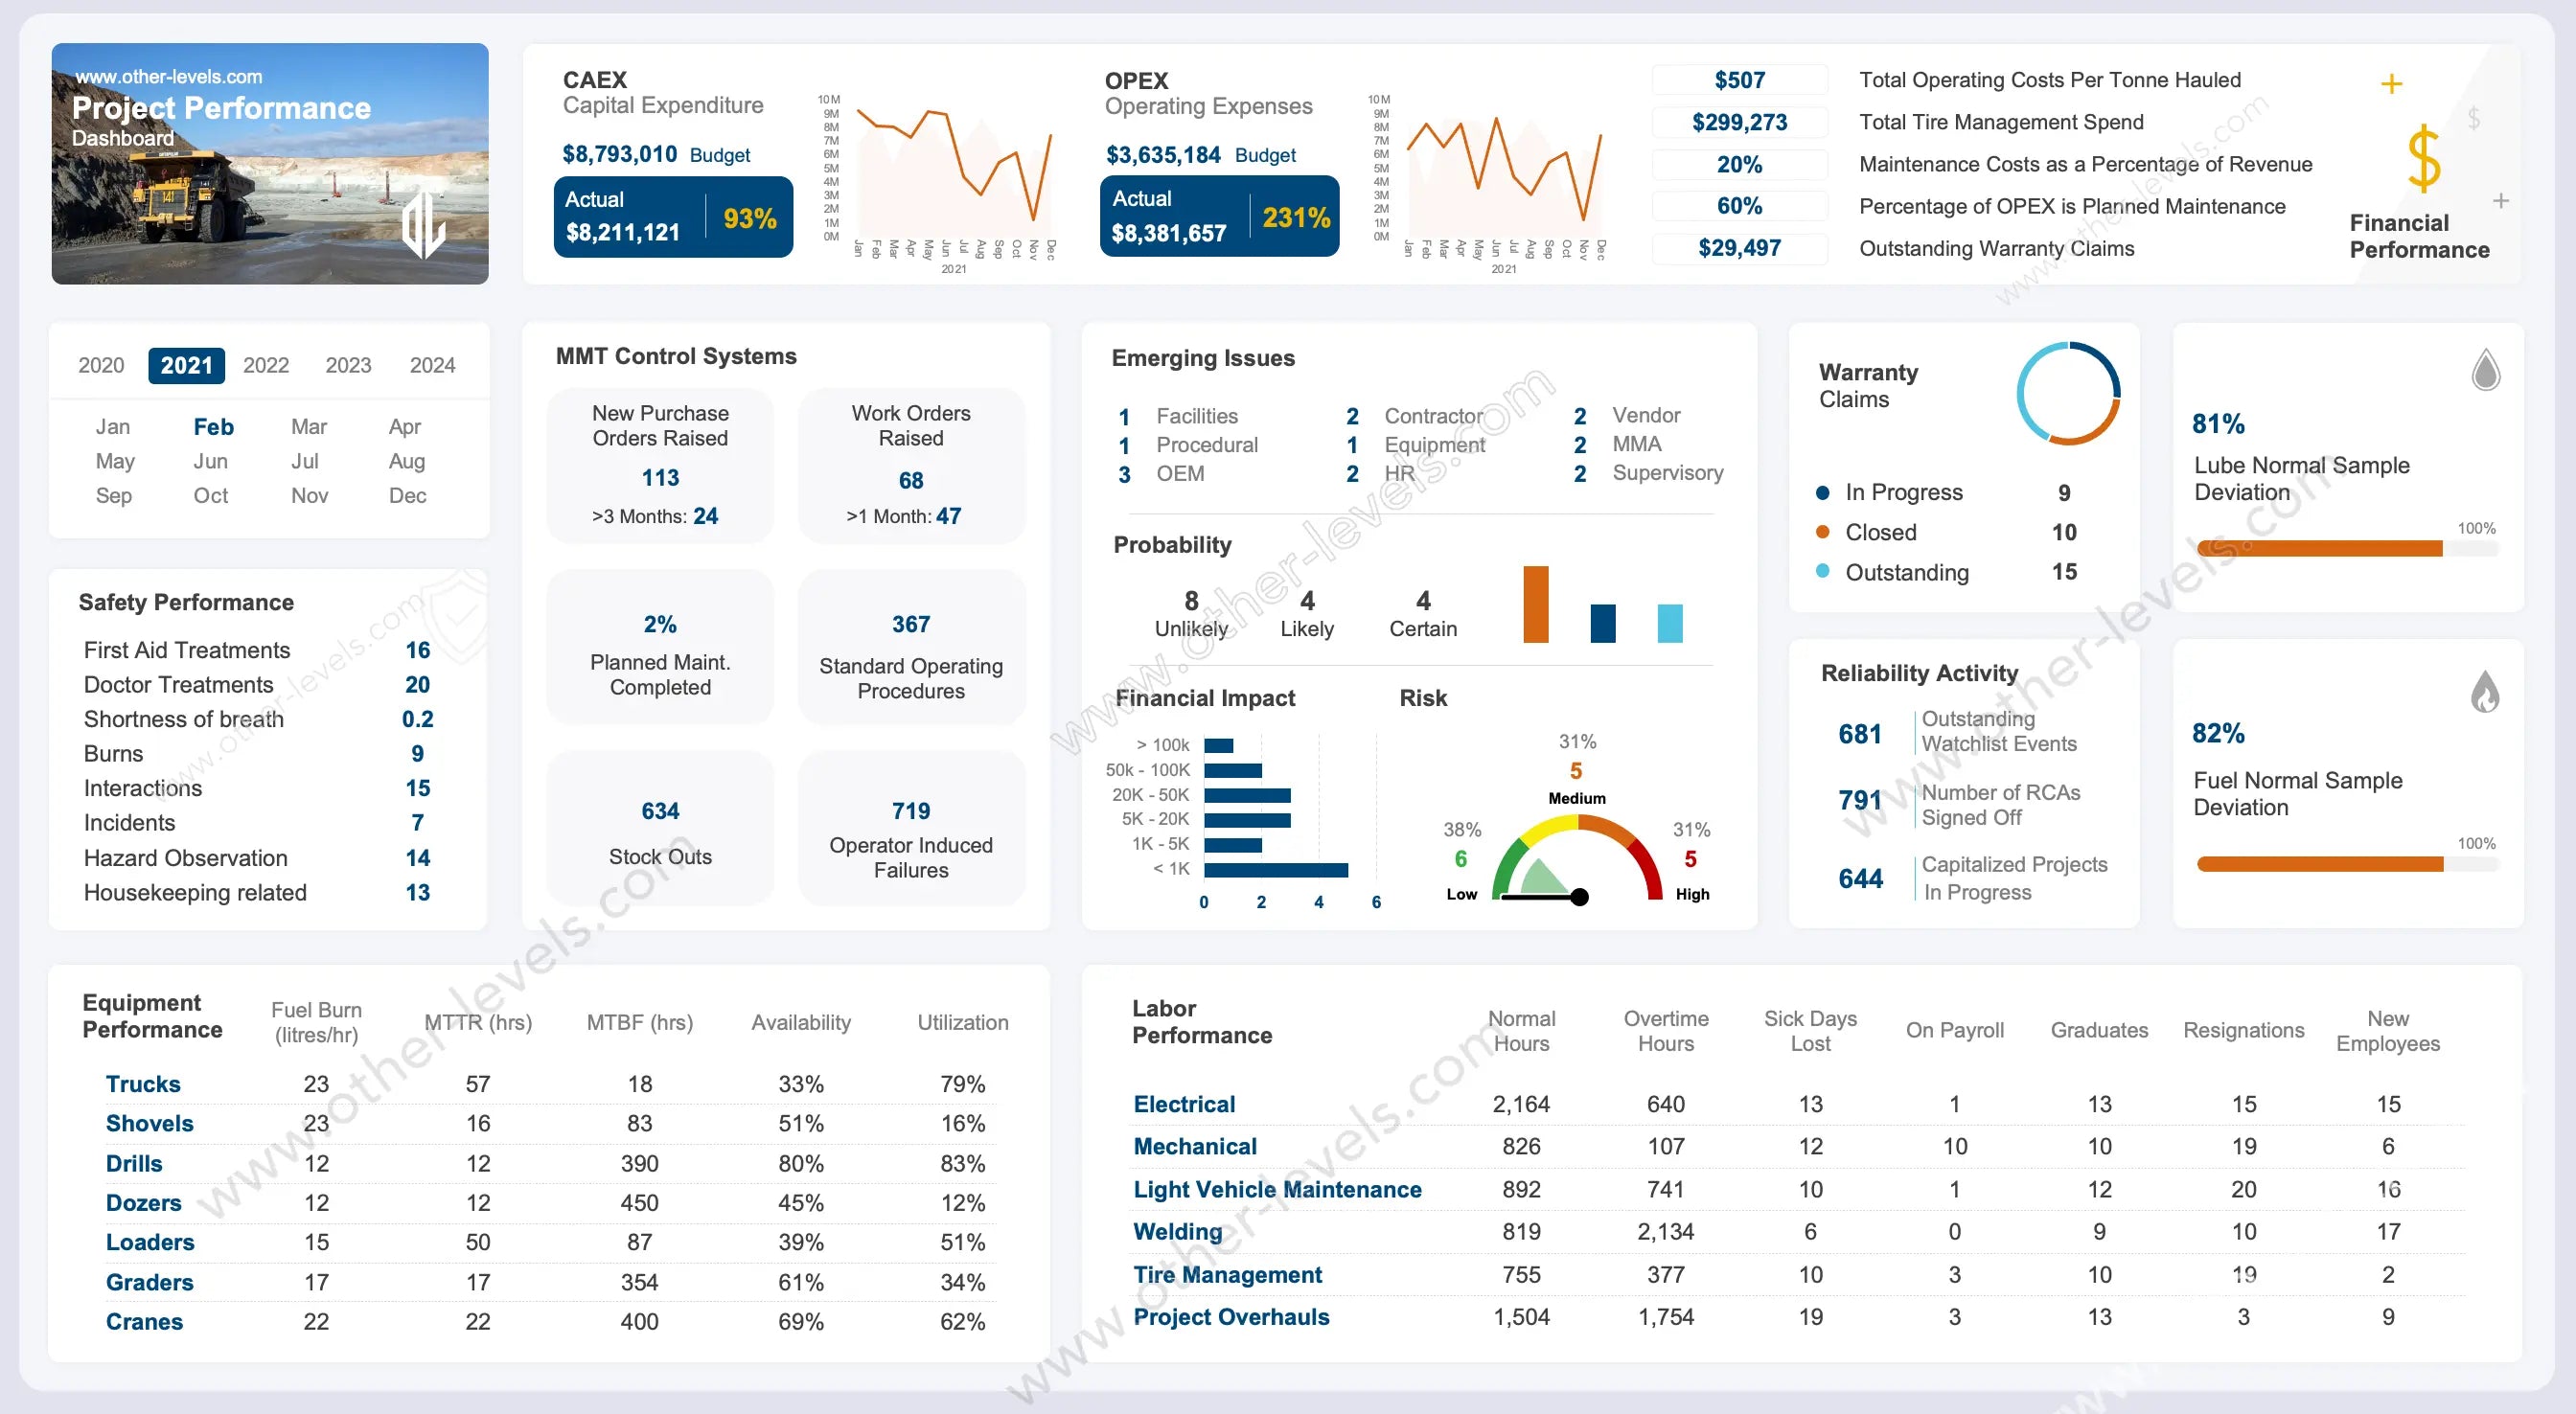
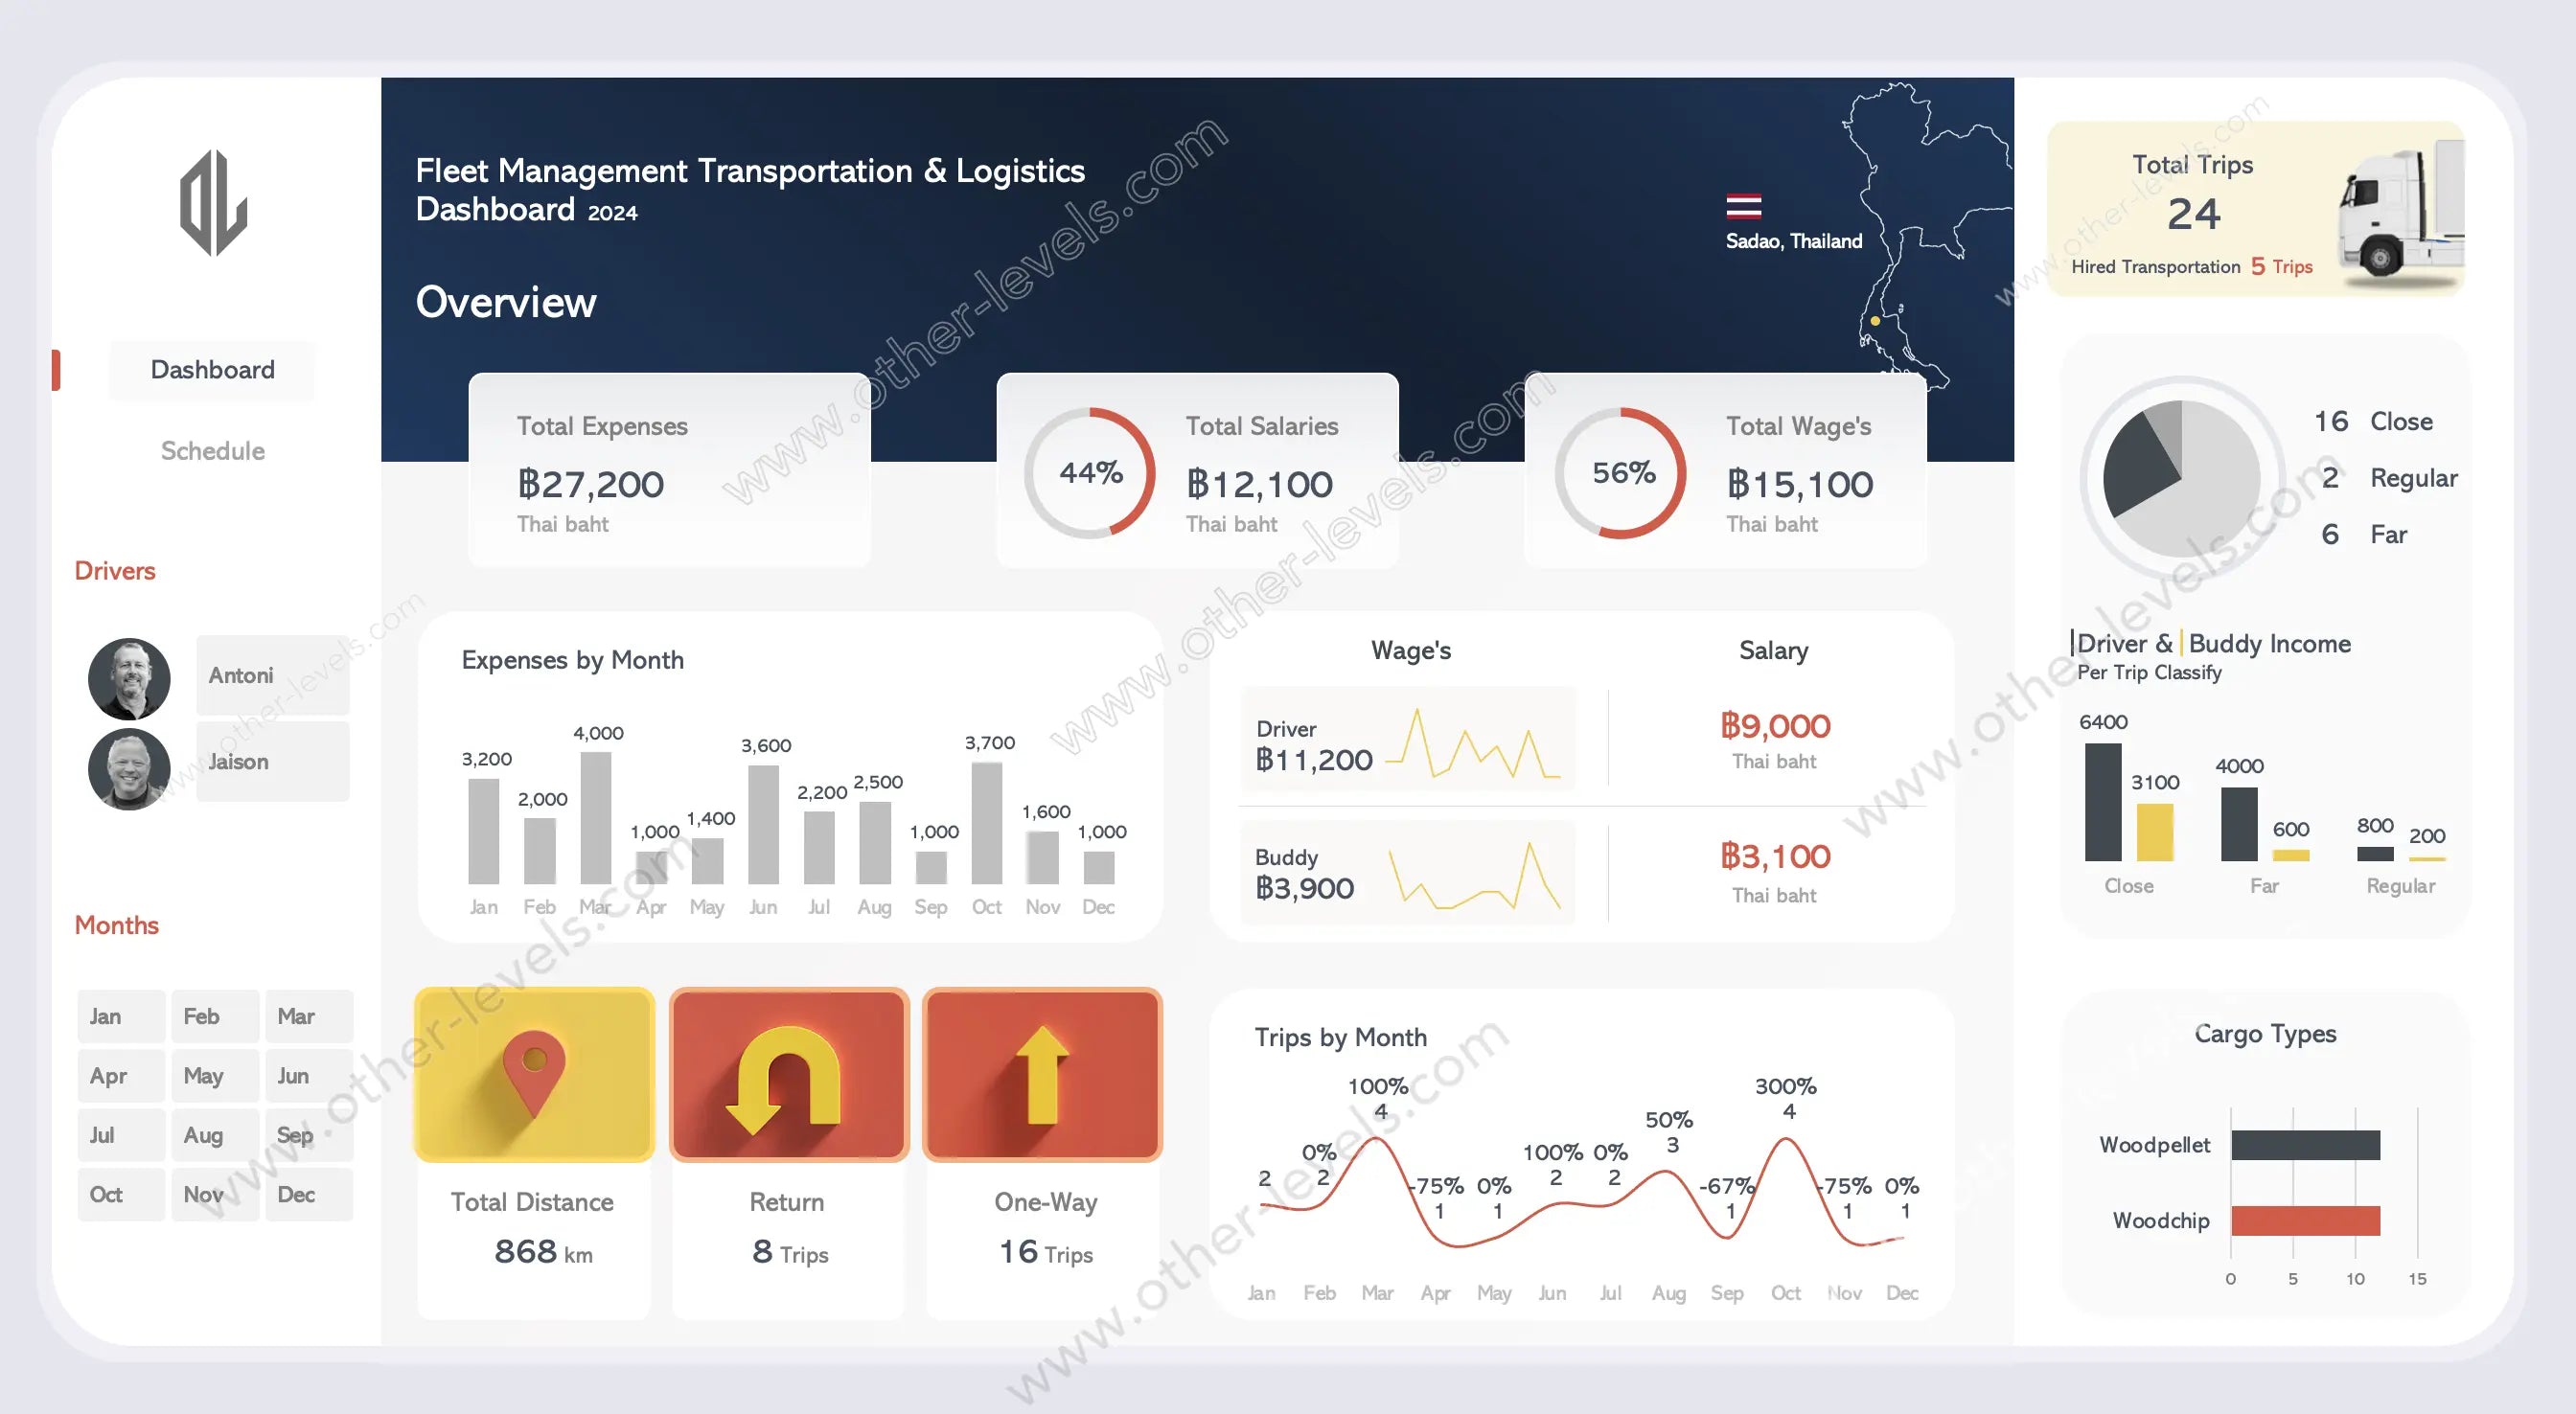
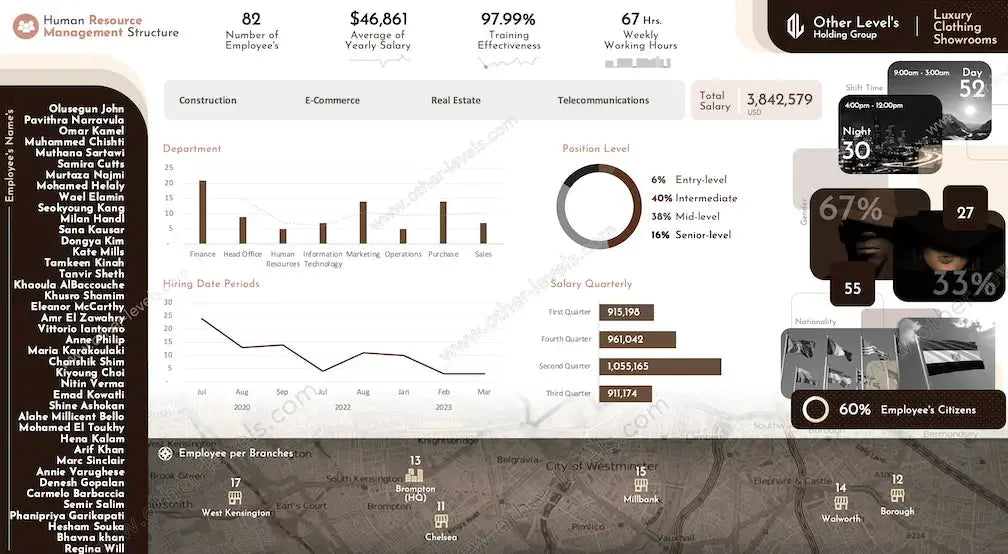
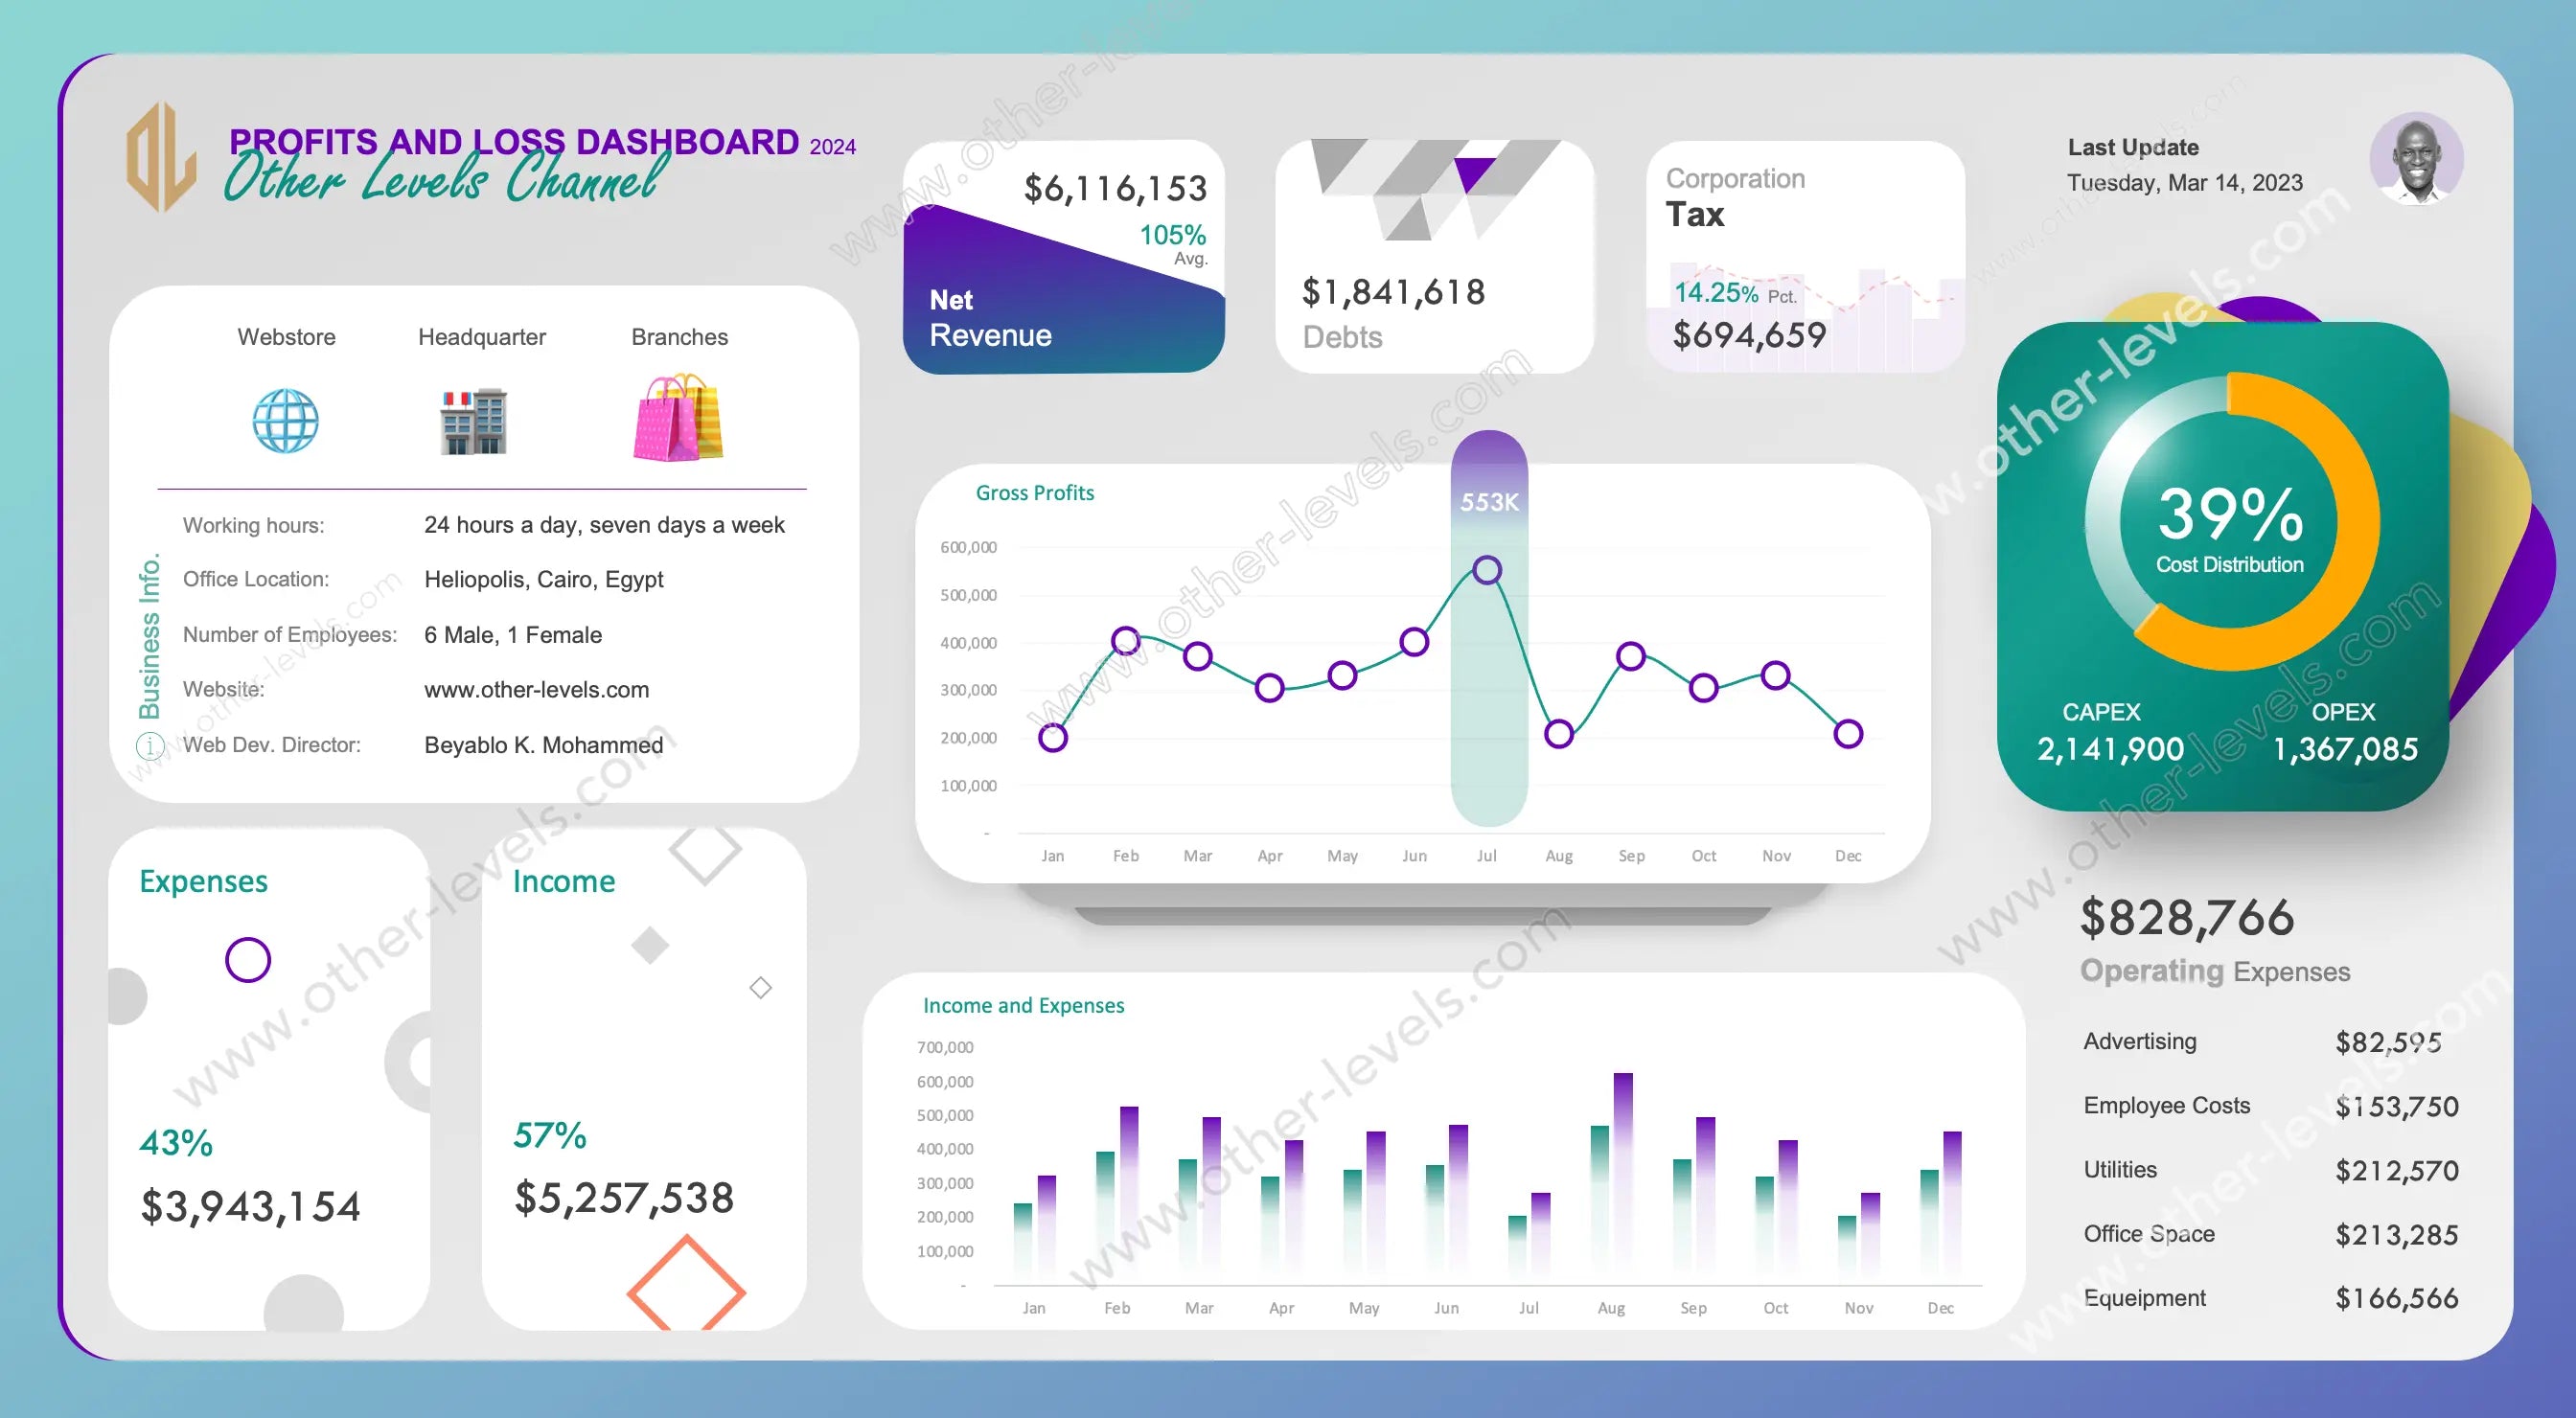
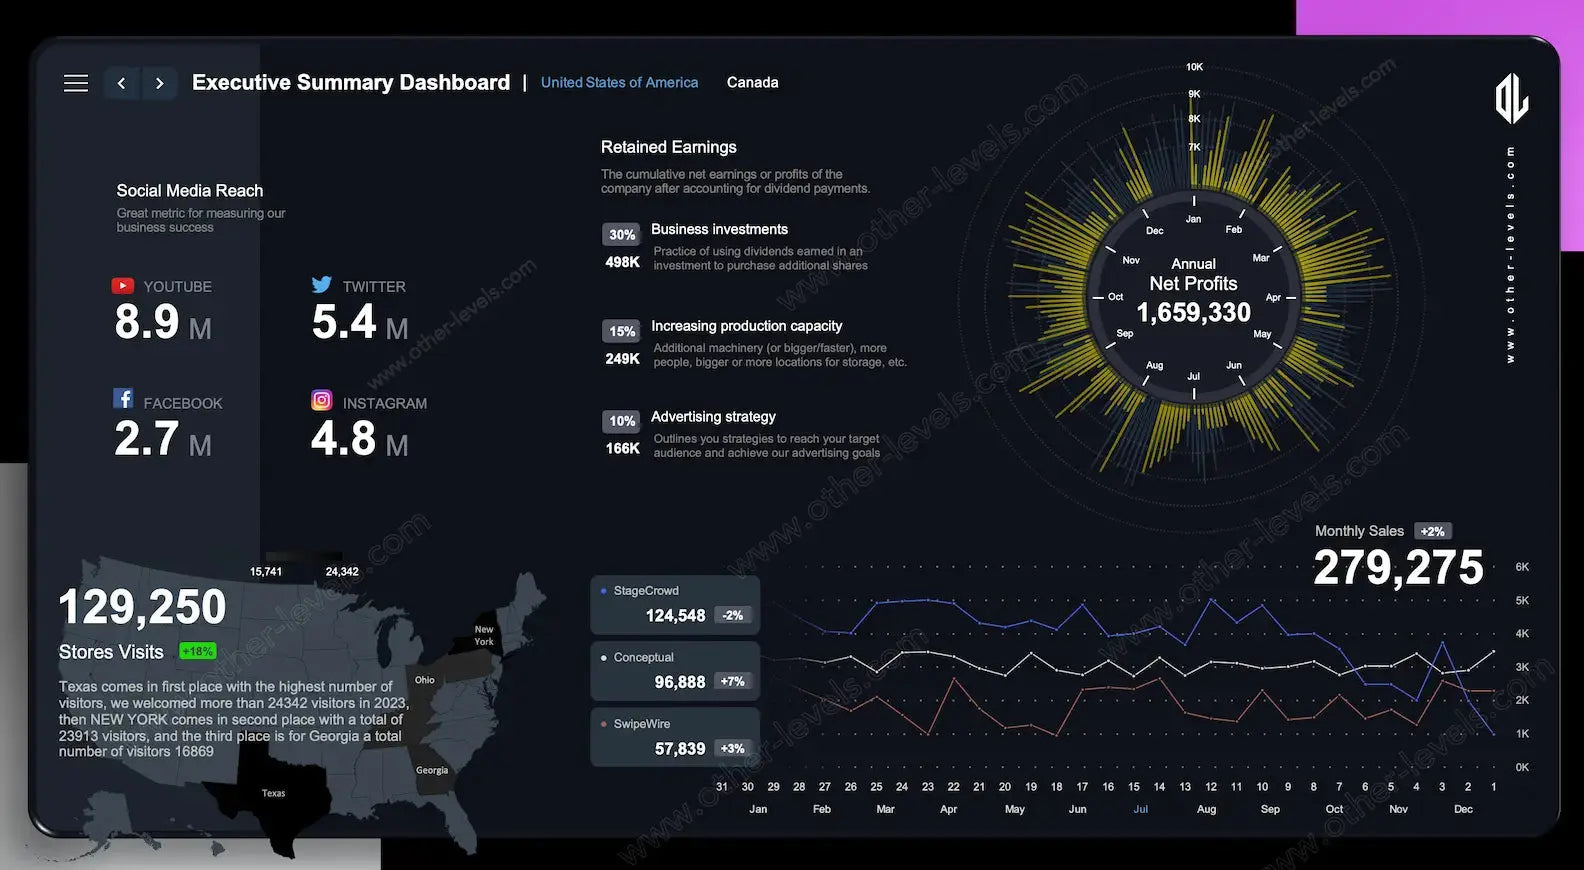
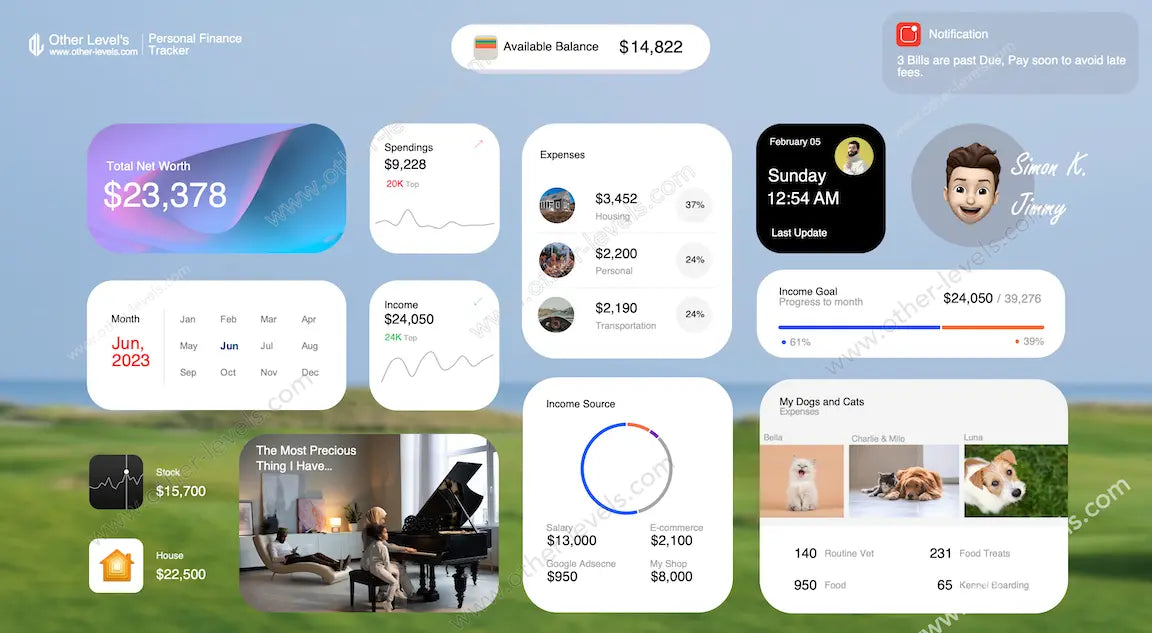
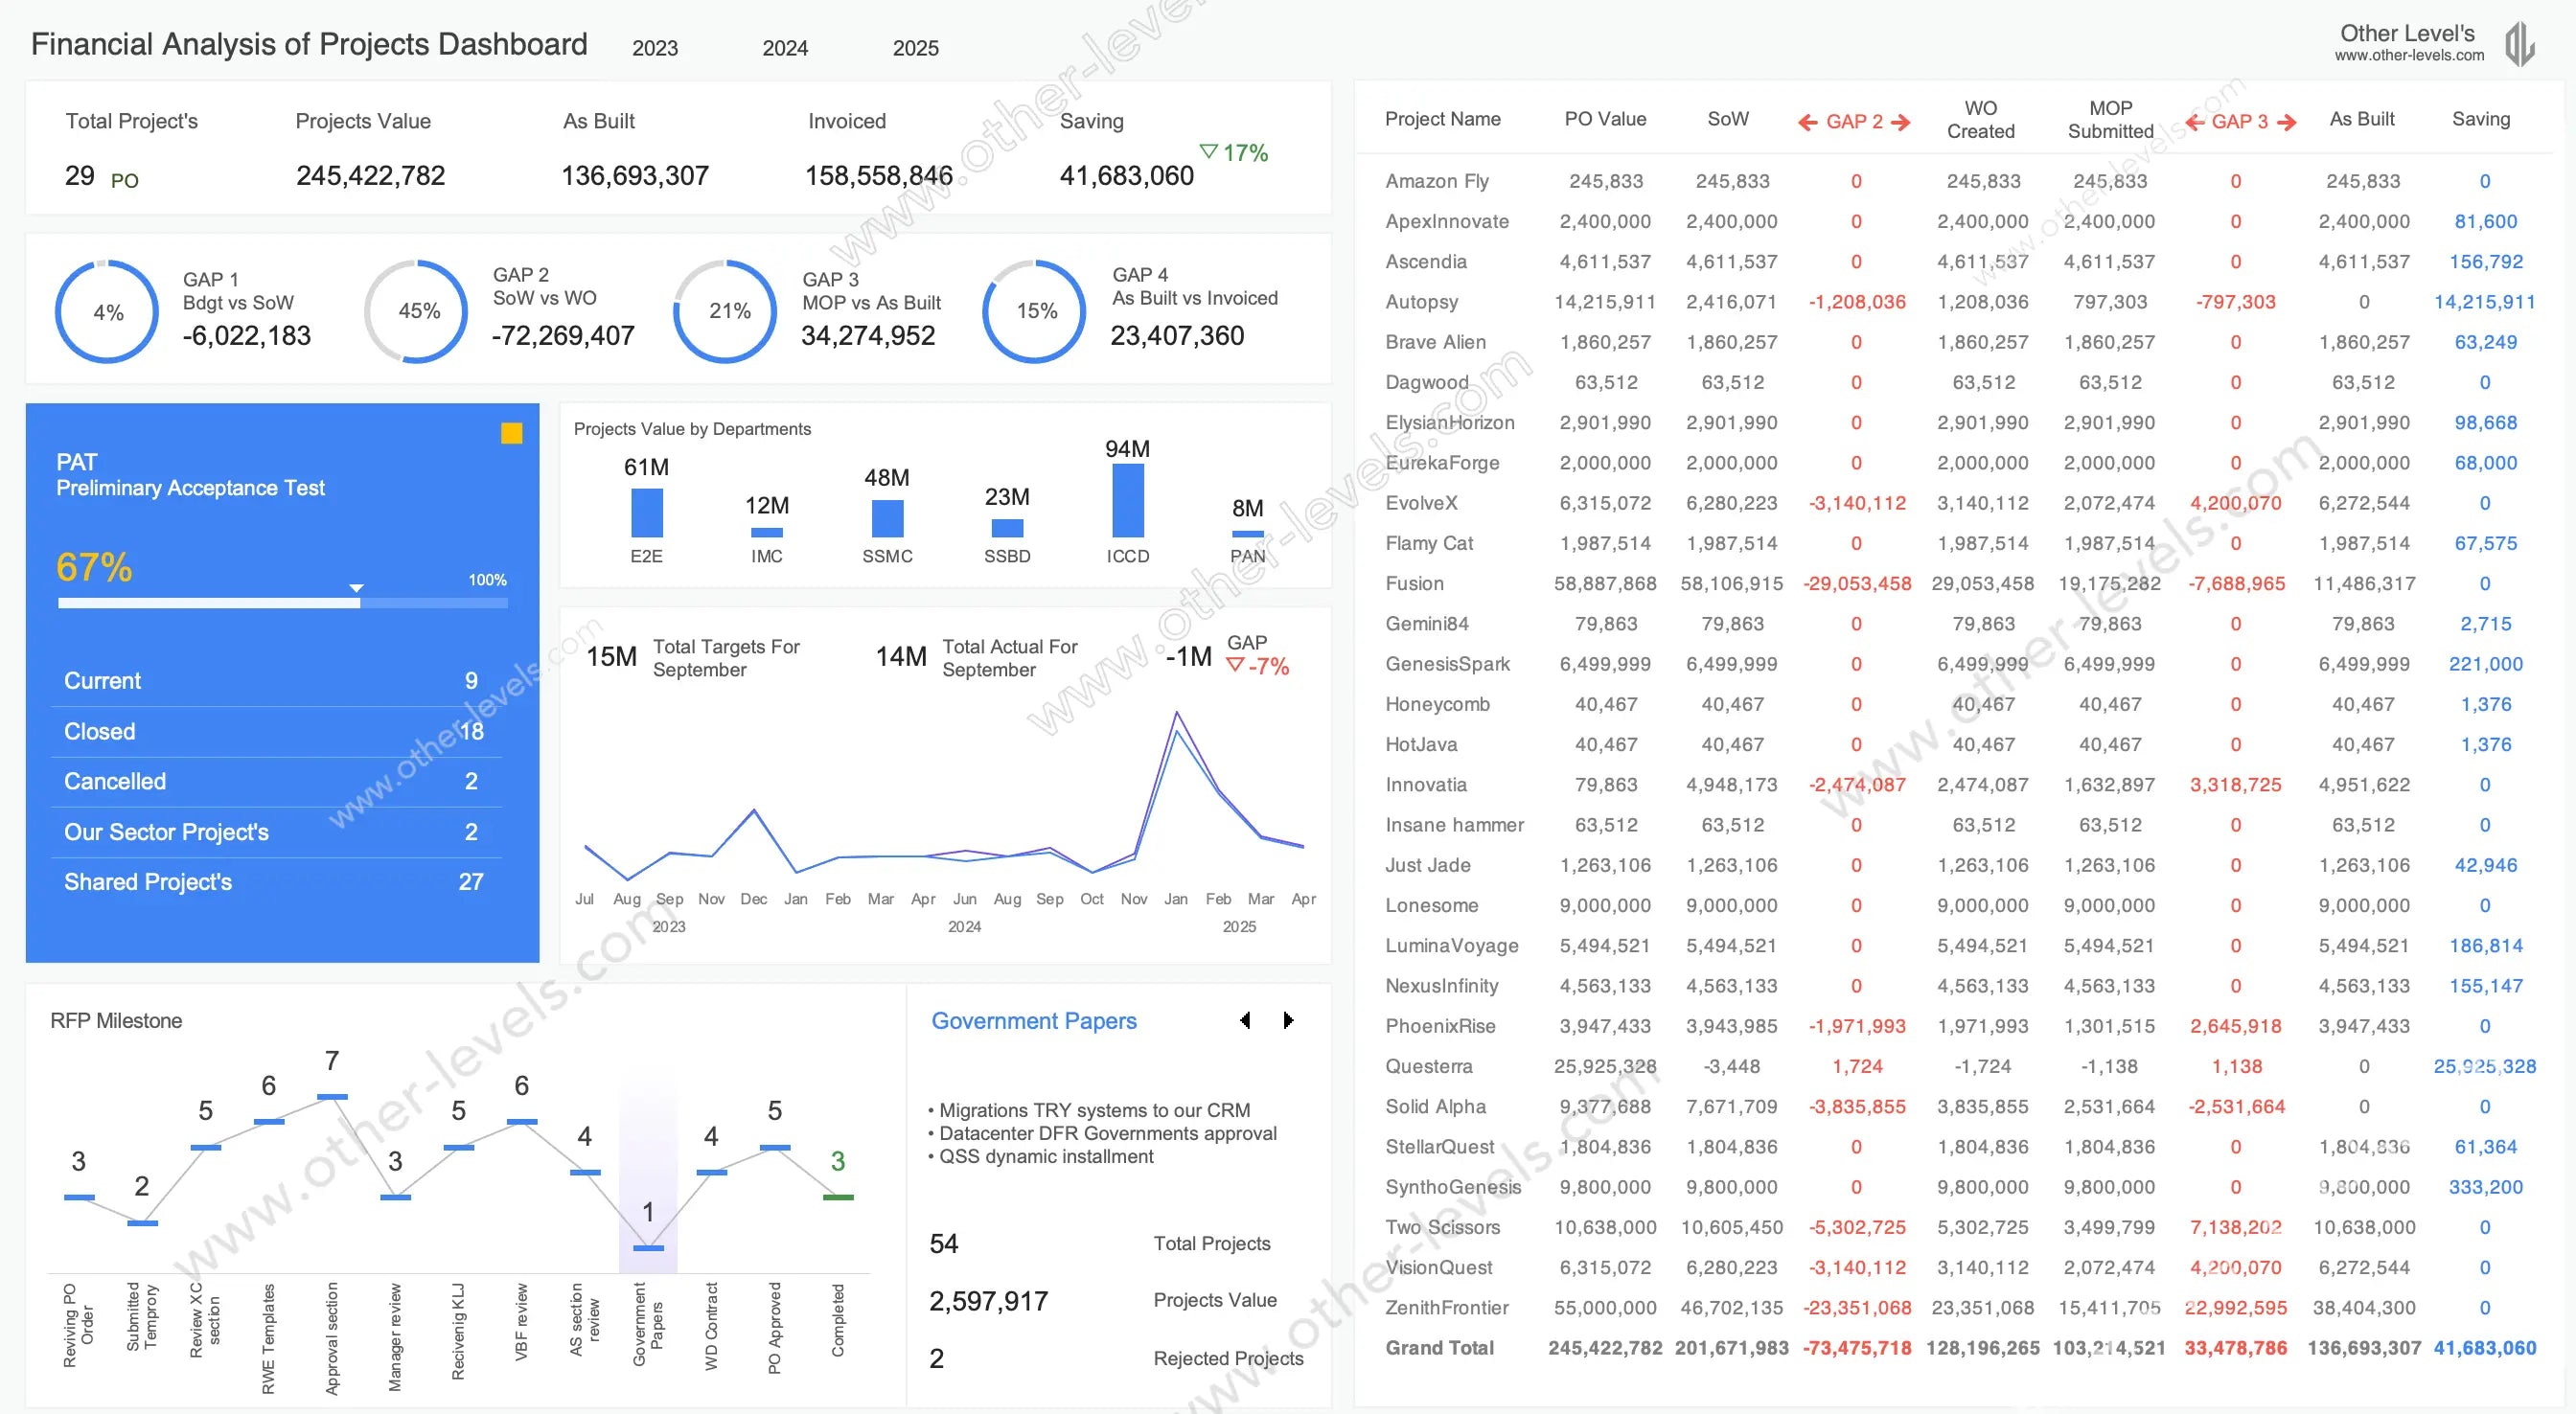
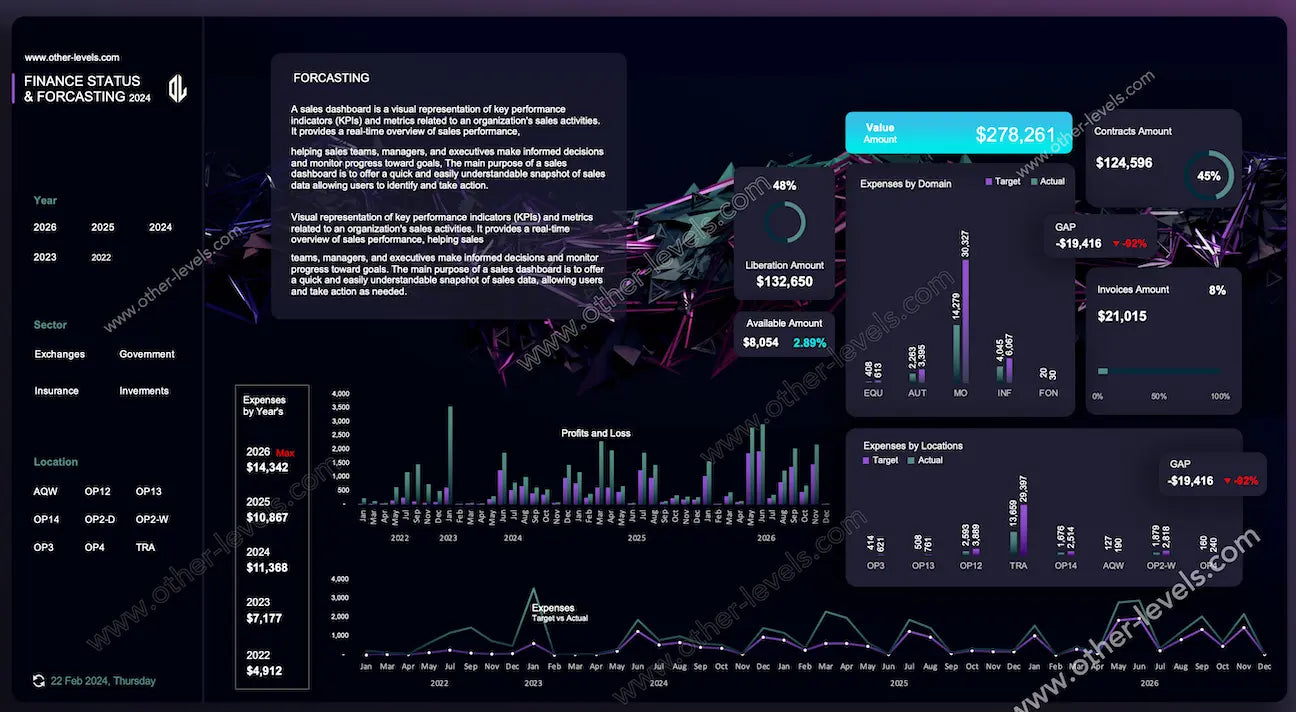
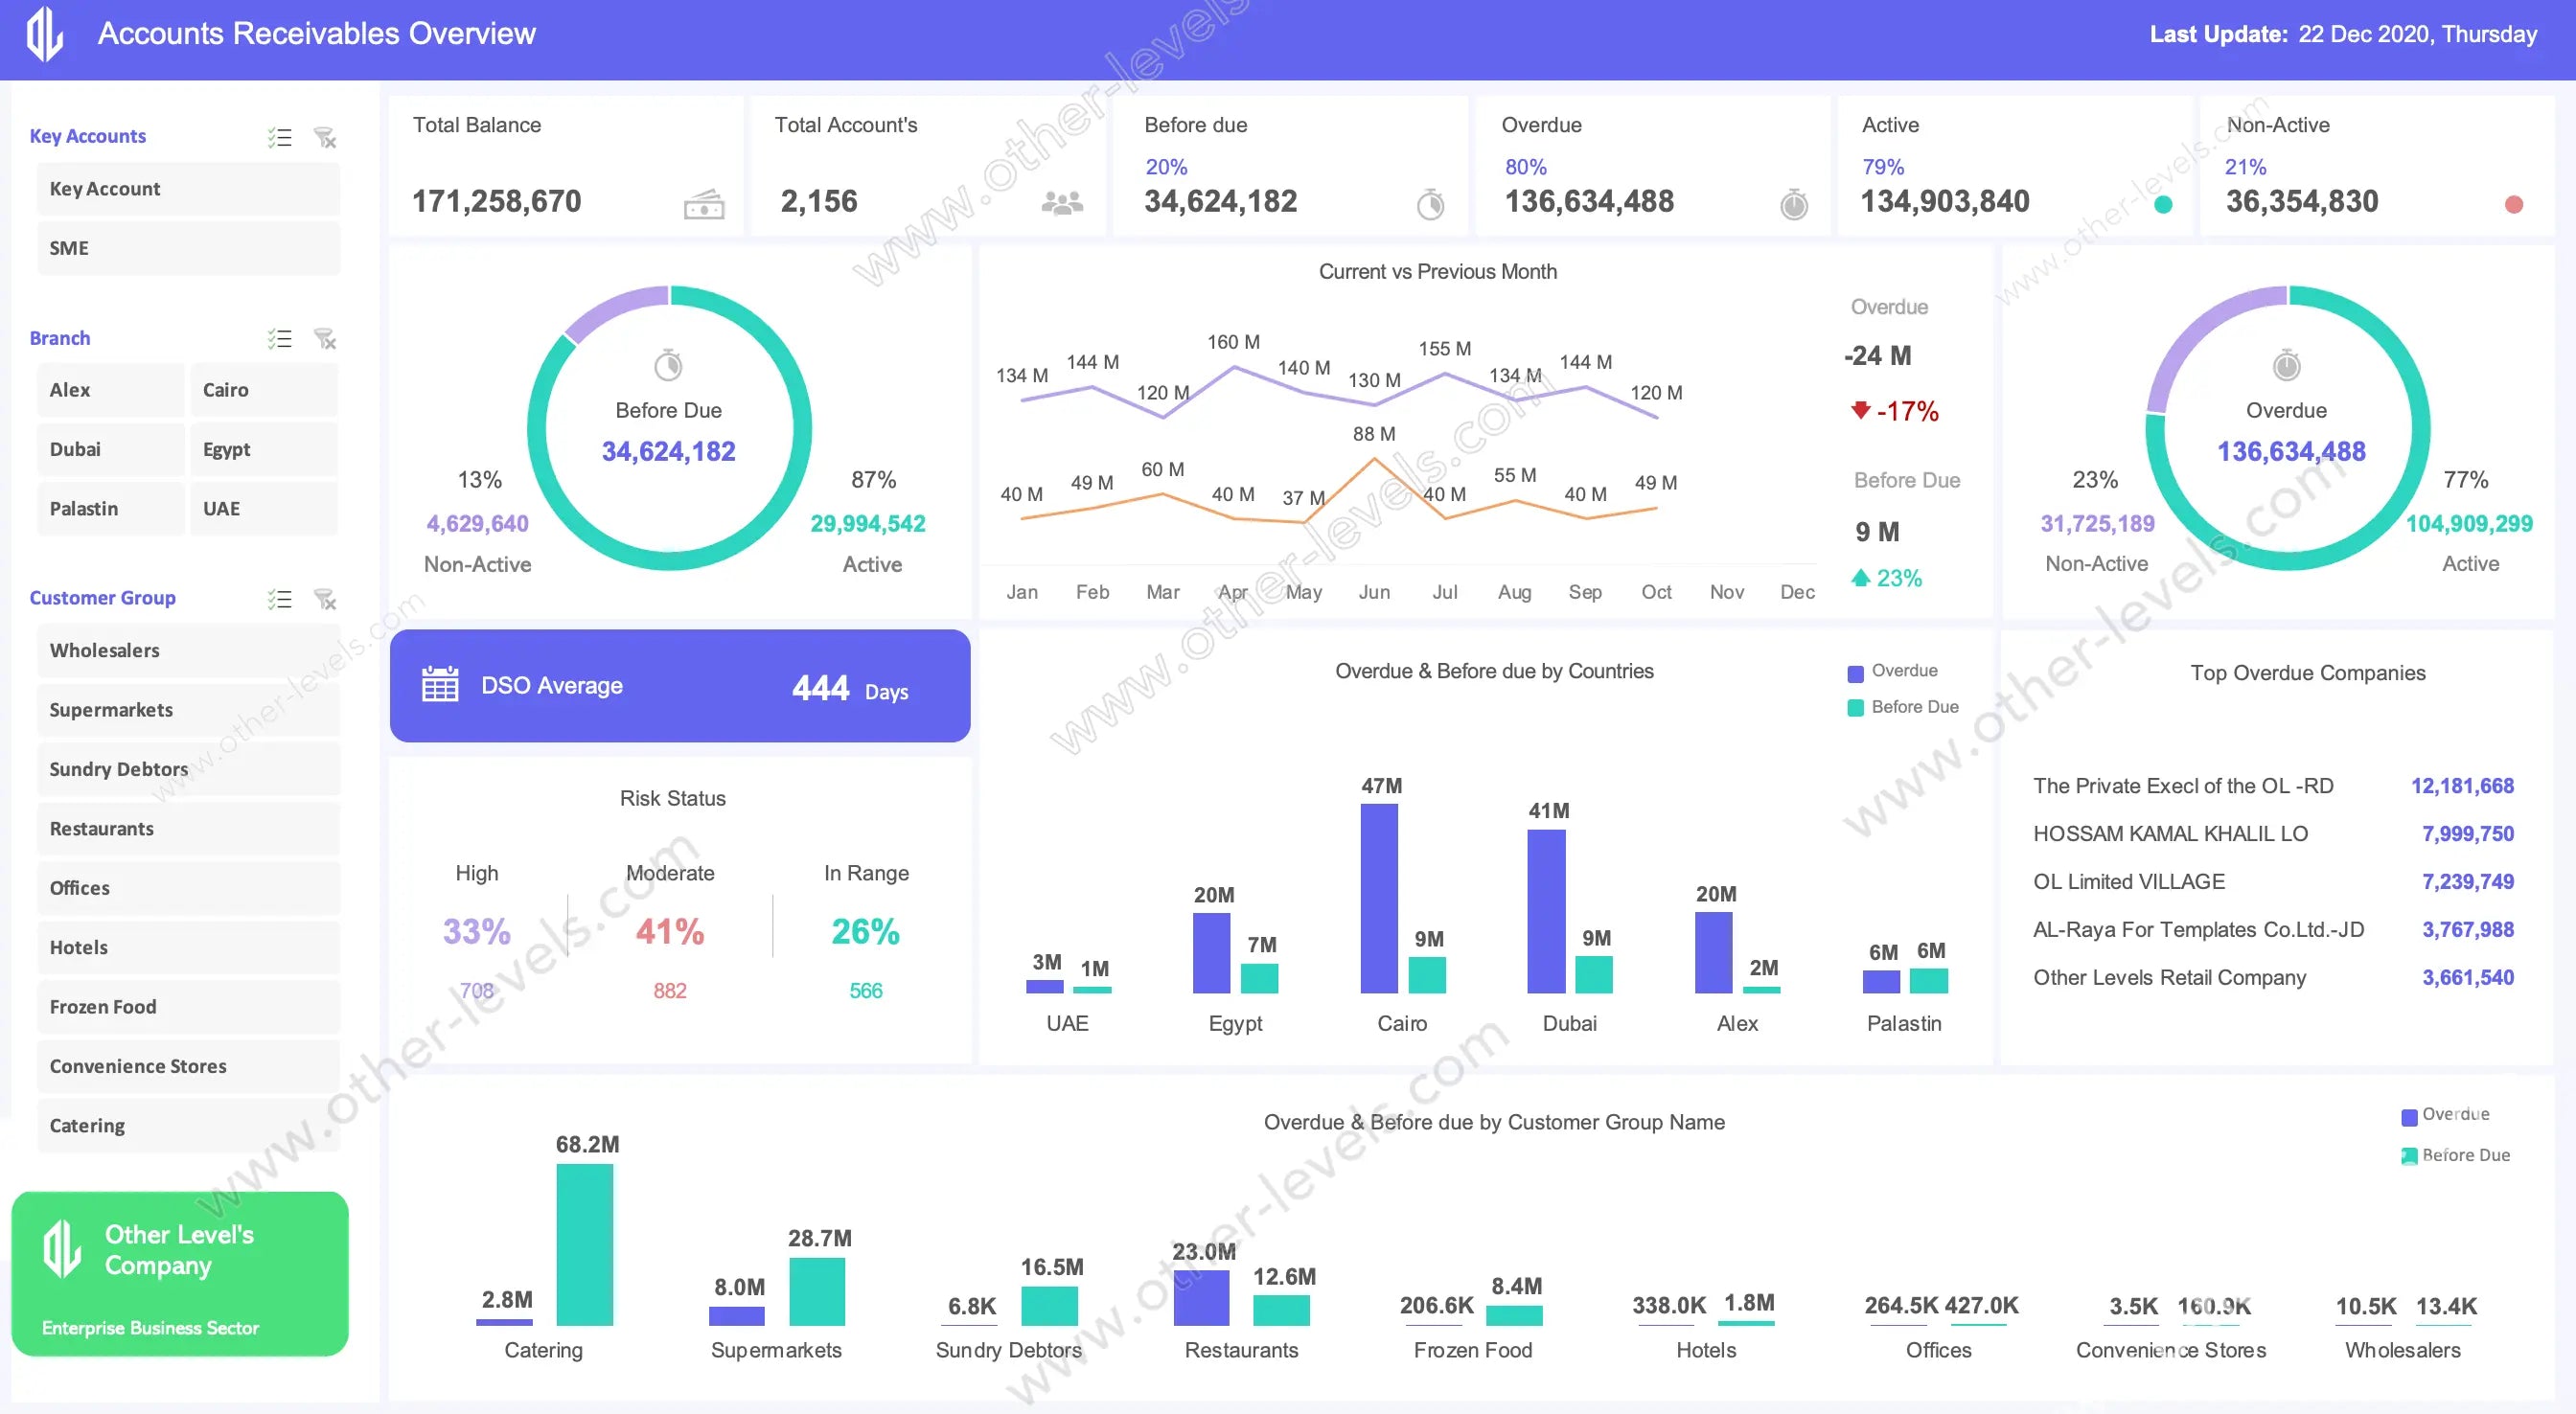
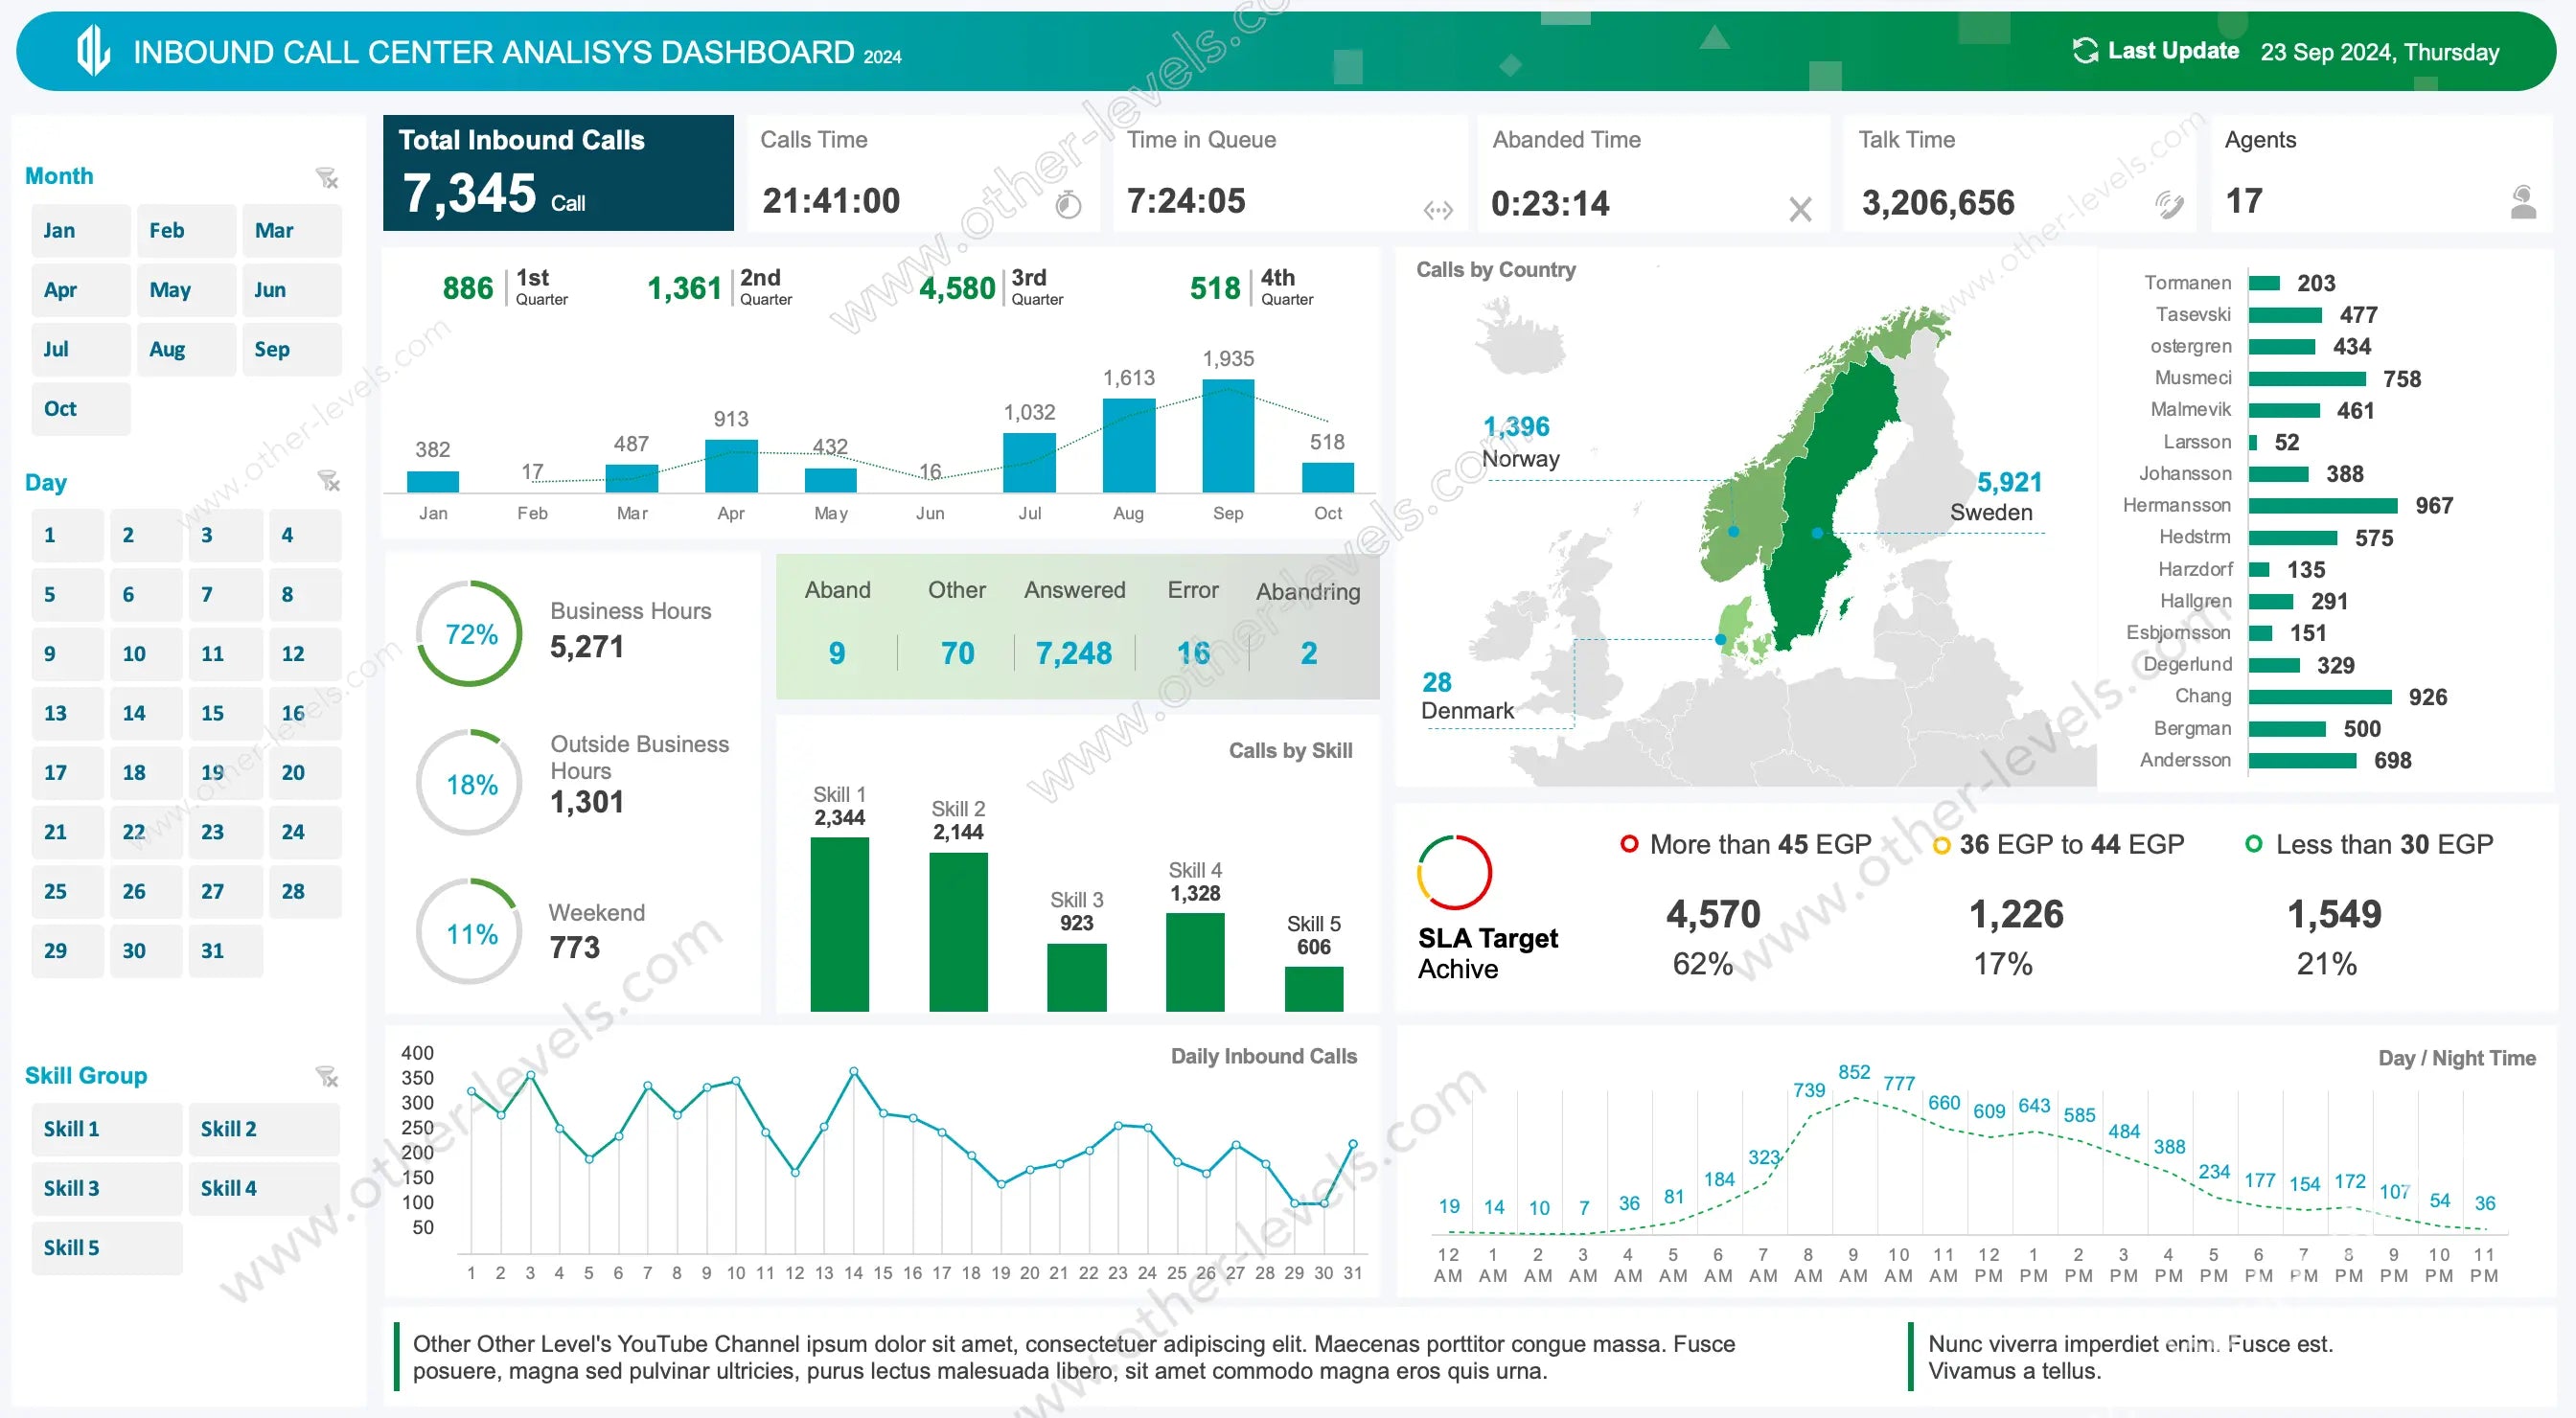
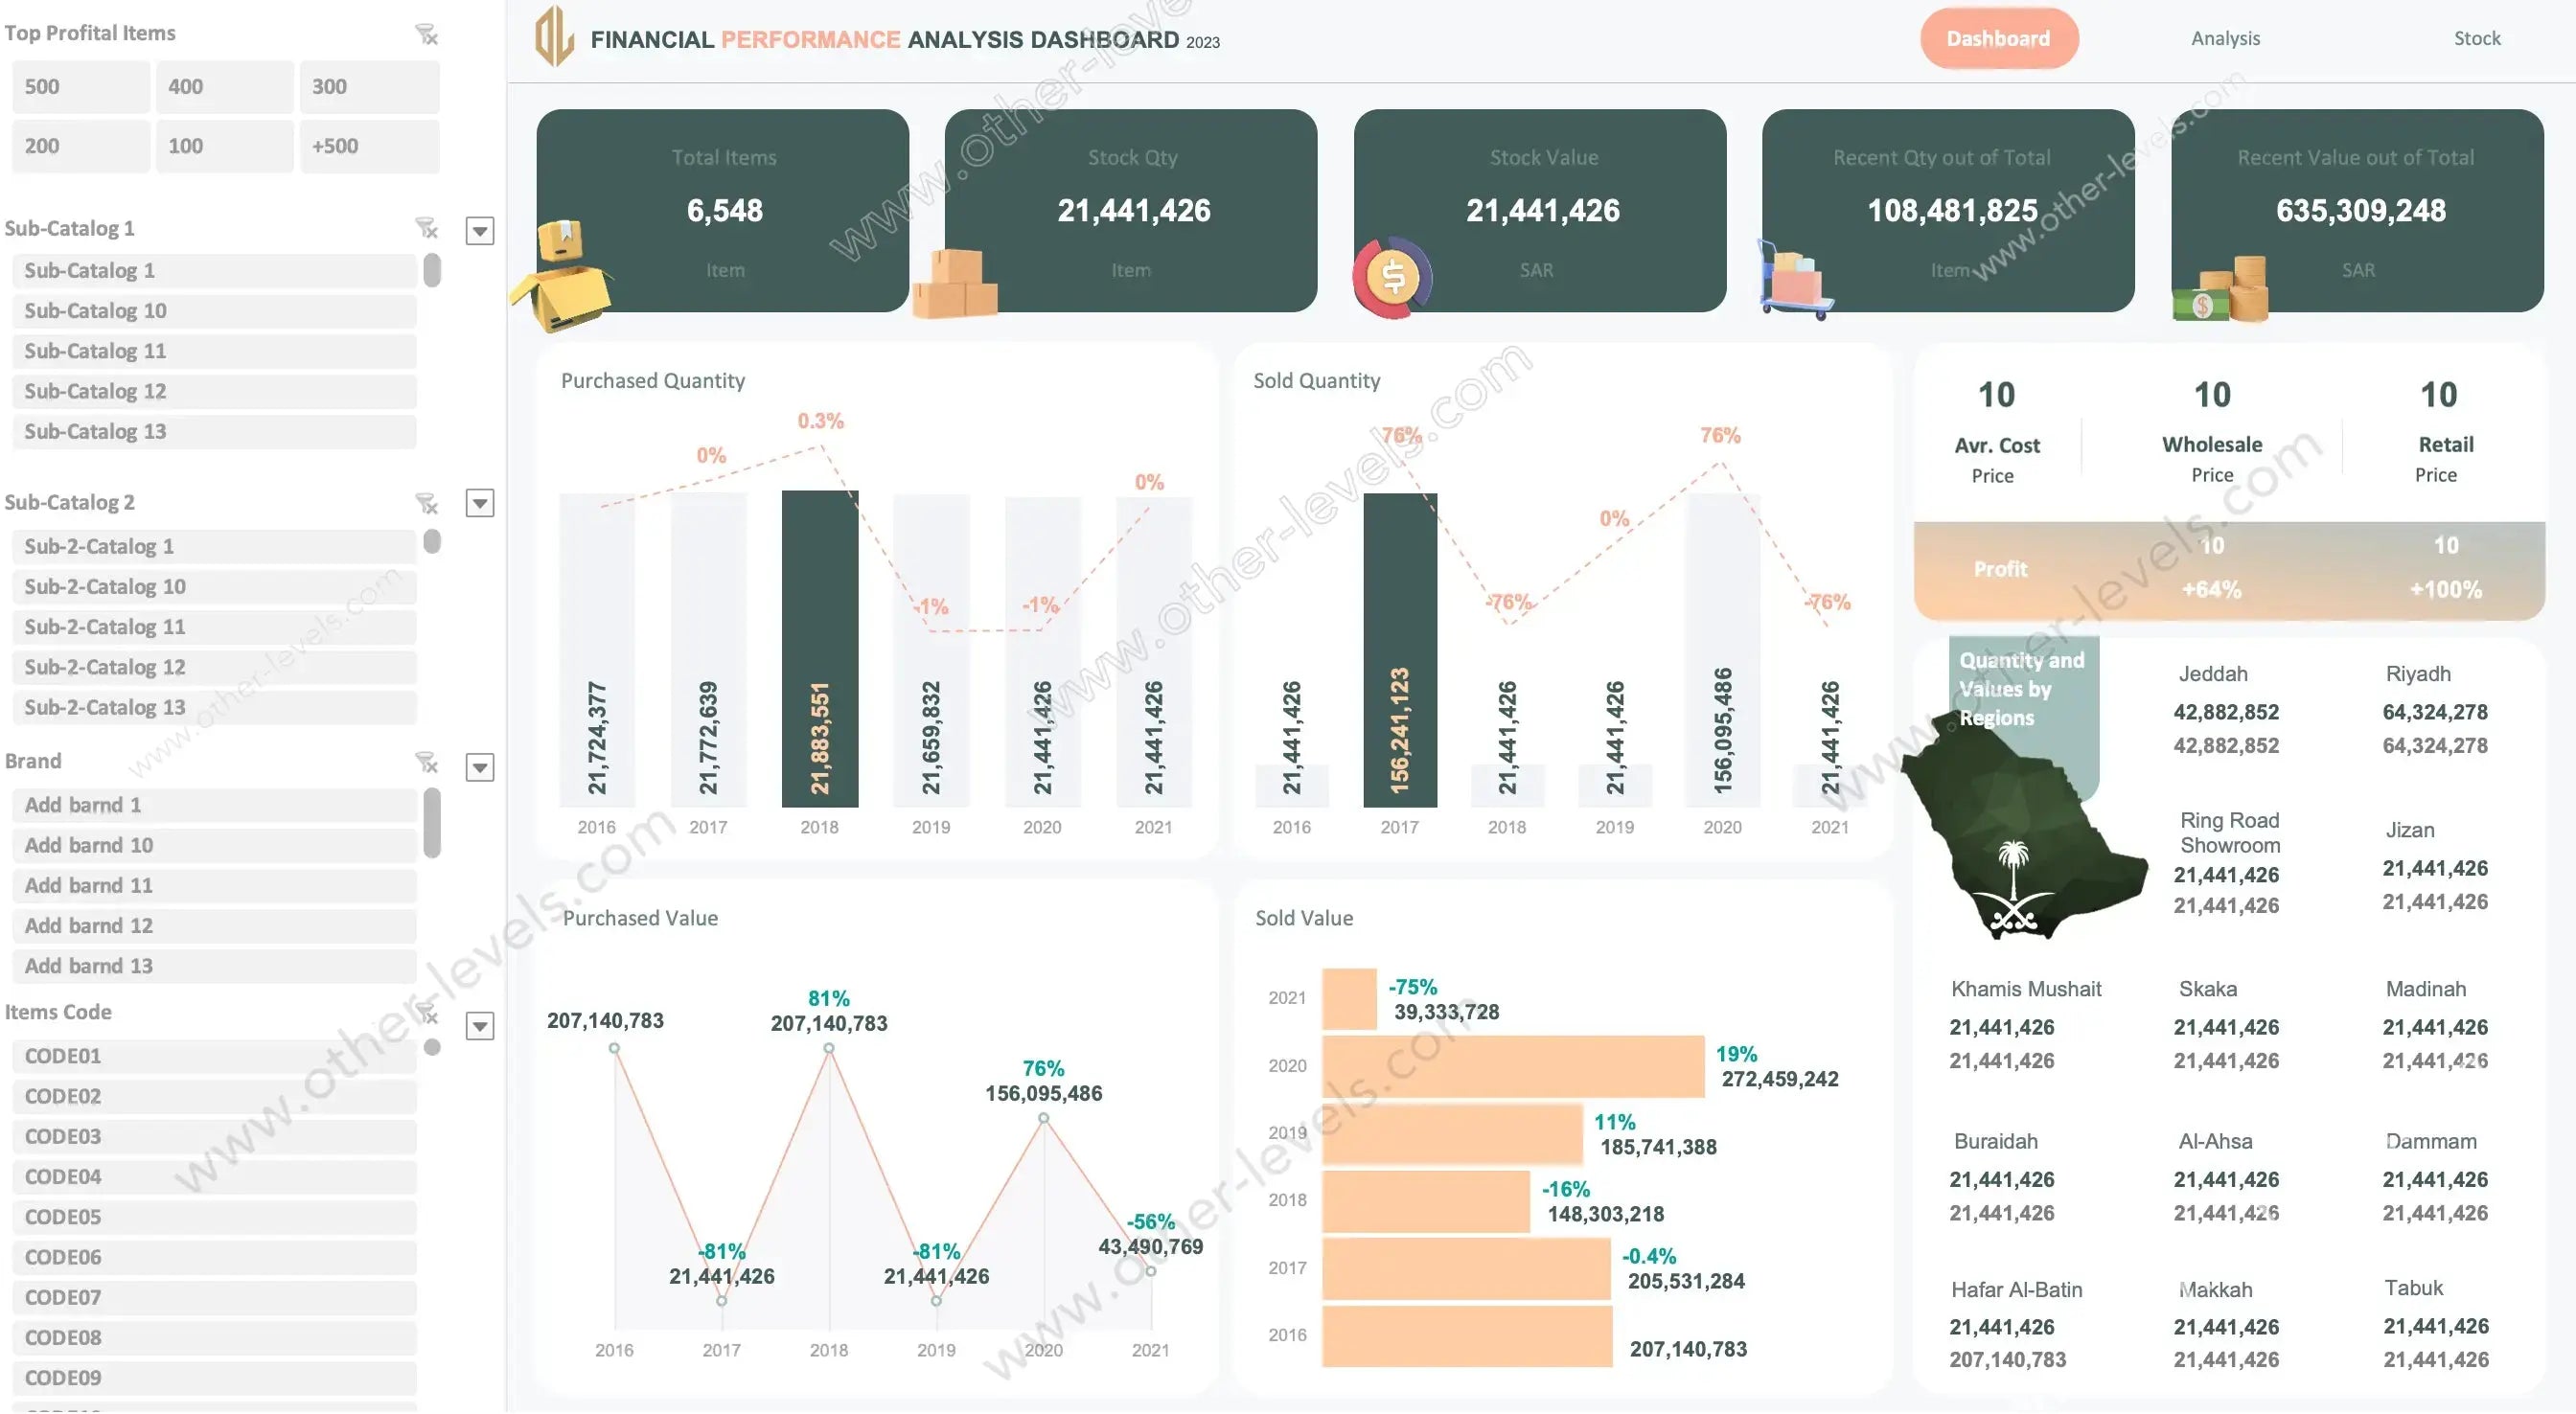
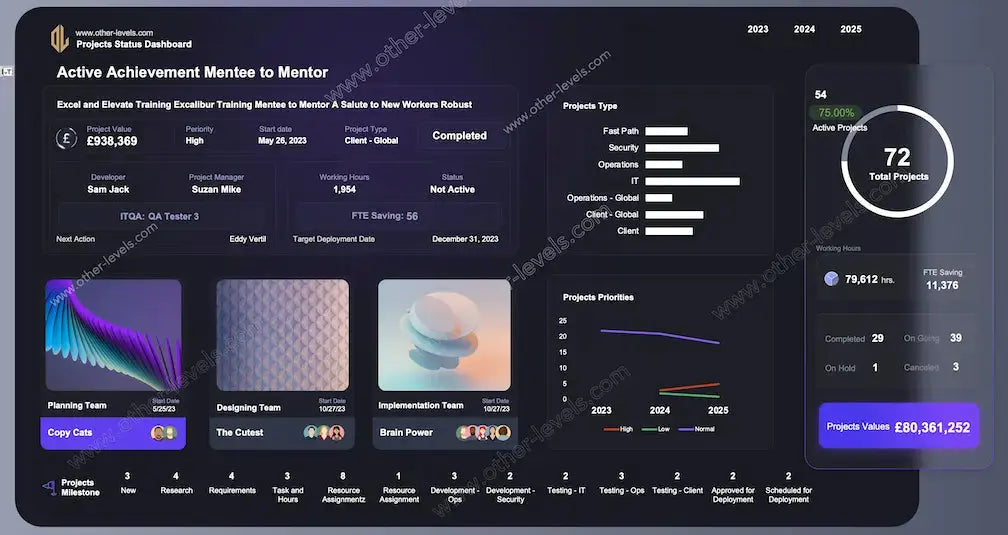
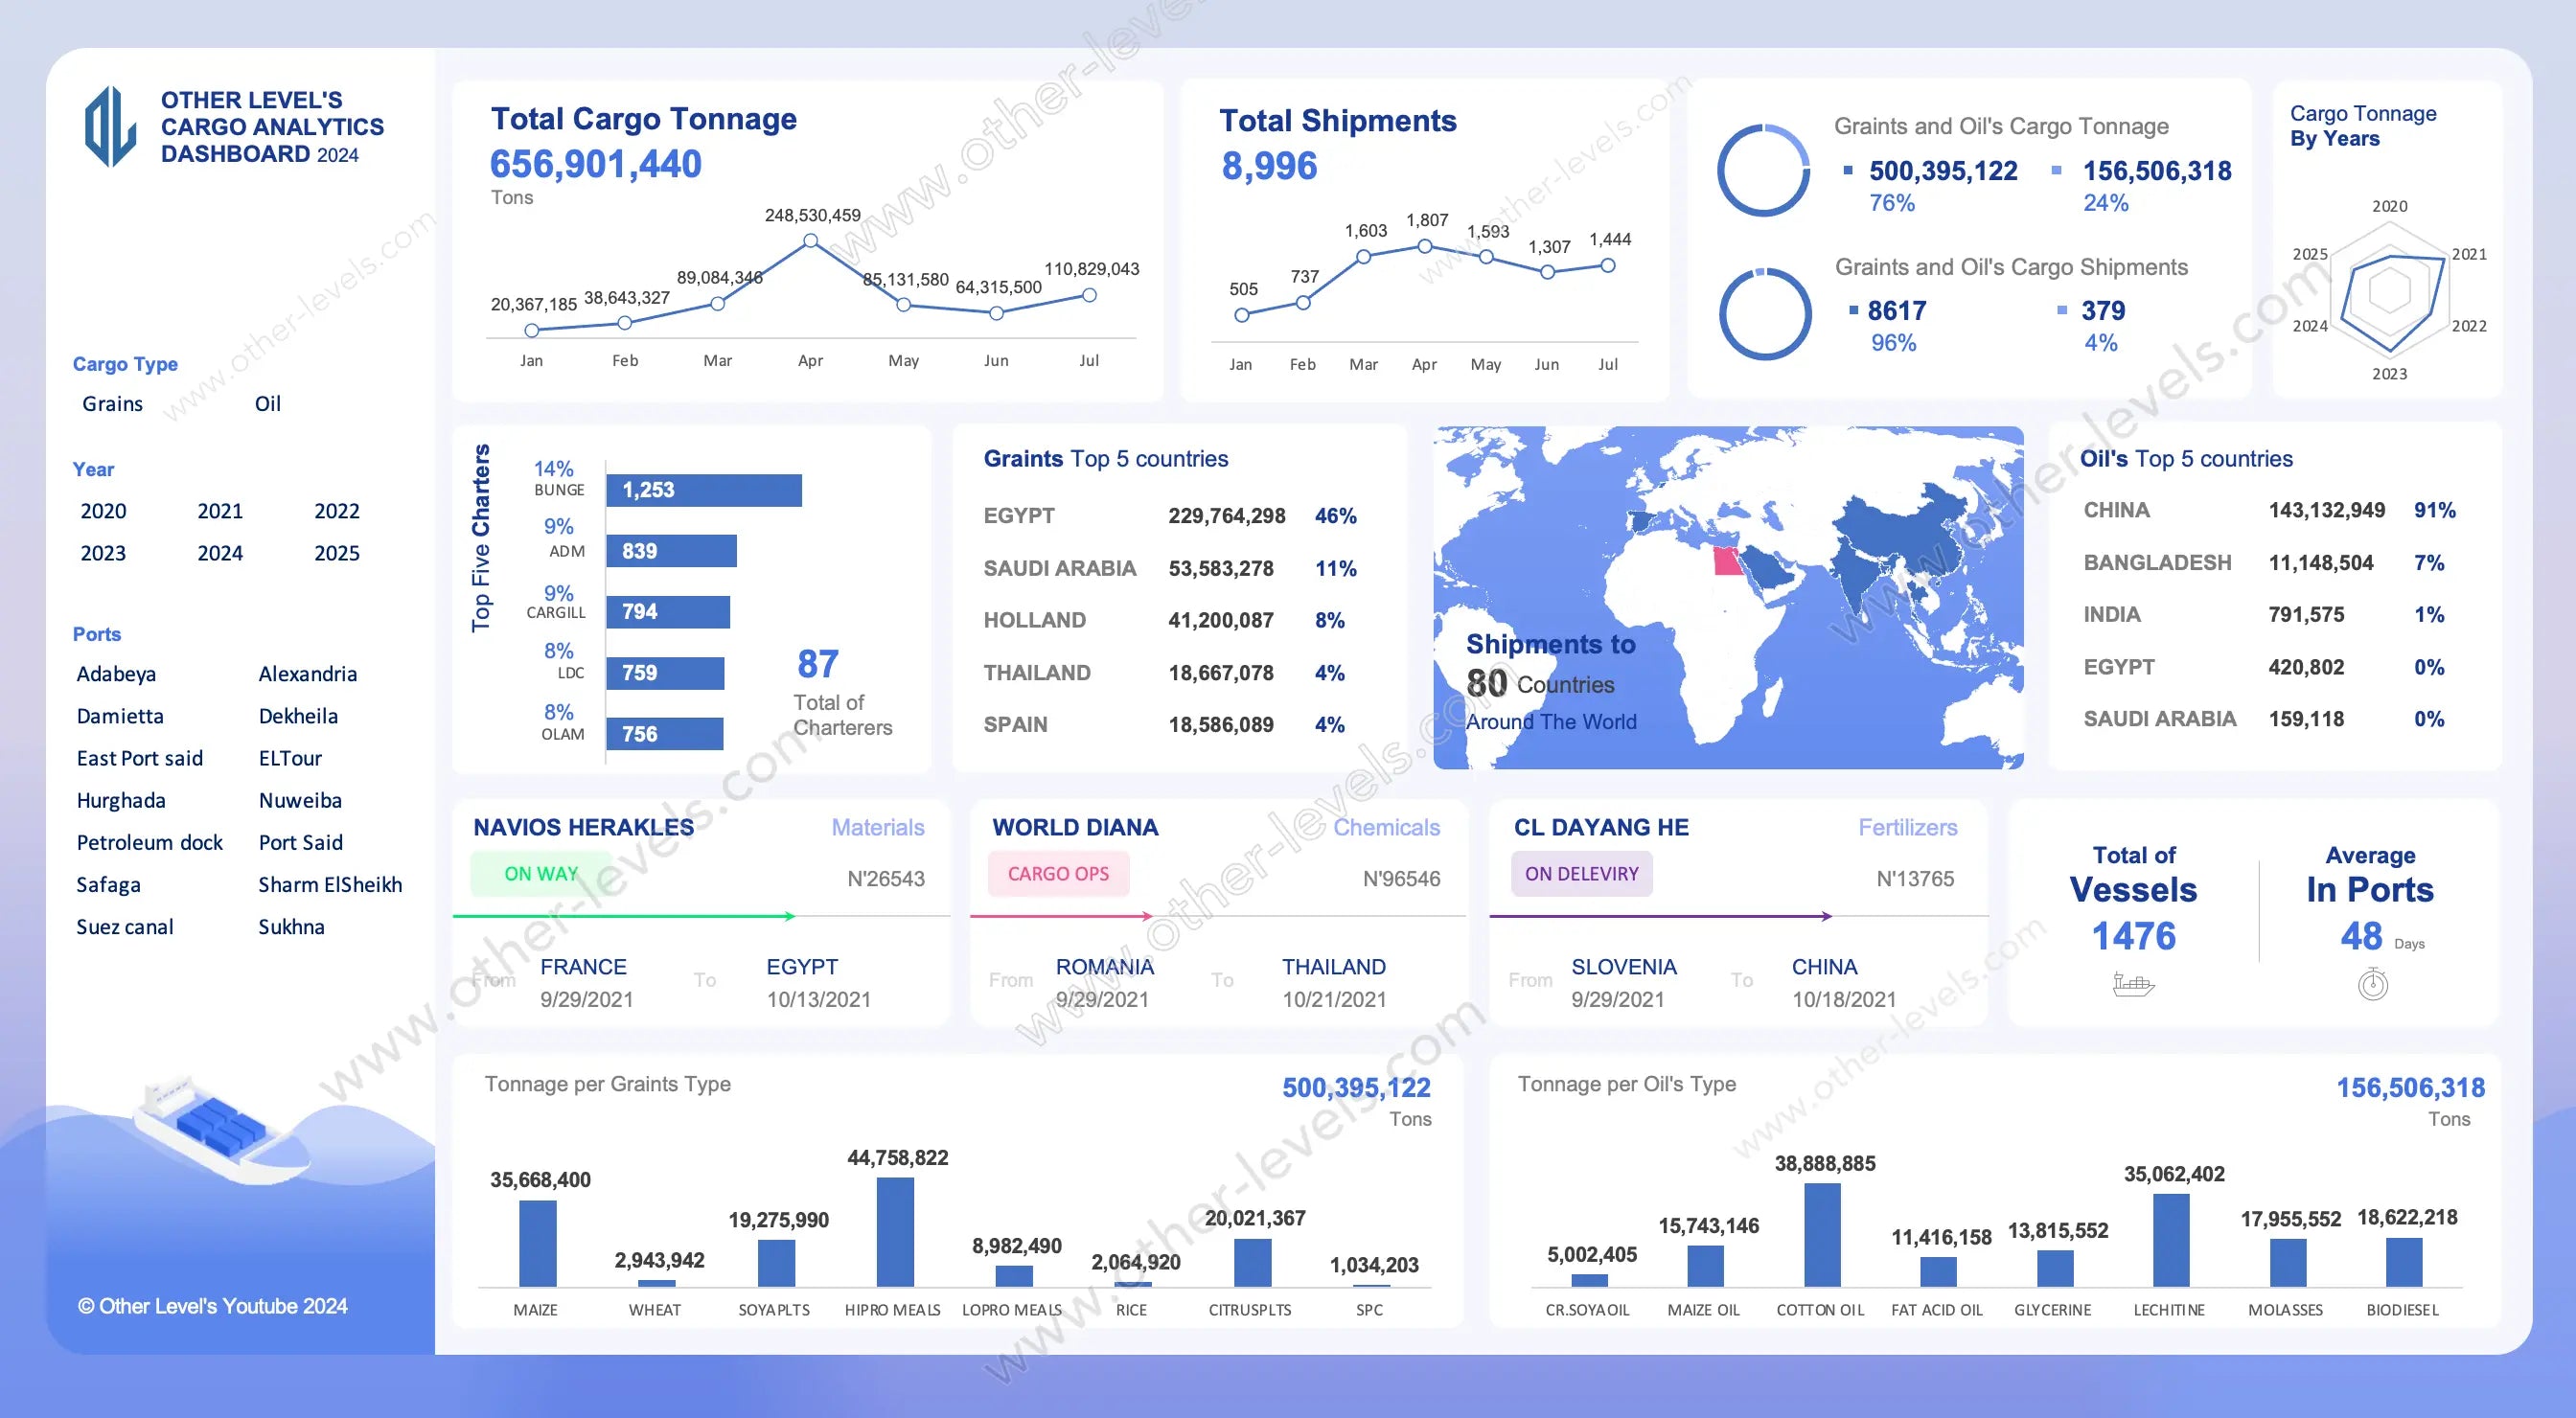
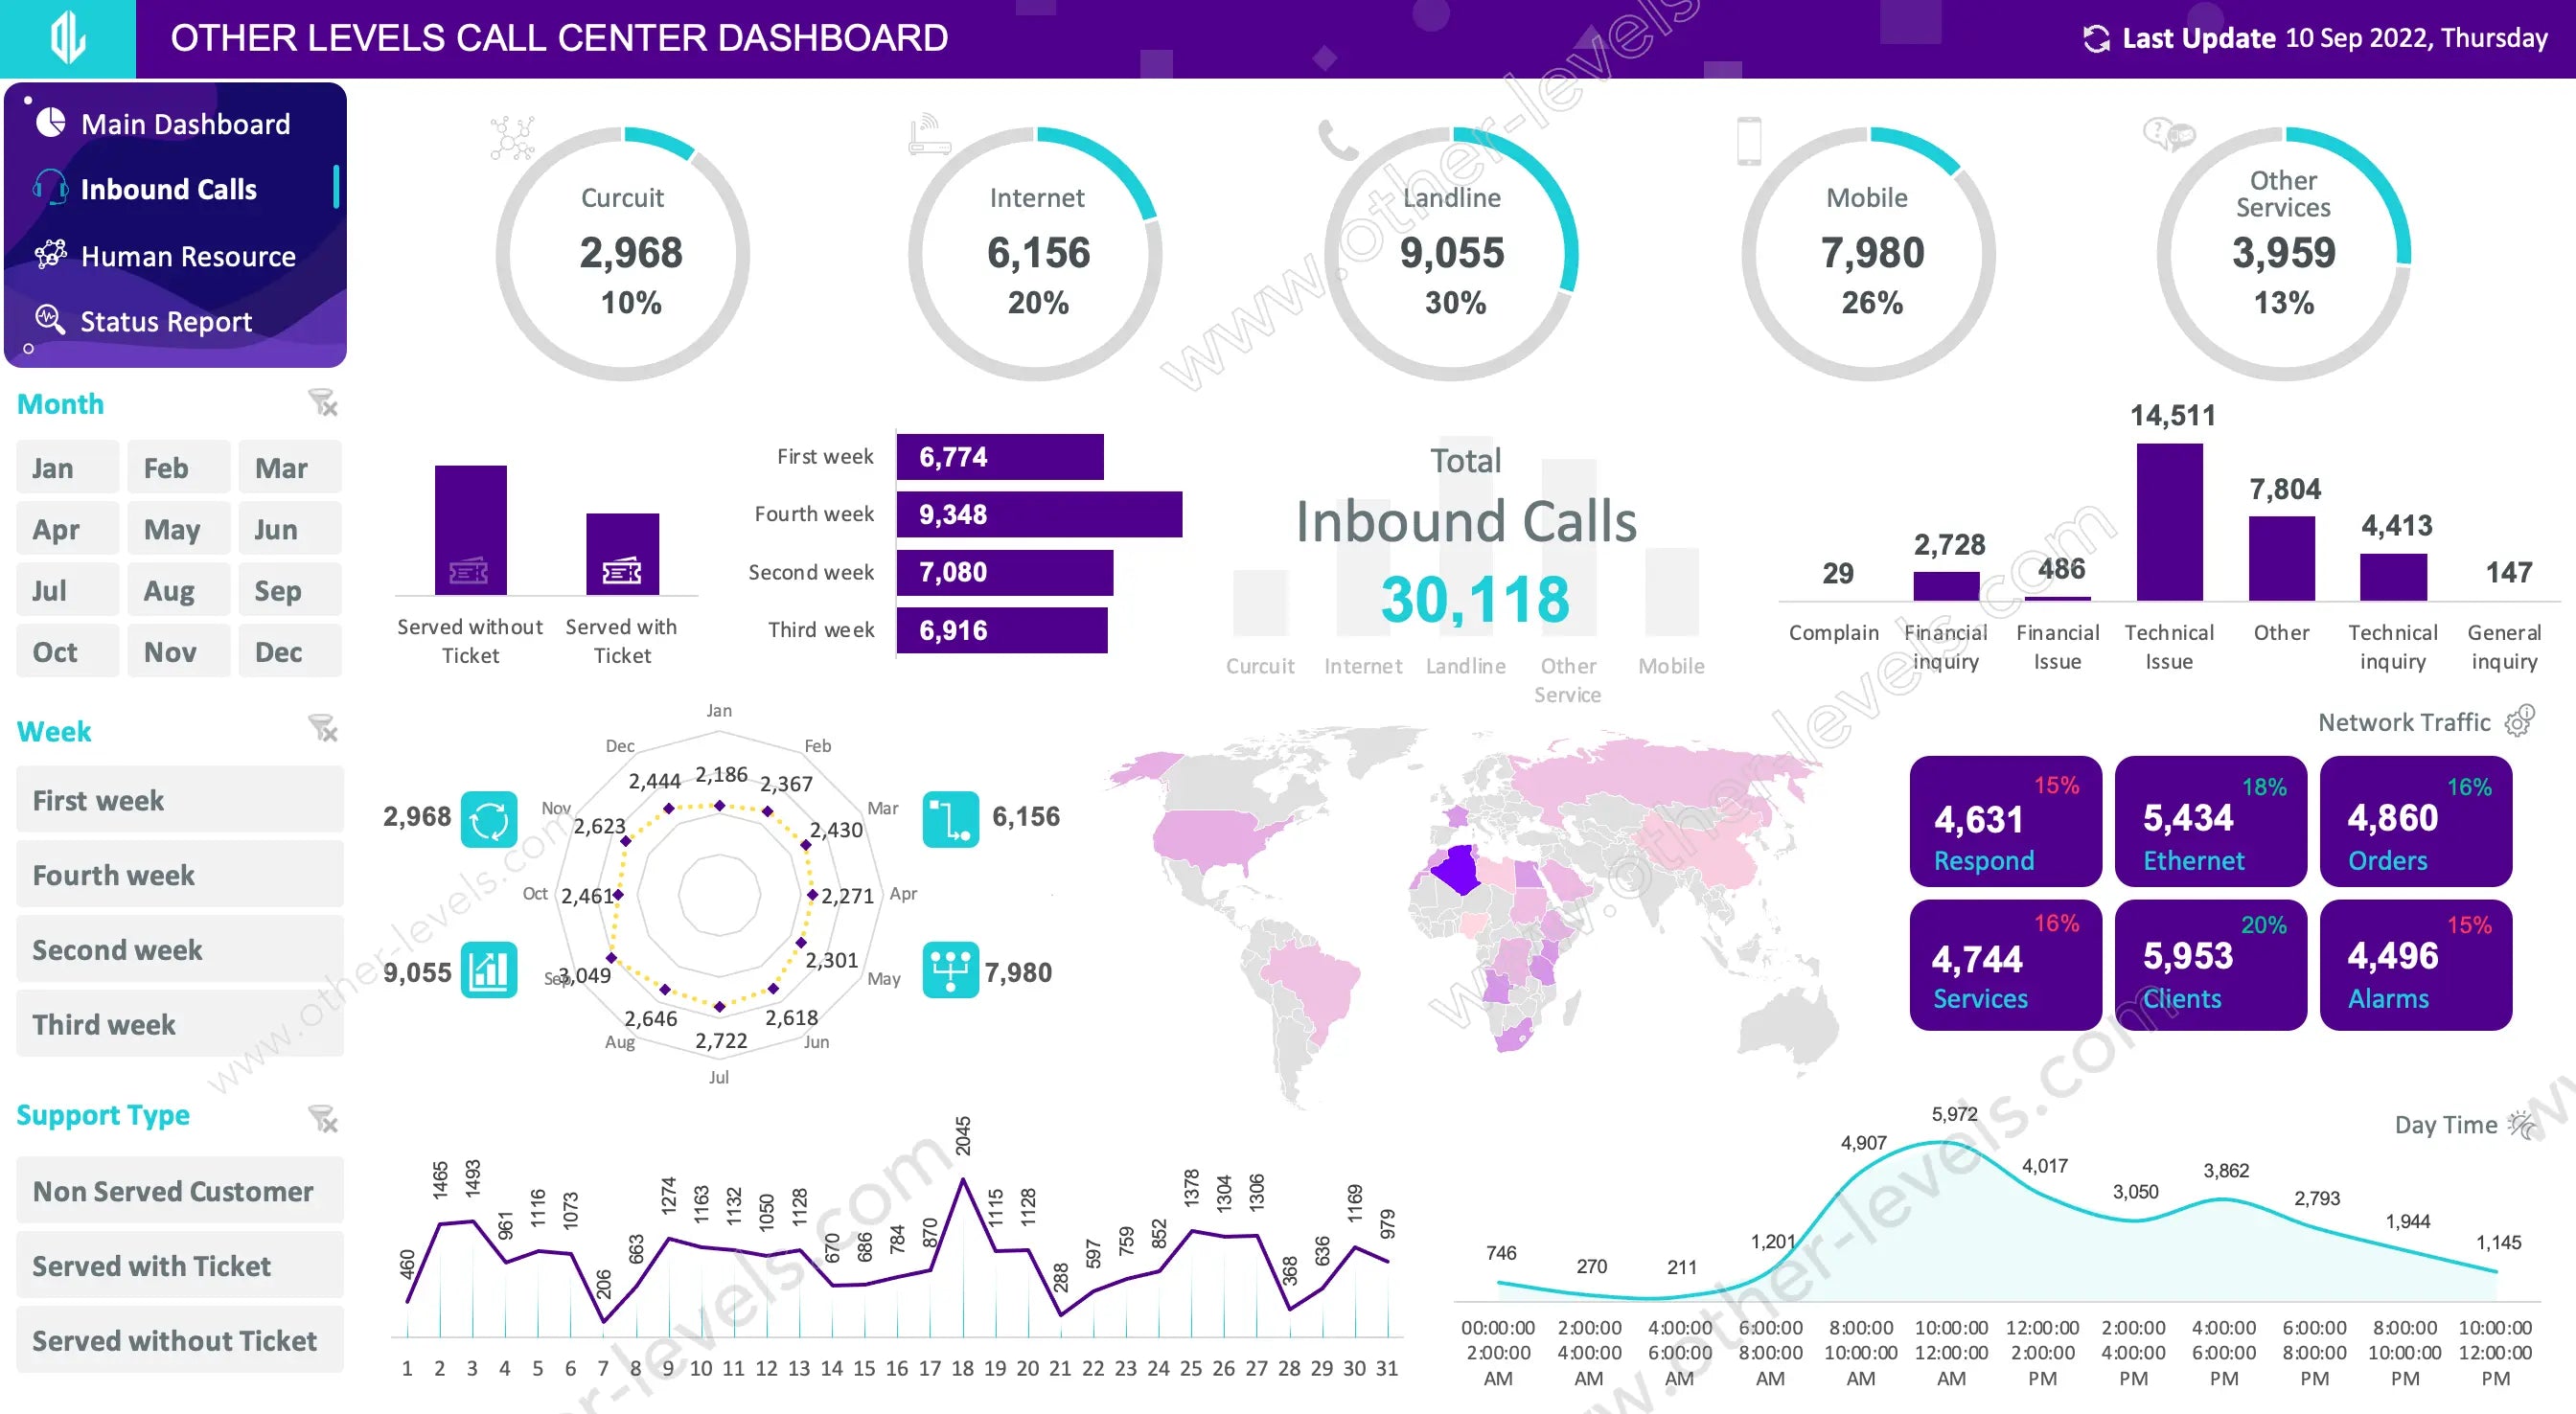
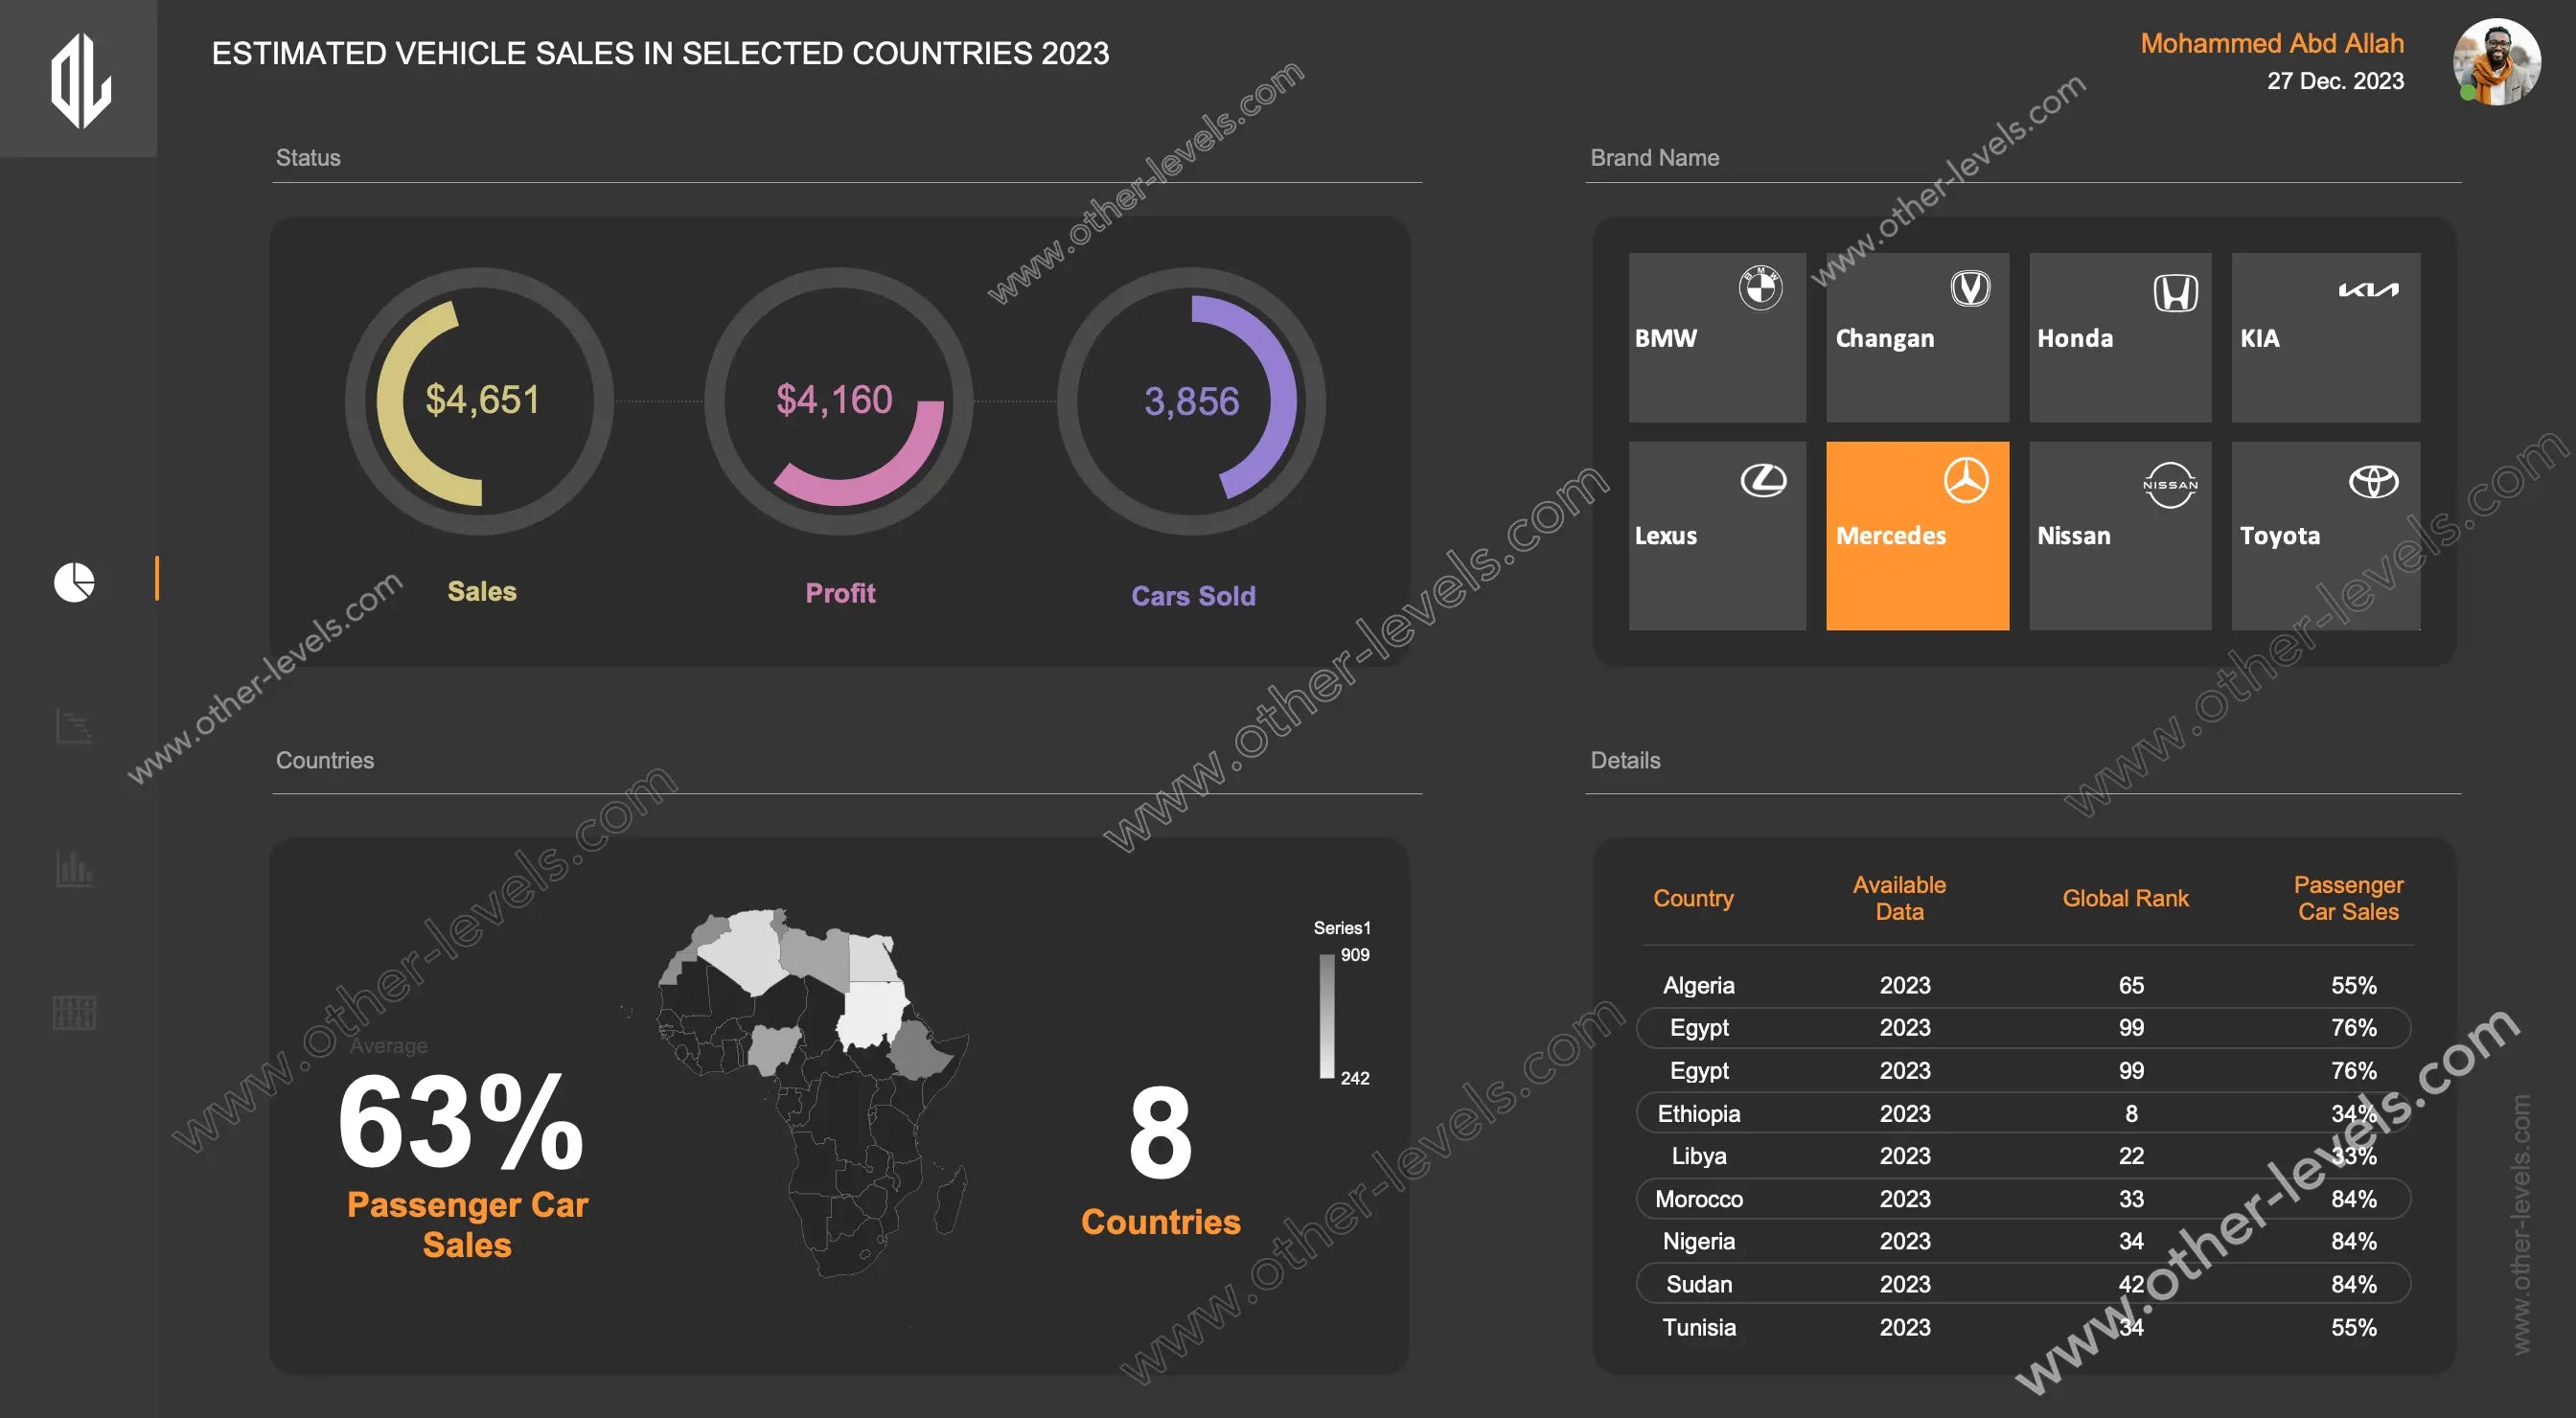
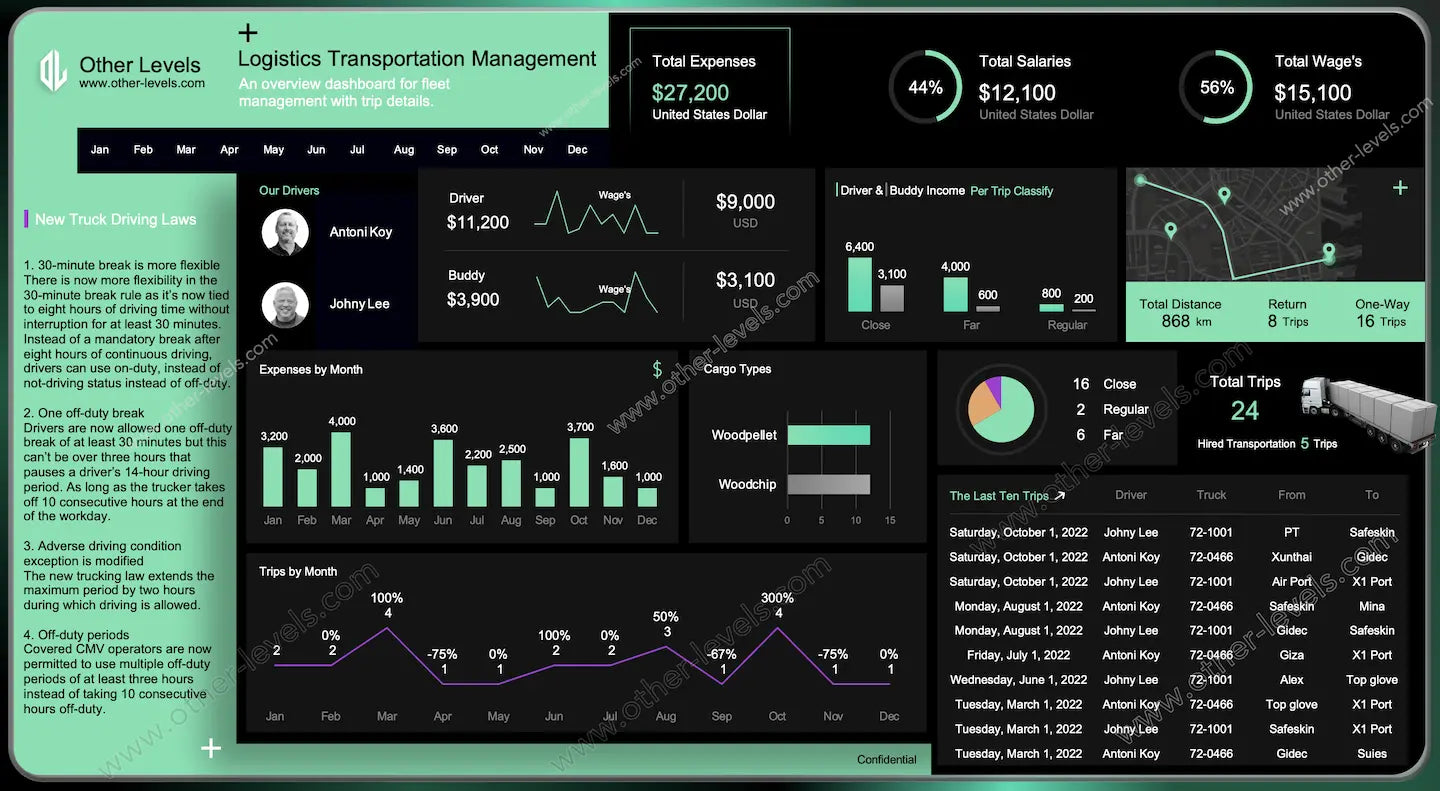
Explore our curated Excel Dashboard Templates — from Finance and Sales to HR and Inventory dashboards. All templates include step-by-step video tutorials on our Other Levels YouTube Channel.